

Key points in one glance
Ethereum price rebounded from a low of $1,385 to $2,700, a rise of 97.7%, but the market shows a split phenomenon of cautious institutional funds and enthusiasm for derivative contracts.
ETF market is unevenly hot and cold: US ETH ETF holdings account for 2.89% of Ethereum's total market value, far below Bitcoin ETF's 5.95%, and funds continued to flow out before April, with limited inflow in May.
On-chain data contradictions: After the price rebound, the number of addresses holding more than 1 ETH decreased, indicating that some investors took profits, but the contract open interest reached a historic high of $32.2 billion, reflecting high leverage bets in the market.
TVL and staking dynamics: The USD-denominated TVL has rebounded to $6.46 billion, but the ETH staking amount has decreased by 20%, possibly due to profit-taking triggered by price increases; Gas fees have dropped by 51.76% year-on-year, but have not stimulated an increase in transaction volume.
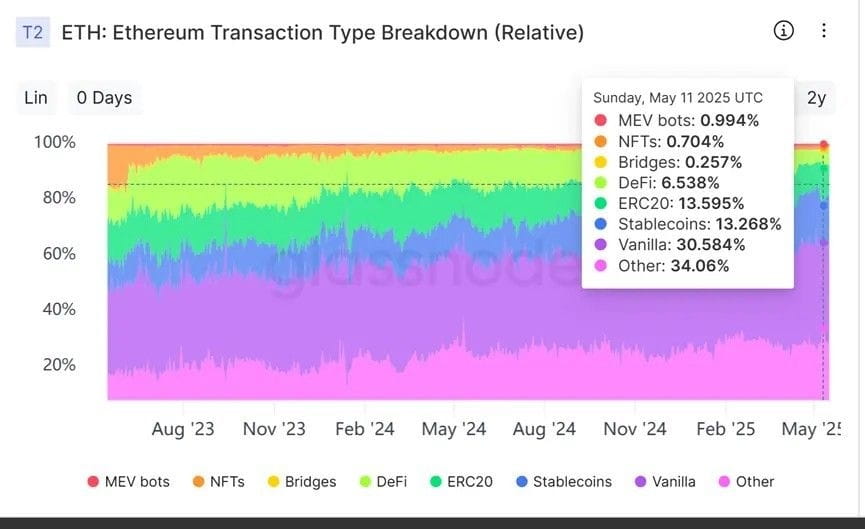
Change in DEX trading structure: Stablecoins dominate on-chain activity, accounting for nearly half of the trading volume, with USDT generating $568 million in fees in a single month, highlighting Ethereum's gradual transformation into a 'whale-exclusive chain' and asset storage center.
Ecological positioning reconstruction: Technological upgrades (such as Pectra) have not significantly improved application activity, and the market needs to re-examine Ethereum's core value in the multi-chain era — shifting from a growth narrative to a long-term role of 'stability and maturity'.
Overall, Ethereum is experiencing a value reconstruction, with the price rebound being a result of the pains of technological optimization and market positioning, making traditional 'good and bad' indicators difficult to define its complex situation.
Market and funds: The caution of ETFs and the enthusiasm for contracts
As of May 18, the total net asset value of US ETH ETFs reached $8.97 billion, accounting for 2.89% of Ethereum's total market cap. Compared to Bitcoin ETFs, which account for 5.95%, this ratio remains relatively low. Overall, it is evident that Bitcoin seems to be more popular in the ETF market.

Additionally, from February to the end of April, the funding status of Ethereum ETFs was mostly in outflow. It was not until April 21 that it began to flow back in again, but the overall inflow data is not significant. In April, Ethereum ETF net inflow was about $66.25 million, and as of May, the net inflow is about $30 million.

According to data from Glassnode, also starting at the end of April, Ethereum's 'Net Unrealized Profit/Loss' (NUPL) value reversed again to a positive number. Prior to this, between April 1 and 22, the NUPL value remained negative. During this time, Ethereum's price fell below $1,800, dropping to a low of $1,385, meaning that when Ethereum's price fell below $1,800, the overall holding addresses were basically in a state of loss. However, this negative data sometimes also indicates a signal of market bottom, as selling pressure is close to exhaustion at this stage. However, as of May 17, the NUPL value reached a maximum of 0.328, indicating that it is still in the early stages of a bull market or recovery period, and has not yet reached an overly optimistic phase.

Another interesting data point is that the number of addresses on the Ethereum chain with balances greater than 1 has decreased with the price rebound, whereas this metric had consistently increased during the previous price decline, indicating that many investors chose to buy the dip during the downward phase. However, when the price rose above $1,800, some addresses chose to take profits. Nevertheless, the decline in this ratio is not significant, only about one-thousandth. With the price recovery, the percentage of profitable addresses for Ether has now reached 60%.

Although the recent price rebound is still far from historical highs, the contract open interest has recently reached a historical high level. On May 14, Ethereum's contract open interest reached $32.249 billion, almost the highest contract holding level ever. The last time the contract volume reached this figure was between January and February 2025, when Ethereum's price fluctuated between $3,000 and $3,800. This also indicates that the market is still very keen to bet on Ethereum.
Overall, looking at the data regarding the market and funds, the price of Ether began to welcome positive capital inflows starting from the bottom range at the end of April, and subsequently, the price also experienced a significant rise, with the highest increase reaching 97.7%, nearly doubling. However, from the perspective of capital inflow, especially the capital flow of ETFs, the proportion of traditional institutional capital increase is still low.

TVL has rebounded, but low Gas has not activated transaction volume
From the perspective of on-chain activity, the change in Ethereum's active addresses is not significant, with current values still fluctuating between 400,000 and 600,000 daily. This fluctuation pattern has been maintained for over a year; however, the recent fluctuation curve has shown a trend of breaking through the 600,000 range.

Another important metric, TVL, shows a more obvious trend of change, with the TVL in USD rebounding since April 22, rising from around $4.5 billion to around $6.46 billion. However, considering the significant rise in Ethereum's price during this period, this change may not reflect the true situation on-chain. When switching the amount of ETH, it can be seen that since April 9, the amount of ETH staked on the Ethereum chain has significantly decreased, from a peak of 30.26 million to a low of 24 million, with a decline of 20%.
The reason for this phenomenon may be due to a portion of funds choosing to lock in profits or avoid unrealized losses during the rapid price increase of Ethereum, leading to a reduction in token quantity.
As for the fluctuation of Gas prices, as of May 16, 2025, Ethereum's average Gas price was 3.572 Gwei, significantly down 21.57% from the previous day, and down 51.76% year-on-year. The overall trend of Gas fees has been declining over the past 30 days, briefly soaring to 10.61 Gwei on May 8, but recently remaining below 8 Gwei, with a low of 1.6 Gwei on May 3. This change is related to EIP-7691 in the Pectra upgrade, which aims to reduce L2 fees by expanding blob space.
However, the extremely low Gas fees do not seem to have stimulated an increase in on-chain transactions. In terms of the daily transaction count, no significant changes have been observed.
DEX trading and asset patterns: Dominance of stablecoins and ecological transformation
Looking at the staking data on-chain, between April 15 and May 5, Ethereum's staking amount was consistently in a net outflow state. In particular, Coinbase has seen a 30% outflow of staking over the past six months. Currently, the validator with the most staking is still Lido, with a staking amount of 9.11 million.

In terms of on-chain DEX trading volume, the Ethereum mainnet has clearly entered an active period after 2025. The activity during this cycle is significantly higher than in 2024, approaching the peaks of 2021 to 2022. However, from the income data, the recent rise in trading activity mainly comes from stablecoin-related transactions, with USDT generating $568 million in fees on Ethereum in the past 30 days. As of May 18, Ethereum remains the public chain with the largest issuance of stablecoins, accounting for over 50%, with a total issuance of $127.3 billion, which is twice the Ethereum DeFi TVL.

Through the analysis of the types of funds on the Ethereum chain, it can be seen that nearly half of the transactions on the Ethereum chain are completed with stablecoins and ETH transfers. The proportion of stablecoin transactions is clearly increasing, while the proportion of DeFi and ERC-20 token transactions is actually still declining. This also indicates that Ethereum is still transitioning to the role of an on-chain asset value storage center, while the development of MEME and application types seems to be limited. Thus, it appears that Ethereum's strategy of attempting to boost activity through reducing fees and increasing transaction speed may be difficult to succeed.
In addition, although the average on-chain transfer amount of Ethereum has recently declined, it still remains between a few thousand dollars to ten thousand dollars. This figure far surpasses that of all public chains, where Solana's data generally only amounts to a few dozen dollars. This indicates that Ethereum is truly a chain exclusive to whales.
Overall, the recent price rebound of Ethereum seems more like a result of the growing pains of transformation. On one hand, the Ethereum ecosystem is striving to optimize performance through continuous technological updates and upgrades, but these efforts seem to have been ineffective. On the other hand, it is the concentration of large funds and stablecoin trading, where whales seem quite satisfied with Ethereum's current on-chain quiet state.
Therefore, the rise and fall of a single indicator has become difficult to simply define Ethereum's 'good' and 'bad'. The market may need to move beyond past growth narratives and re-examine and understand Ethereum's core role and long-term value in a multi-chain landscape. Rather than being obsessed with judging whether it is 'rising' or 'declining', it is better to recognize that after various commotions and iterations, a more mature and 'stable' Ethereum may be the inevitable direction and final appearance of its evolution.
This article is collaboratively reprinted from: (PANews)
More reports
After Pectra, Fusaka is also upgrading! How to integrate into Ethereum's long-term development roadmap?
The Ethereum Argentina Developer Conference is coming! Scalability, security, privacy... key routes for the next decade revealed
Ethereum developers 'generate power with love', with salaries 50% lower than peers! Why are they not swayed by high salaries?

