$IP Don't sleep on this one! #IPUSDT is coiling up for a potential breakout while everyone's distracted. This is a classic "slow and steady" setup with a technical explosion waiting to happen. Time to zoom in! 👇
---
1. PRICE ACTION & CHART PATTERNS: THE QUIET COIL
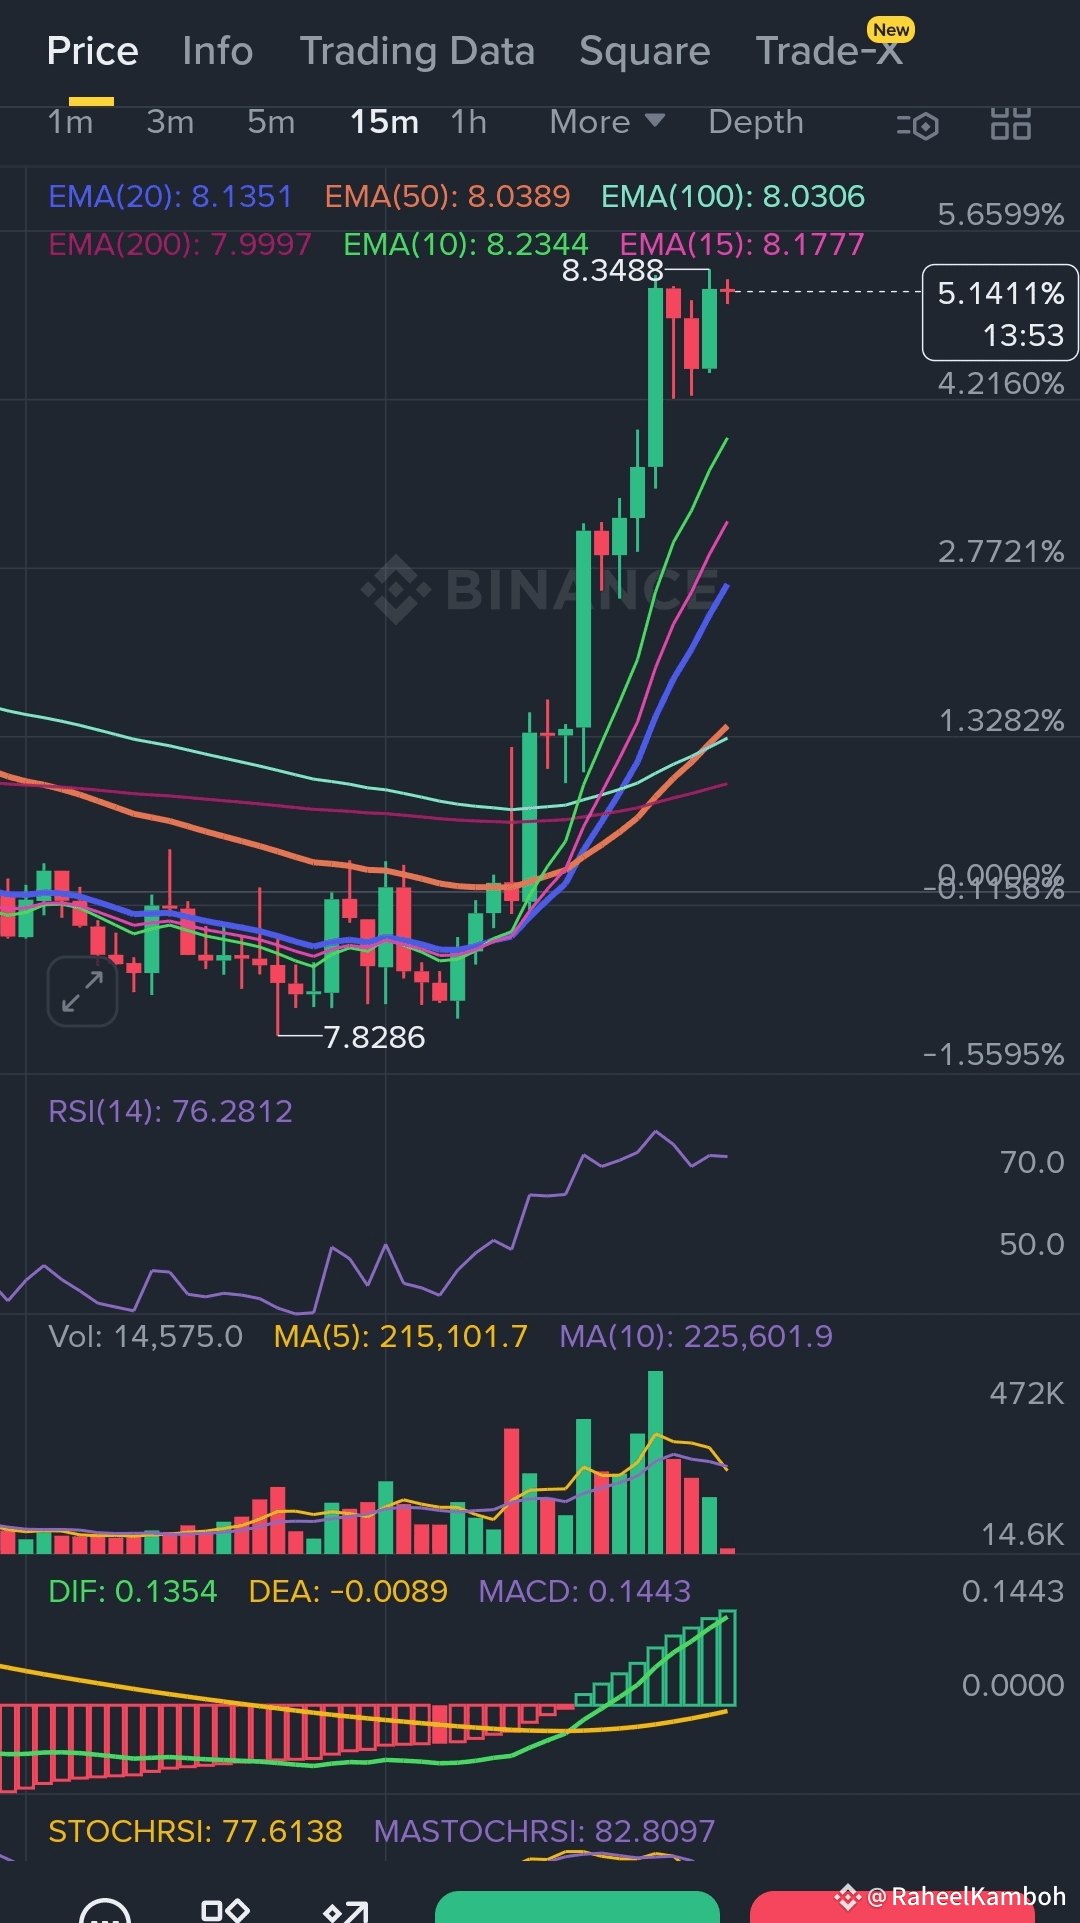
· Current Price: $8.3397 (+0.53%) – Subtle gains, hiding its strength.
· Pattern Identified: A clean Ascending Triangle on the 15m/1h chart! We see consistent higher lows ($8.00, $8.10, $8.20) with a solid resistance wall at $8.35. This is a powerful continuation pattern. 📈
· The Breakout Level: A sustained 15-minute close above $8.350 is the confirmation rocket fuel for the next leg up.
---
2. CANDLESTICK PATTERNS: THE FUSE IS LIT
At the rising support trendline of the triangle, we've seen:
· Multiple Dojis & Small Hammers: These signal indecision followed by buyer absorption. Sellers try to push down, but buyers keep defending higher levels. The Bullish Engulfing candle breaking $8.35 will be your final confirmation.
---
3. TECHNICAL INDICATORS: THE HIDDEN BULLISH ENGINE ⚙️
· EMA Stack: Price is trading ABOVE ALL key EMAs (20, 50, 100, 200). The 20 EMA ($8.135) is acting as dynamic support. This is a STRONG BULLISH ALIGNMENT! 🟢
· RSI(14): Reading 67.06 - 76.28 📈. This is in bullish territory with room to run before being overbought. It shows healthy momentum.
· MACD: A FRESH BULLISH CROSSOVER is in play! DIF (0.1354) has crossed above DEA (-0.0089) and the histogram is green and expanding (MACD: 0.1443). This is a very strong buy signal.
· Volume: Volume is decent, and the moving average of volume is higher, indicating genuine interest.
---
4. MARKET DYNAMICS & DIVERGENCE: THE SMART MONEY CLUE
· Funding Rate: SLIGHTLY POSITIVE (+0.0013%). This is NEUTRAL to slightly positive. It shows a mild bullish bias without excessive leverage, allowing for a stable move up.
· Open Interest (OI): The data is incomplete, but the price action within the triangle suggests OI is likely holding steady or increasing slightly, which is BULLISH for a breakout.
· Basis: The basis is positive, indicating the futures price is trading above the spot price, reflecting bullish market sentiment.
---
🚨 YOUR HIGH-LEVERAGE SCALP SIGNAL (75x SETUP) 🚨
Direction: LONG ✅ (Pattern, indicators, and funding rate all agree) Entry Zone:$8.330 - $8.345 (On a slight pullback within the triangle, OR on a 15min close above $8.355) Take Profit (TP):
· TP1: $8.450 (Quick scalp)
· TP2: $8.550 (Measured move target)
Stop Loss (SL): HARD STOP at $8.280 ❌ (A break below the key 20 EMA and the triangle support invalidates the setup.)
Risk/Reward: This offers a fantastic ~1:4 R/R ratio.
---
5. TRADING PSYCHOLOGY: THE BOREDOM TRADE 😤
· Boredom & Underestimation: A +0.53% move is boring. Most traders will ignore it for flashy pumps. This is your edge. The biggest moves start quietly.
· Fear of Resistance: The $8.35 resistance looks strong. The crowd expects a rejection. Be contrarian. The pattern says breakout.
· Impatience: Waiting for the breakout test requires patience. Don't jump in early. Wait for the confirmation candle to ensure you're on the right side of the move.
Conclusion: This is a high-probability, low-hype trade setup. The ascending triangle, bullish indicator alignment, and neutral funding rate create a perfect storm for a sharp move north.
Trade like a sniper. Precision over impulse. ✅
#IPUSDT #Crypto #TradingSignal #Scalping #TechnicalAnalysis #BinanceSquare #75x #AscendingTriangle #Breakout #SmartMoney #Write2Earn
