$GTC While everyone chases the pumps, smart money is accumulating GTC quietly. This isn't a meme coin frenzy; this is a technical masterpiece unfolding. Time to pay attention. 👁️🗨️ Let's dissect this hidden gem. 🧵
---
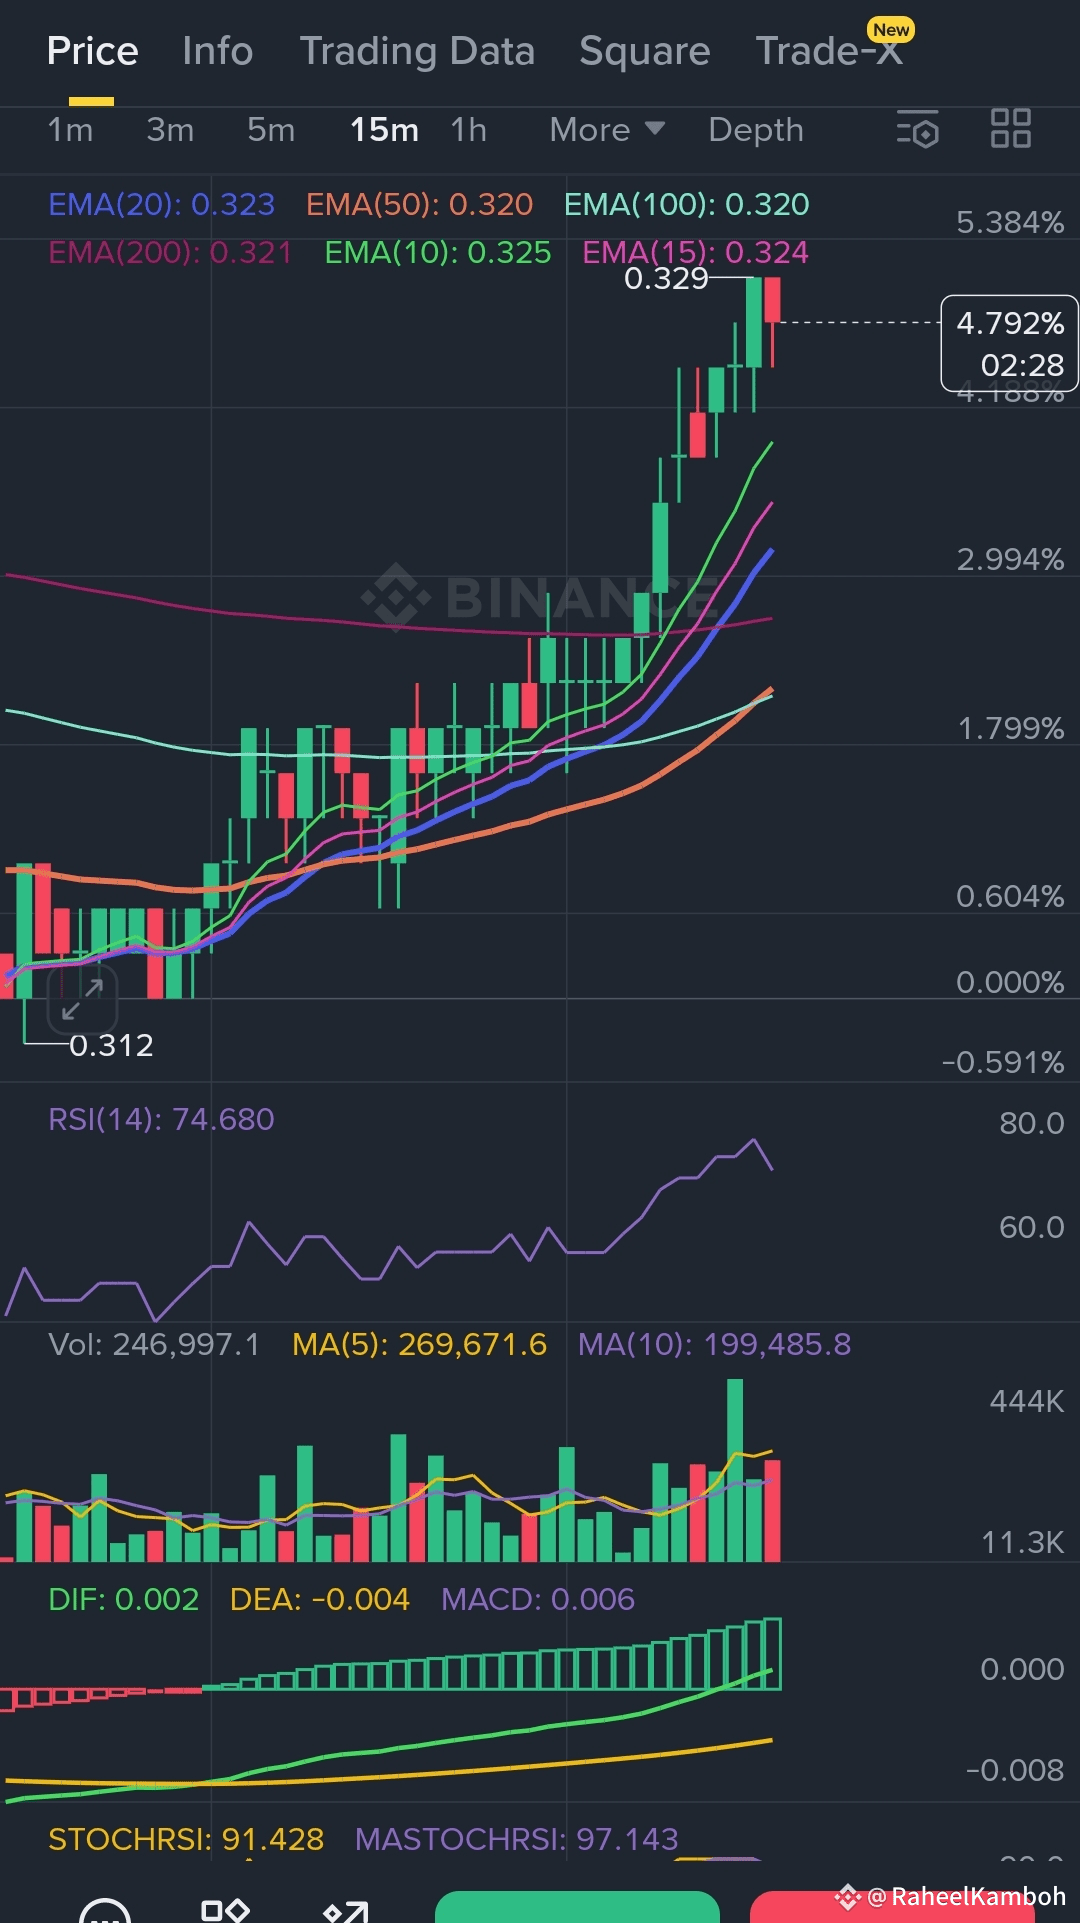
1. PRICE ACTION & CHART PATTERNS: THE COILING SPRING
· Current Price: $0.329 (+1.23%) – Not pumping wildly, which is BULLISH. It's consolidating gains.
· Pattern Identified: A pristine Ascending Triangle on the 1H/4H charts. Higher lows are being established against a static resistance at $0.330. This is a classic continuation pattern.
· The Breakout Level: A sustained 15-minute close above $0.330 is the confirmation that the next leg up has begun.
---
2. CANDLESTICK PATTERNS: THE WHISPER BEFORE THE SHOUT
At the support trendline of the triangle (around $0.325-$0.327), we've seen:
· Multiple Dojis & Hammers: These indicate indecision and then rejection of lower prices. Sellers are exhausted, and buyers are stepping in. The last candle before a breakout is often a Bullish Engulfing pattern. Watch for it!
---
3. TECHNICAL INDICATORS: THE QUIET BULLISH CONVERGENCE ⚙️
· EMA Stack: Price is trading ABOVE all major EMAs (10, 20, 50, 100, 200). The 200 EMA ($0.320) is now strong support. This alignment is extremely bullish for a trend continuation. 🟢
· RSI(14): Reading 68.55 - 74.68. This is bullish territory but not overbought. There's plenty of room to run before hitting 90.
· MACD: A critical BULLISH CROSS is imminent or just happened! DIF (0.002) is pushing above DEA (-0.004) with the histogram turning positive (MACD: 0.006). This is a strong momentum shift signal.
· Volume: Volume (Vol) is respectable and the Moving Average of volume (MA(5)) is higher, indicating genuine interest.
---
4. MARKET DYNAMICS & DIVERGENCE: THE SMART MONEY EDGE
· Funding Rate: SLIGHTLY POSITIVE (+0.0100%). This is NEUTRAL. It means there's no extreme leverage on either side yet. This is healthy and avoids a imminent long squeeze. It allows for a stable climb.
· Open Interest (OI): OI is holding relatively steady at ~11.4M while price consolidates. This is Bullish! It shows positions are being held, not closed, in anticipation of the move. No selling pressure.
· Long/Short Ratio: This is the KILLER signal. The ratio is massively high (2.68). Top traders are overwhelmingly LONG. They are positioned for upside. Follow smart money.
---
🚨 YOUR HIGH-LEVERAGE SCALP SIGNAL (50x SETUP) 🚨
Direction: LONG ✅ (Smart money is long, pattern is bullish) Entry Zone:$0.3280 - $0.3295 (On a slight pullback to support, OR on a 15min close above $0.3305) Take Profit (TP):
· TP1: $0.3350 (Quick scalp)
· TP2: $0.3400 (Next key resistance)
Stop Loss (SL): HARD STOP at $0.3240 ❌ (Just below the key 200 EMA and the triangle support. Protects your capital.)
Risk/Reward: This offers a stellar ~1:3 R/R ratio.
---
5. TRADING PSYCHOLOGY: THE CALM BEFORE THE STORM 😤
· Boredom & Impatience: This chart is boring right now. Most traders will scroll past it looking for +20% green candles. This is your edge. The biggest moves start from quiet consolidation.
· Fear of Breaking Out: People see resistance at $0.330 and assume it will reject. Be contrarian. The pattern, the indicators, and the OI all scream that a breakout is more likely.
· The "Missed It" Feeling: You haven't missed it. You are perfectly positioned before the crowd FOMOs in after the breakout candle.
Conclusion: This is a high-probability, low-noise trade setup. All elements align for a push towards $0.335 and beyond.
Trade like a sniper, not a machine gunner. Patience pays. ✅
#GTCUSDT #Crypto #TradingSignal #Scalping #TechnicalAnalysis #BinanceSquare #50x #Breakout #AscendingTriangle #SmartMoney #Write2Earn
