$AERO Get ready, because #AERO is fueling up for a massive move! While it's already pumping +4.30%, the real squeeze is JUST getting started. This is not a drill! Time to analyze and execute. 👇
---
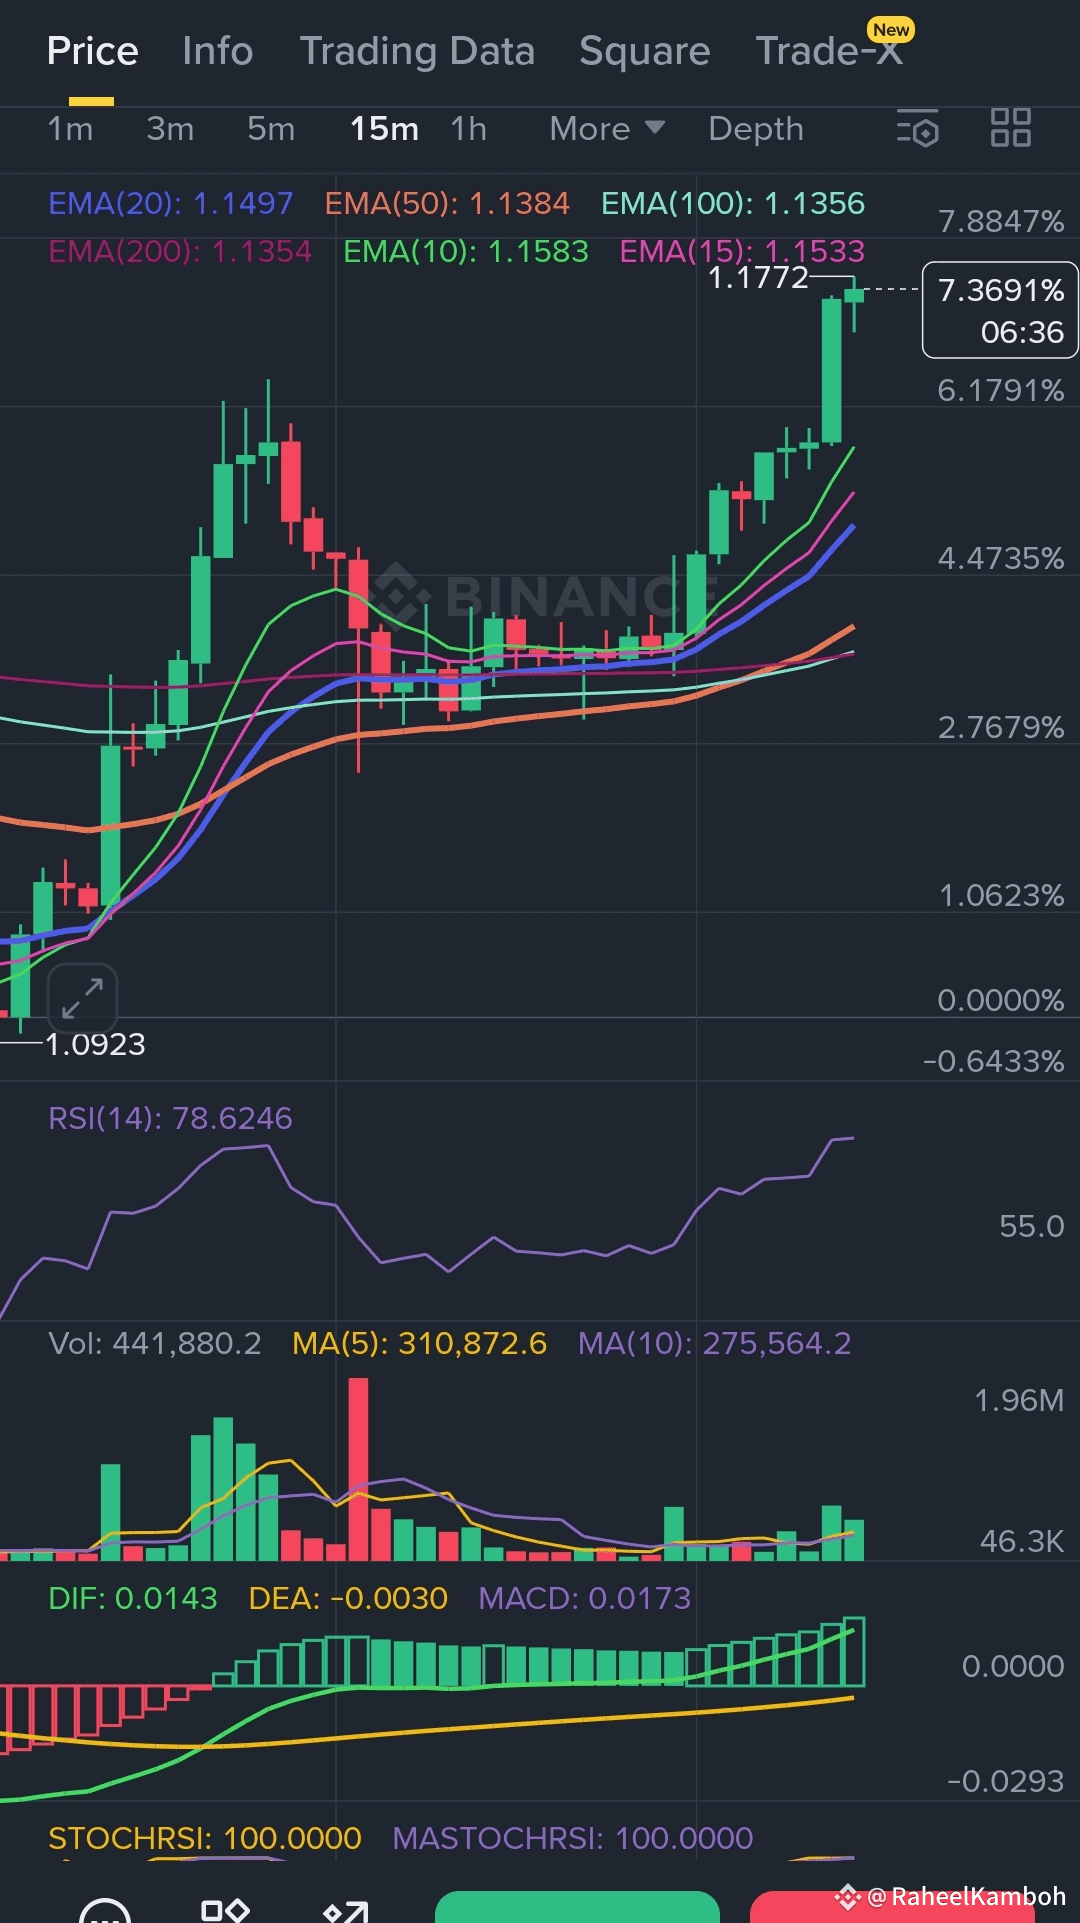
1. PRICE ACTION & CHART PATTERNS: THE BULLISH CONTINUATION
· Current Price: $1.1758 (+4.30%) – Strong momentum!
· Pattern Identified: A clear Bull Flag pattern on the 15m/1h chart! The sharp upward move (flagpole) followed by a slight consolidation (flag) indicates a potential continuation upwards. 📈
· Key Resistance Break: Price has broken above the $1.1700 level. A sustained close above $1.1800 confirms the next leg up.
---
2. CANDLESTICK PATTERNS: THE CONFIRMATION
At the support of the flag (around $1.1550-$1.1600), watch for:
· Bullish Engulfing Patterns: These indicate strong buyer dominance.
· Hammer Candles: Showing rejection of lower prices. The most recent green candle breaking out is your confirmation to enter!
---
3. TECHNICAL INDICATORS: THE BULLISH ALIGNMENT ⚙️
· EMA Stack: Price is trading ABOVE ALL key EMAs (10, 20, 50, 100, 200). The shorter EMAs are acting as dynamic support. This is a BULLISH ALIGNMENT! 🟢
· RSI(14): Reading 78.62 📈. This is overbought, but in a strong trend, RSI can stay overbought. It signals strong momentum.
· MACD: Bullish Crossover! DIF (0.0143) has crossed above DEA (-0.0030) with the histogram turning positive (MACD: 0.0173). This is a STRONG BUY SIGNAL.
· Stochastic RSI: At 100.0 – Extremely overbought, but confirms the intense buying pressure.
---
4. MARKET DYNAMICS & DIVERGENCE: THE EDGE
· Funding Rate: NEUTRAL (0.0050%) 😊 This is perfect! No extreme long leverage yet, meaning there's room for growth without a immediate squeeze.
· Open Interest (OI): OI is INCREASING (from ~14.6M to 16.9M) while price consolidates. This is BULLISH DIVERGENCE 🐂! New money is flowing into LONG positions.
· Long/Short Ratio: The ratio is LOW (0.88-0.90). This means the majority of traders are SHORT, expecting a drop. This creates a MASSIVE SHORT SQUEEZE POTENTIAL! When price rises, shorts are forced to buy back, fueling the rally.
---
🚨 YOUR HIGH-LEVERAGE SCALP SIGNAL (75x SETUP) 🚨
Direction: LONG ♻️ (Perfect for squeezing shorts) Entry Zone:$1.1720 - $1.1780 (On a slight pullback to support) Take Profit (TP):
· TP1: $1.1950 (Quick scalp)
· TP2: $1.2100 (Next major resistance)
Stop Loss (SL): HARD STOP at $1.1650 ❌ (Below the key support and EMA cluster)
Risk/Reward: This offers an excellent ~1:3 R/R ratio.
---
5. TRADING PSYCHOLOGY: DON'T MISS THE BREAKOUT! 😤
· Fear of Chasing: Yes, it's already green. But the pattern and metrics suggest this is not the top. The breakout is confirmed.
· The Herd is Short: The low L/S ratio shows crowd psychology is bearish. Be contrarian. The pain trade is to the UPSIDE.
· FOMO (Fear Of Missing Out): Will kick in after the breakout above $1.1800. Enter before the crowd.
Conclusion: All signals—technical, on-chain (OI), and sentiment (L/S Ratio)—are aligned for a continued push upwards. This is a high-probability scalp with massive short squeeze potential.
Trade smart, and let the shorts fuel your profits! ✅
#AEROUSDT #Crypto #TradingSignal #Scalping #TechnicalAnalysis #BinanceSquare #75x #ShortSqueeze #BullFlag #Breakout #Write2Earn

