

#tradingsignal
tradingsignal
12.6M views
50,874 Discussing
Hot
Latest

·
--
:
🚨 $ADA Whales Quietly Accumulating: $816M In Open Interest! Breakout or Liquidation Trap? 🚨
The derivatives and spot markets for $ADA are flashing a massive warning signal that every futures trader needs to look at immediately. If you are looking for explosive volatility, this is your next setup.
📊 The Reality Check Data:
• Open Interest Explosion: Over 1.99 Billion $ADA has been locked into active futures contracts over the last 24 hours. That is a jaw-dropping injection of fresh leverage capital.
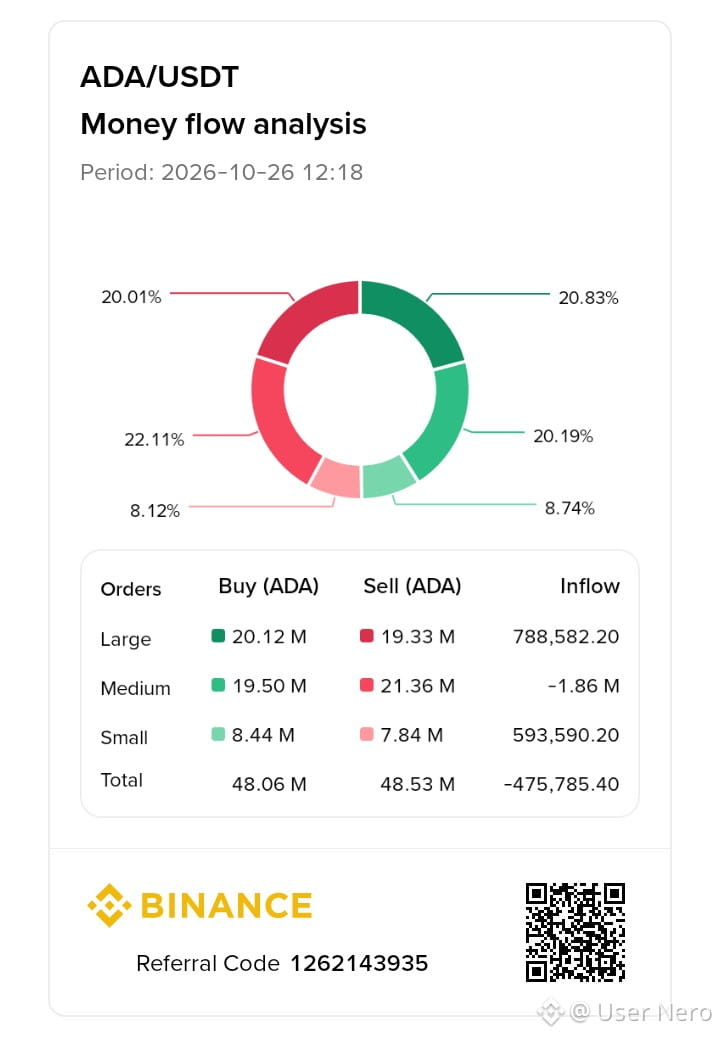
• Whale Accumulation vs. Retail Panic (See Chart): Look closely at the Money Flow analysis. While retail and medium-sized accounts are panic selling (-1.86M ADA outflow), institutional whales are doing the exact opposite. Large buy orders dominate with a +788.5K ADA positive inflow! Whales are absorbing the sell pressure.
• The Technical Trap: Open interest is hitting local highs while the spot price is tightly compressed against an aggressive local resistance wall.
💡 The Game Plan:
When this much leverage builds up during a price consolidation and whales are actively buying the large orders, a massive directional move is brewing. If ADA breaks resistance, we are looking at an aggressive, high-velocity short squeeze. If the bulls fail to hold support, expect a sharp chain reaction of long liquidations.
💬 Traders, let's settle this in the comments:
Are you tracking the whales and loading LONGS for a massive breakout, or are you scaling into SHORTS expecting retail to drag the price down? Drop your leverage and your targets below! 👇 Let's see who gets this right.
#writetoearn #Cardano #ADA #FuturesTrading #TradingSignal
1
1.2k

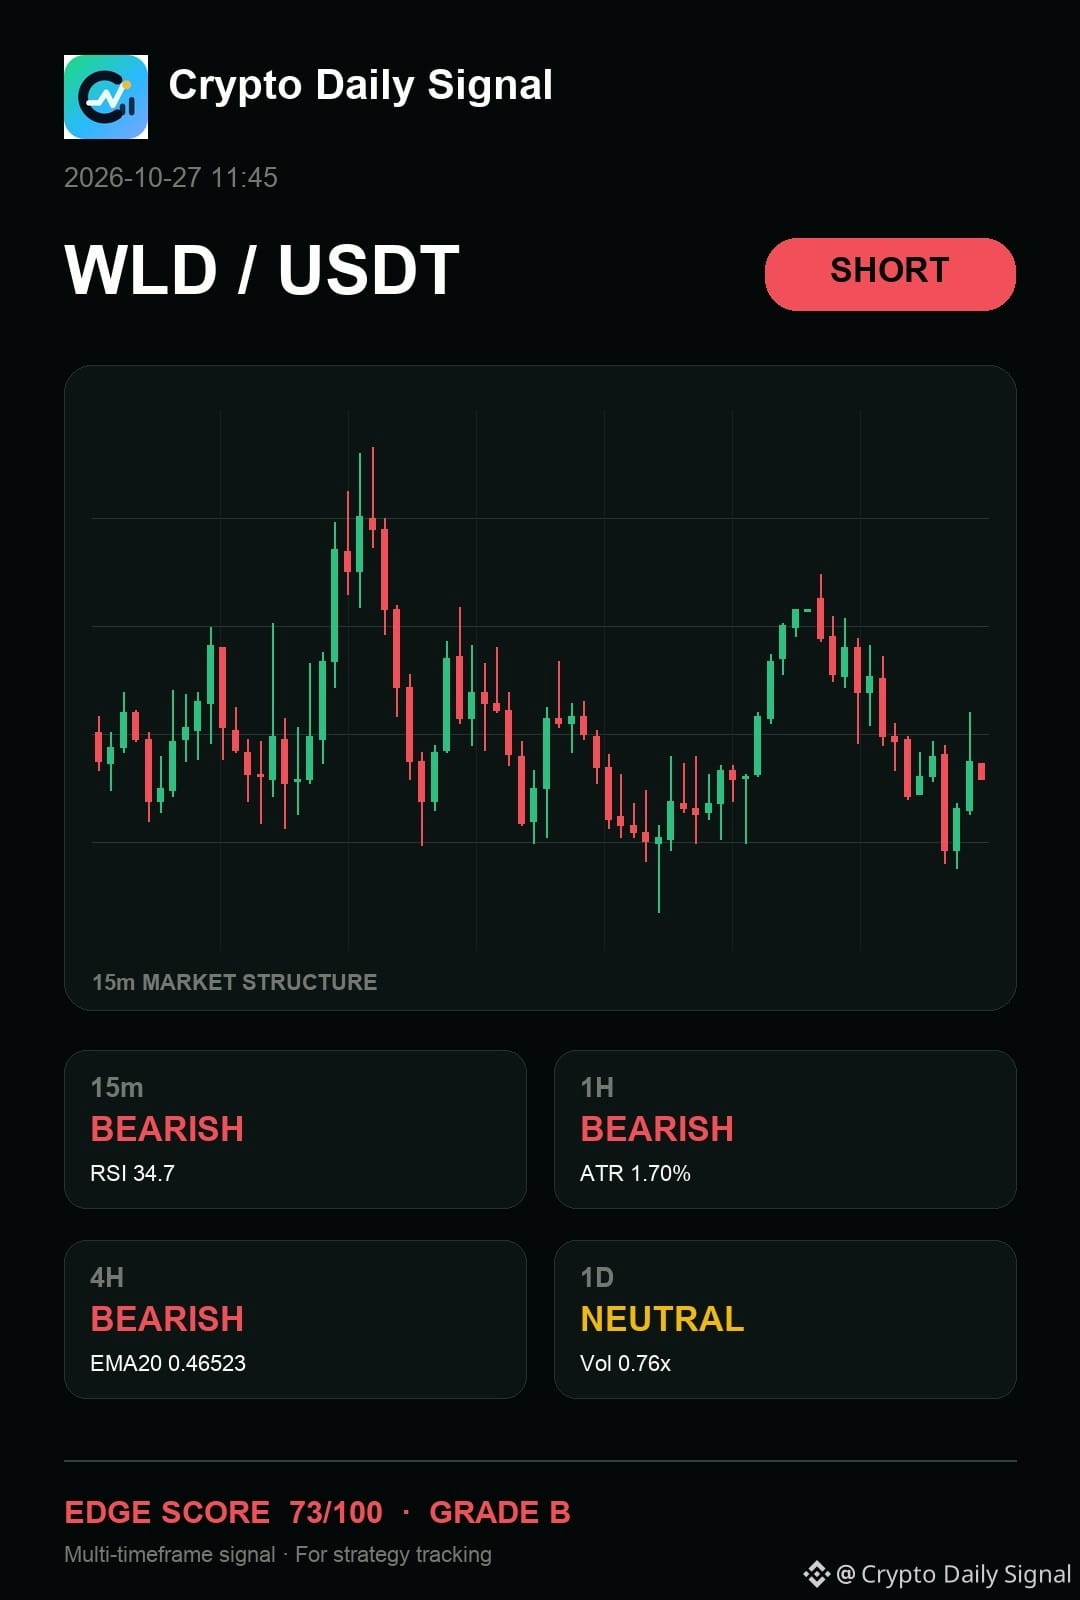
$WLD — honestly, the chart still says it is a patience trade on the short side as the momentum appears to be fading while contained within a falling channel structure. Lower highs on the short-term charts confirm this shift downwards, aligning with the bearish sentiment seen on the four-hour timeframe. A clean break beneath that range floor would give the sell thesis better footing.
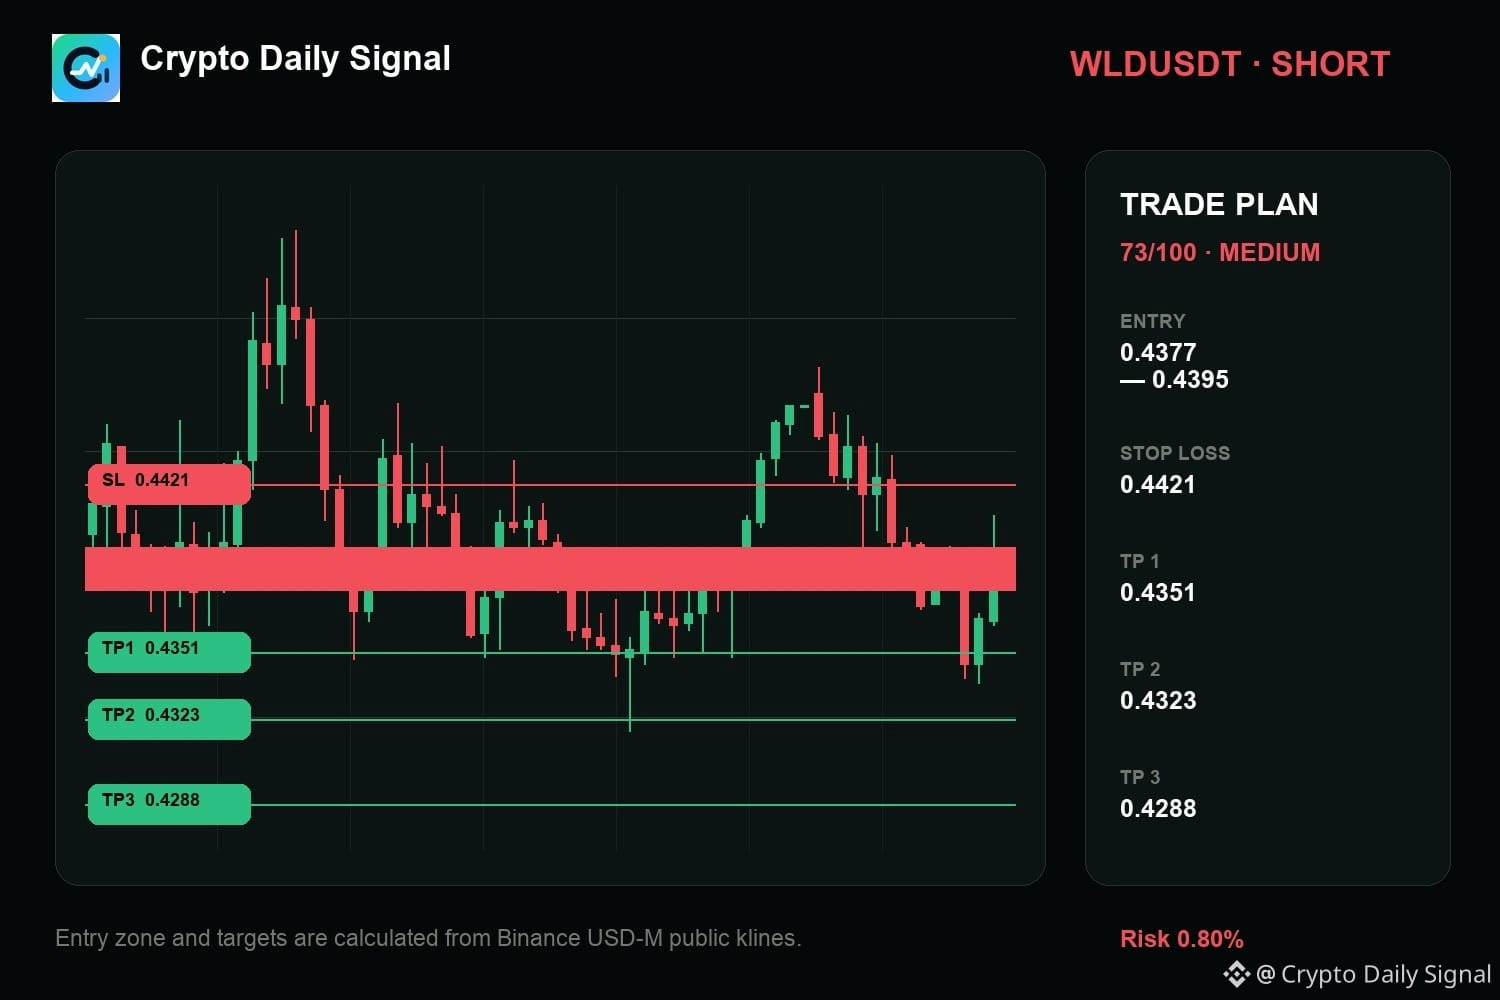
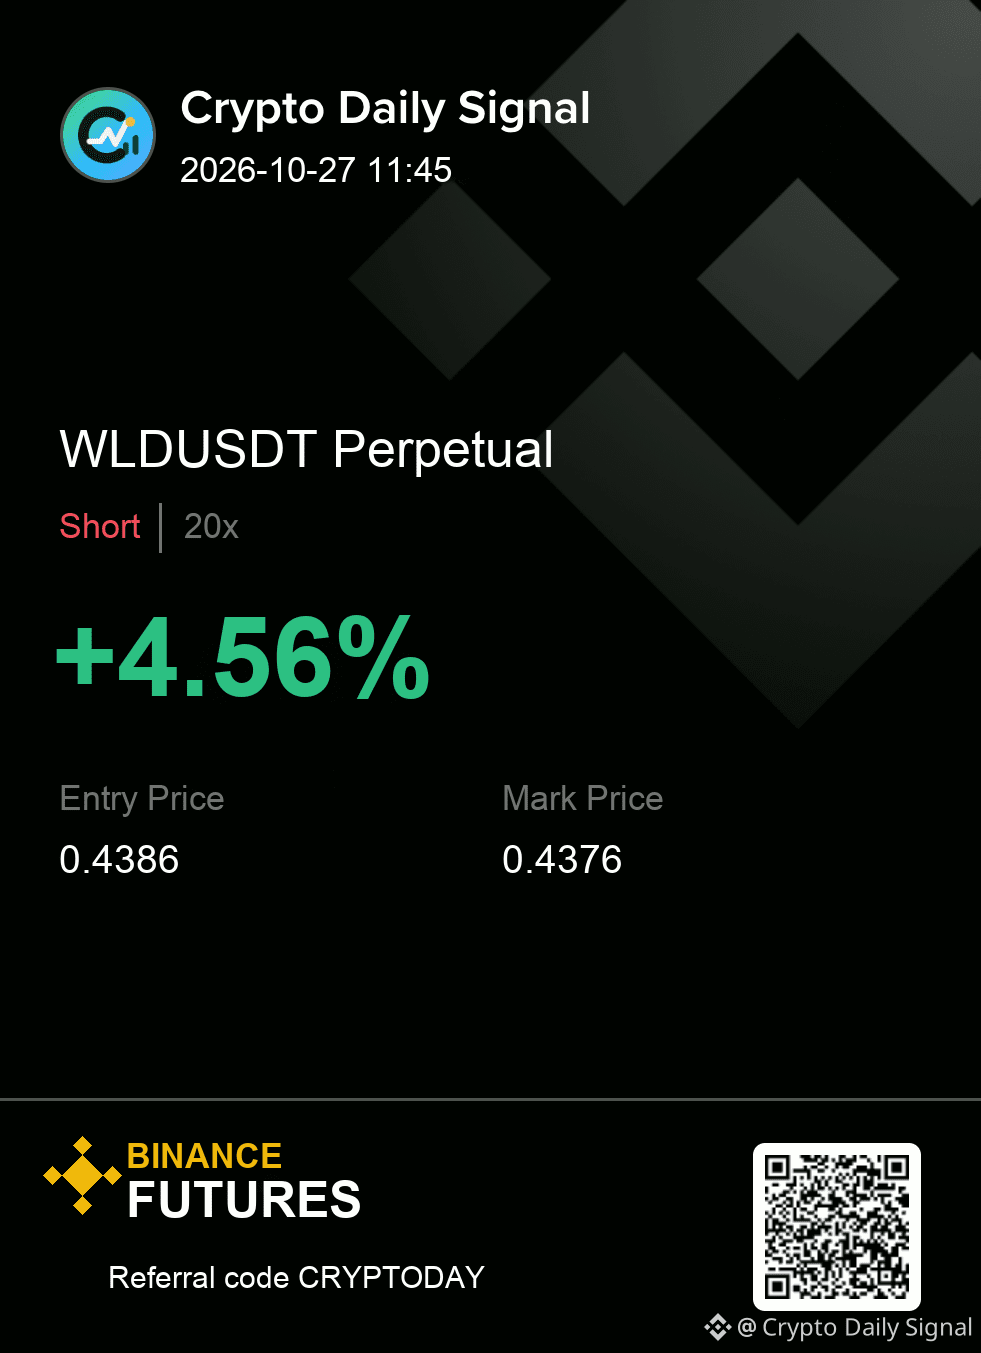
WLDUSDT | SHORT
Entry 0.4377 - 0.4395
Invalidation 0.4421
Targets 0.4351 / 0.4323 / 0.4288
#TradingSignal
{future}(WLDUSDT)
$WLD — honestly, the chart still says it is a patience trade on the short side as the momentum appears to be fading while contained within a falling channel structure. Lower highs on the short-term charts confirm this shift downwards, aligning with the bearish sentiment seen on the four-hour timeframe. A clean break beneath that range floor would give the sell thesis better footing.
WLDUSDT | SHORT
Entry 0.4377 - 0.4395
Invalidation 0.4421
Targets 0.4351 / 0.4323 / 0.4288
#TradingSignal
WLDUSDT | SHORT
Entry 0.4377 - 0.4395
Invalidation 0.4421
Targets 0.4351 / 0.4323 / 0.4288
#TradingSignal
36

·
--
Bullish
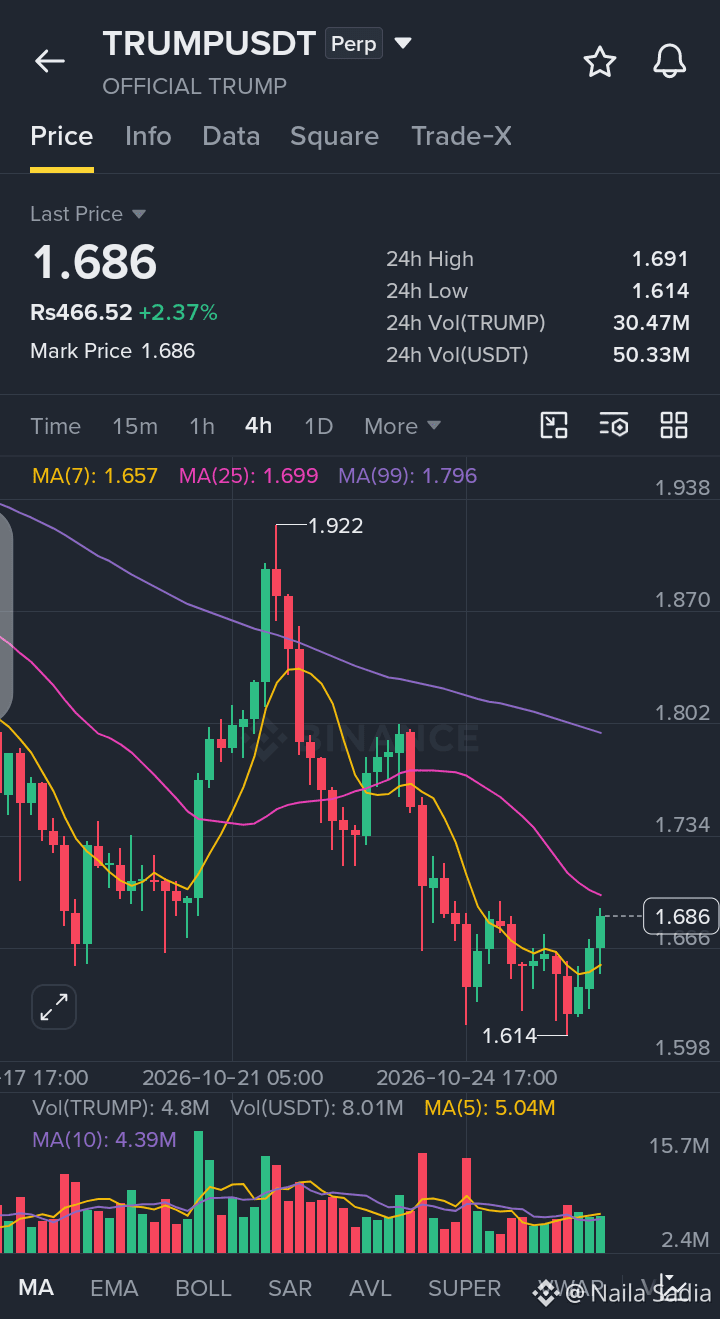
🟢 TRUMP — BULLISH BOUNCE & RECLAMATION OF SHORT-TERM MOVING AVERAGES! 📈
$TRUMP is trading higher at 1.686 (+2.37%, or roughly Rs466.52), moving within an active 24-hour range between a high of 1.691 and a low of 1.614. Price action on this 4-hour chart displays a notable relief recovery following the successful defense of the local swing low at 1.614, pushing right back to cross above the fast MA(7) (1.657) and testing the MA(25) (1.699) line while moving below the broader macro structural MA(99) (1.796) band.
📊 QUICK TRADE PLAN — 4H
🟢 LONG ENTRY: 1.620–1.680 (on minor intraday pullbacks or successful retests near the fast MA support)
🛑 STOP LOSS: 1.570
🎯 TP1: 1.820
🎯 TP2: 1.950
Are you watching for Official Trump to build on this momentum, break past the MA(25) resistance cluster, and target the $1.82 level next? Let's discuss below! 👇
👉 Trade: $TRUMP
{future}(TRUMPUSDT)
#TRUMP #cryptotrading #BinanceSquare #Bullish #TradingSignal
🟢 TRUMP — BULLISH BOUNCE & RECLAMATION OF SHORT-TERM MOVING AVERAGES! 📈
$TRUMP is trading higher at 1.686 (+2.37%, or roughly Rs466.52), moving within an active 24-hour range between a high of 1.691 and a low of 1.614. Price action on this 4-hour chart displays a notable relief recovery following the successful defense of the local swing low at 1.614, pushing right back to cross above the fast MA(7) (1.657) and testing the MA(25) (1.699) line while moving below the broader macro structural MA(99) (1.796) band.
📊 QUICK TRADE PLAN — 4H
🟢 LONG ENTRY: 1.620–1.680 (on minor intraday pullbacks or successful retests near the fast MA support)
🛑 STOP LOSS: 1.570
🎯 TP1: 1.820
🎯 TP2: 1.950
Are you watching for Official Trump to build on this momentum, break past the MA(25) resistance cluster, and target the $1.82 level next? Let's discuss below! 👇
👉 Trade: $TRUMP
#TRUMP #cryptotrading #BinanceSquare #Bullish #TradingSignal
358

·
--
🔥 BULLA SHORT SETUP ACTIVATED
Combined score: 76.93. Bias: SHORT.
✅ Entry: 0.10037
⚠️ SL: 0.109407
🎯 TP1: 0.086815
🎯 TP2: 0.077778
24h price +25.80% | Volume spikes confirmed.
⚠️ This is a trading setup, not a guaranteed result.
Question: Are you watching BULLAUSDT for a breakdown? #BULLAUSDT #CryptoSetup
$BULLA #TradingSignal #CryptoAnalysis

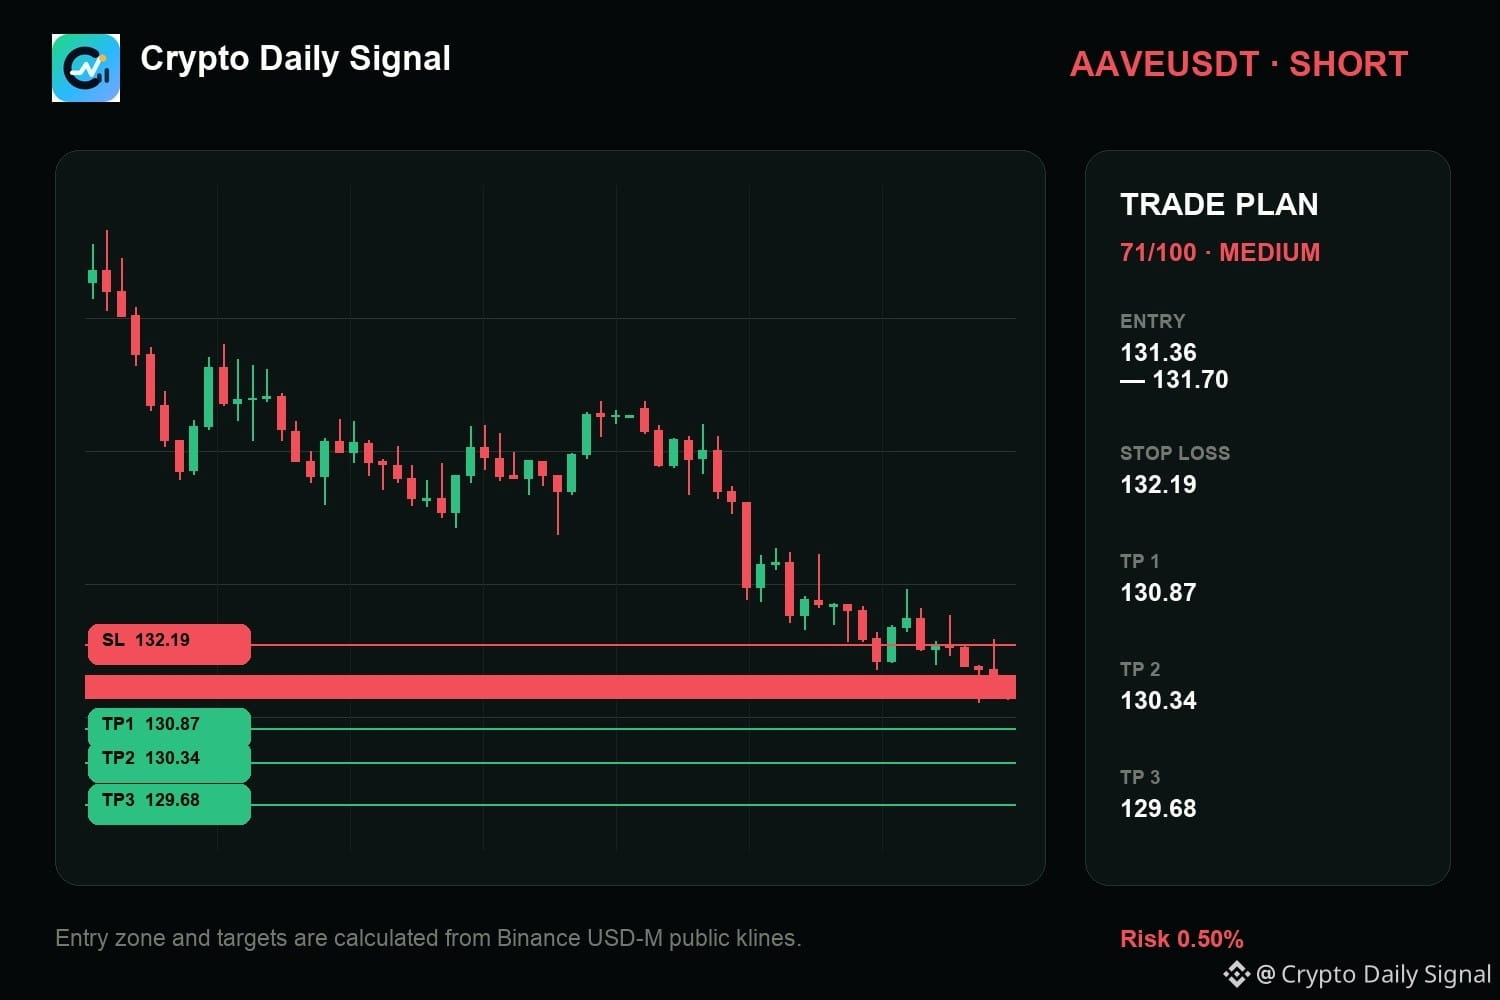
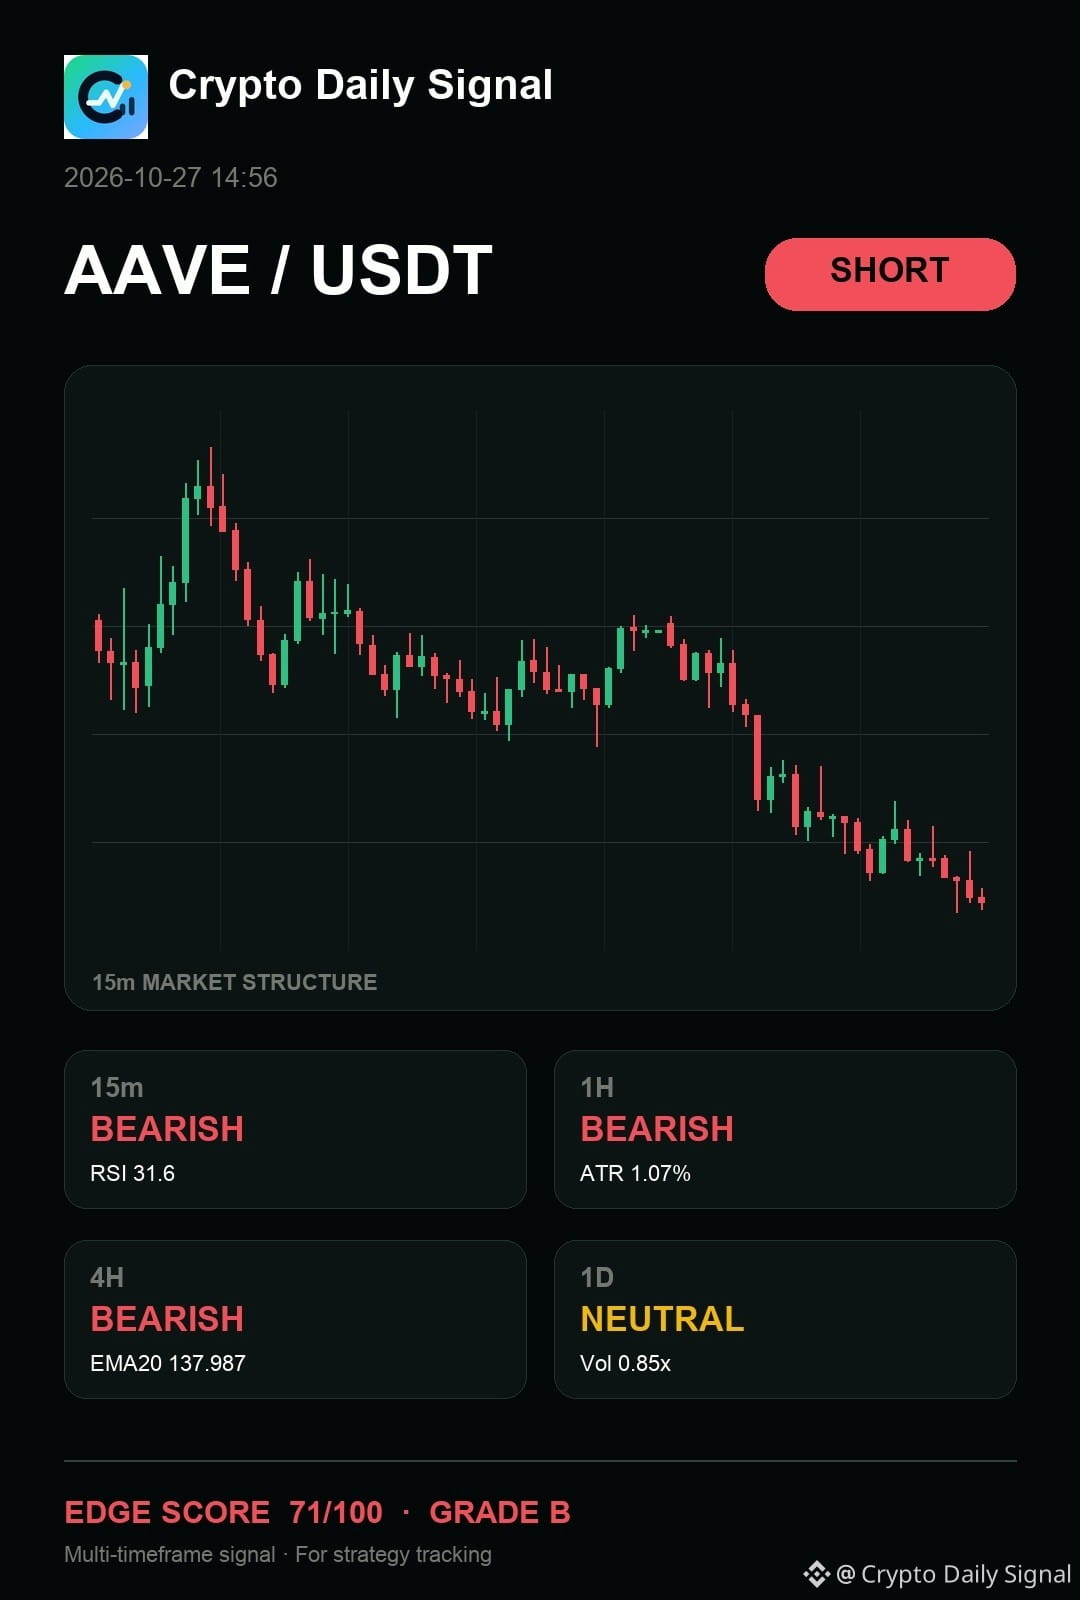
$AAVE — man, the part I care about is how it still gives sellers the cleaner argument. The price action shows clear lower highs and lower lows across the visible timeframes, with large red bodies taking charge recently. It is respecting a descending trendline from prior peaks. If it can decisively close below the immediate support zone, the short picture gets stronger.
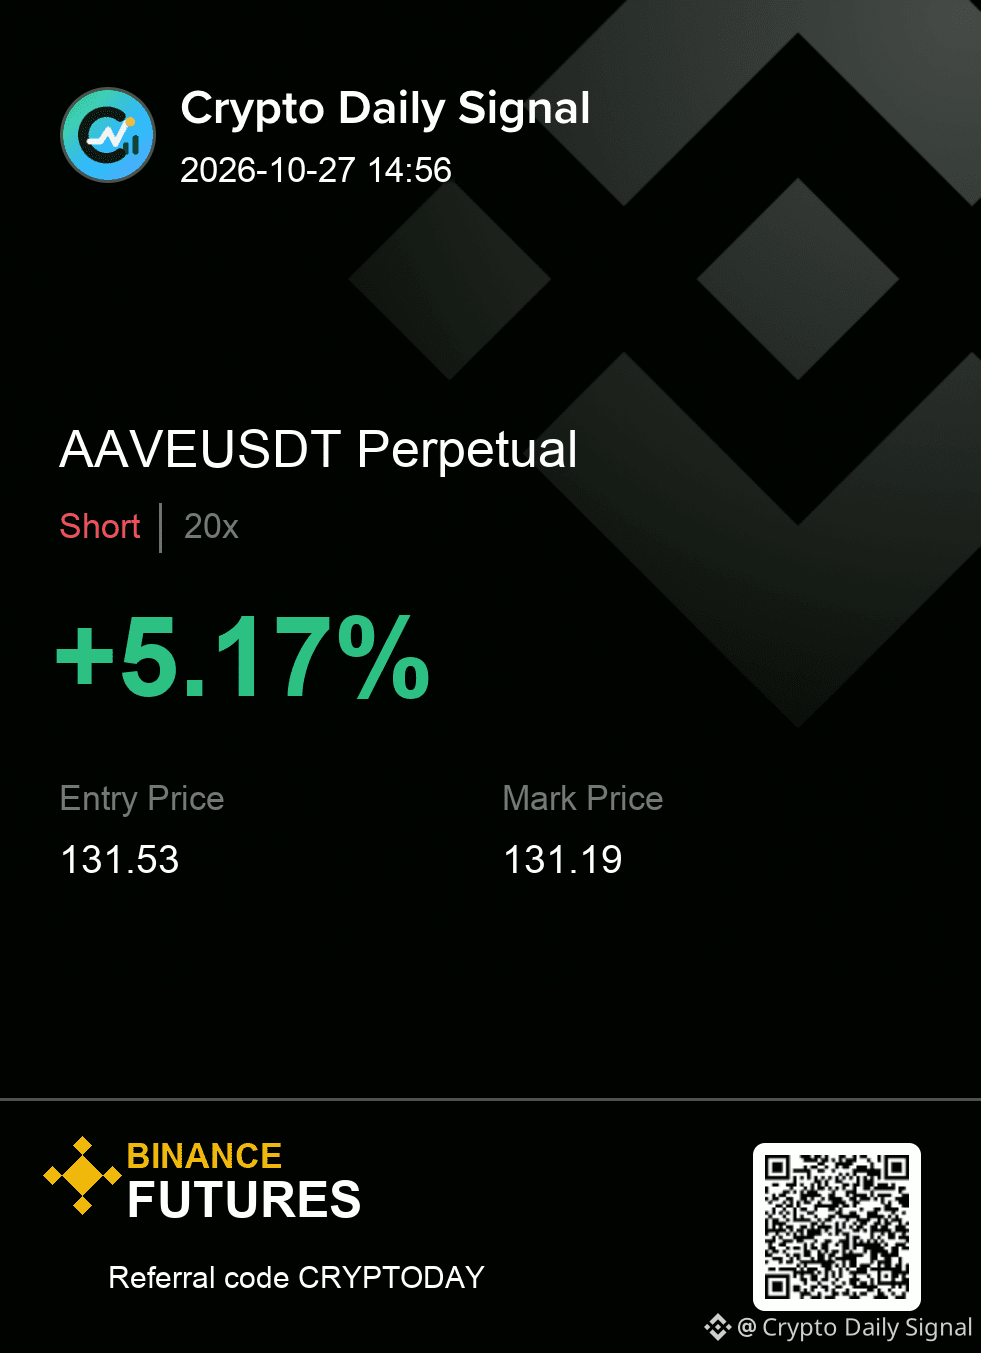
SHORT plan for AAVEUSDT
131.36 - 131.70 entry | 132.19 stop
130.87 → 130.34 → 129.68
#TradingSignal
{future}(AAVEUSDT)
$AAVE — man, the part I care about is how it still gives sellers the cleaner argument. The price action shows clear lower highs and lower lows across the visible timeframes, with large red bodies taking charge recently. It is respecting a descending trendline from prior peaks. If it can decisively close below the immediate support zone, the short picture gets stronger.
SHORT plan for AAVEUSDT
131.36 - 131.70 entry | 132.19 stop
130.87 → 130.34 → 129.68
#TradingSignal
SHORT plan for AAVEUSDT
131.36 - 131.70 entry | 132.19 stop
130.87 → 130.34 → 129.68
#TradingSignal
9
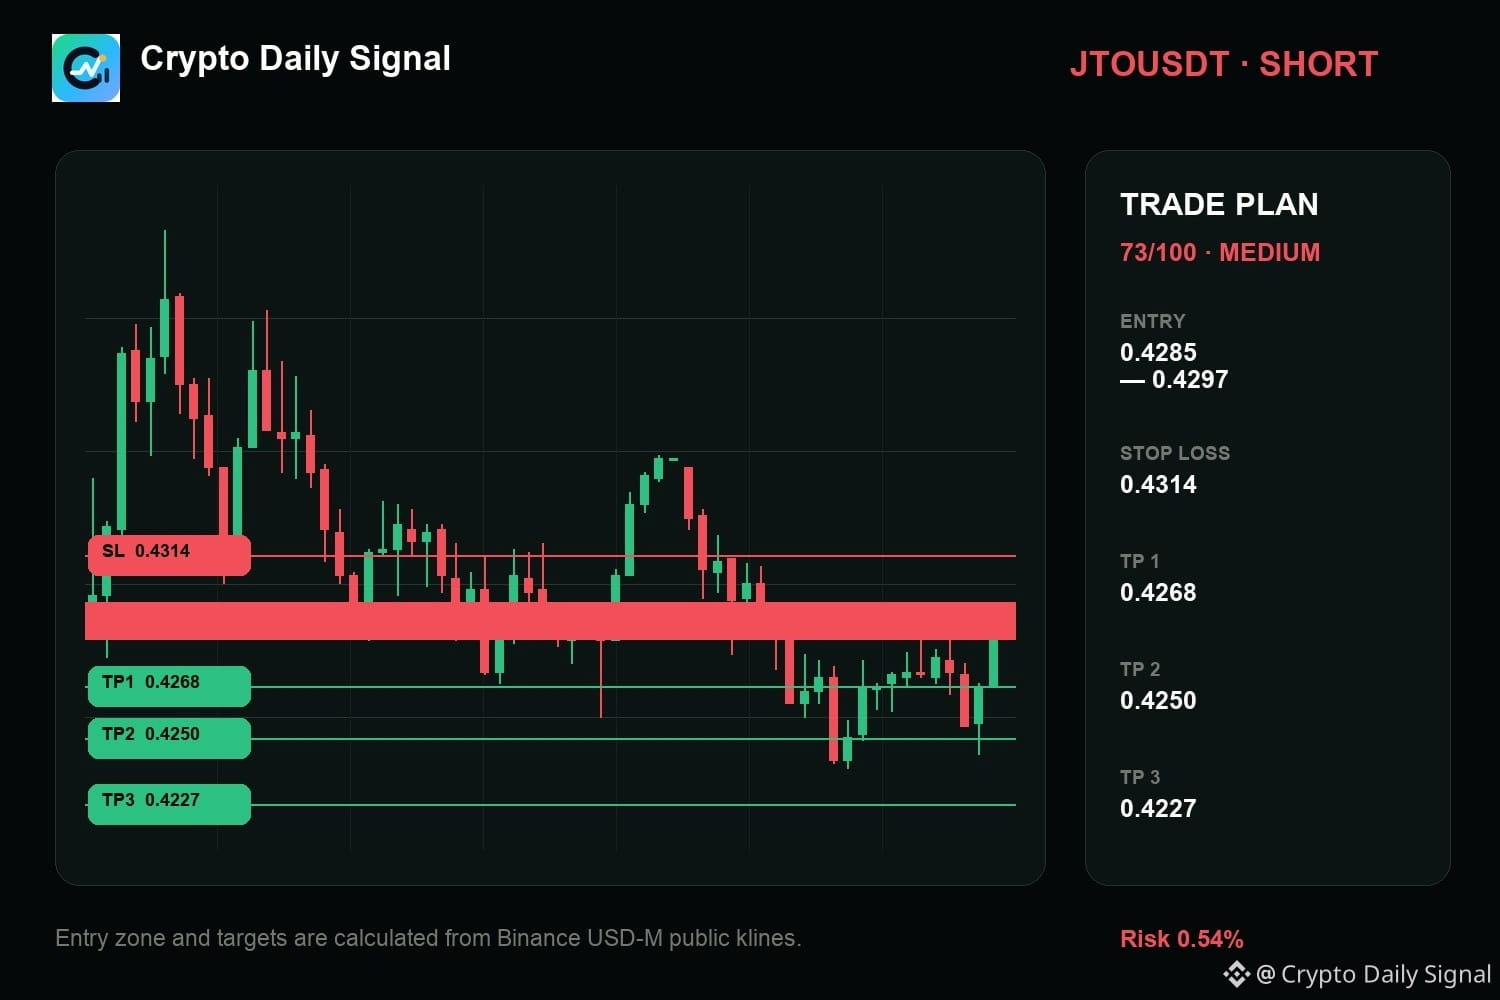
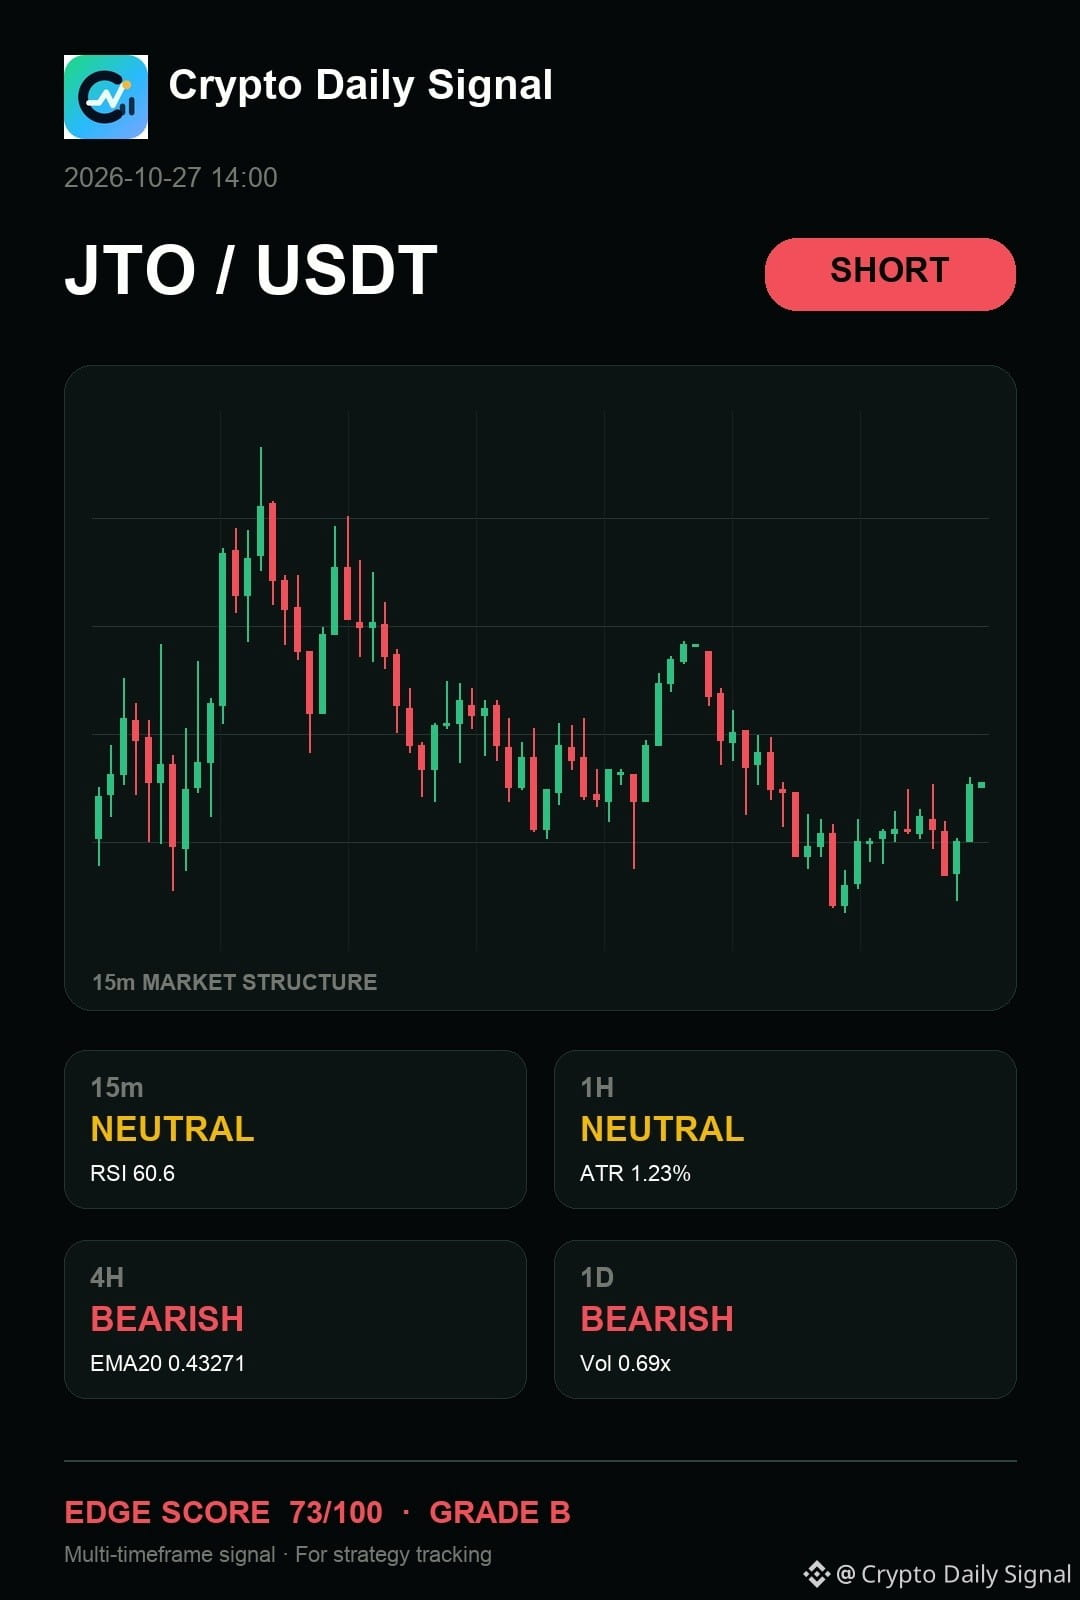
$JTO keeps the bearish thesis active as the price remains trapped within a descending channel structure on the daily chart. We are seeing repeated negative candles, which shows that bears are still in control of the overall trend. The idea remains stronger if the price decisively closes beneath the established range floor.
Levels — JTOUSDT
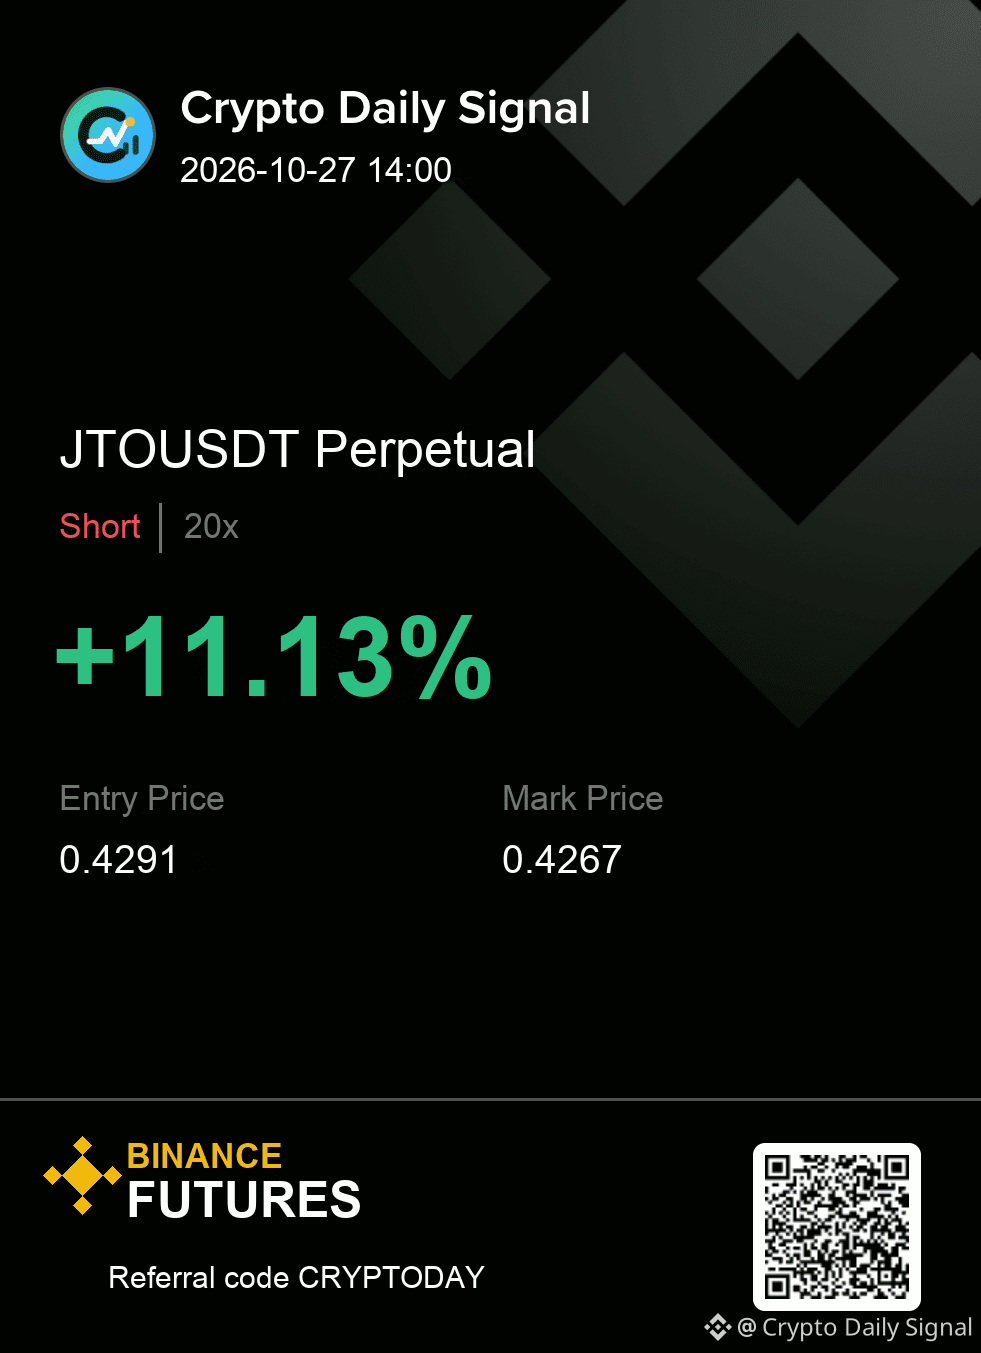
Zone: 0.4285 - 0.4297
Cut: 0.4314
Scale: 0.4268 | 0.4250 | 0.4227
#TradingSignal
{future}(JTOUSDT)
$JTO keeps the bearish thesis active as the price remains trapped within a descending channel structure on the daily chart. We are seeing repeated negative candles, which shows that bears are still in control of the overall trend. The idea remains stronger if the price decisively closes beneath the established range floor.
Levels — JTOUSDT
Zone: 0.4285 - 0.4297
Cut: 0.4314
Scale: 0.4268 | 0.4250 | 0.4227
#TradingSignal
Levels — JTOUSDT
Zone: 0.4285 - 0.4297
Cut: 0.4314
Scale: 0.4268 | 0.4250 | 0.4227
#TradingSignal
7
·
--
🔥 BTW LONG setup triggered.
BIAS: LONG | SCORE: 46.67
Entry: 1.3607
SL: 1.3153 | TP1: 1.4288 | TP2: 1.4743
Strong volume surge + price recovery suggests bullish pressure.
⚠️ This is a setup, not a guaranteed result.
Question: Are you watching BTW for a breakout? 👀
#BTWUSDT #CryptoSetup
$BTW #TradingSignal #CryptoAnalysis
BIAS: LONG | SCORE: 46.67
Entry: 1.3607
SL: 1.3153 | TP1: 1.4288 | TP2: 1.4743
Strong volume surge + price recovery suggests bullish pressure.
⚠️ This is a setup, not a guaranteed result.
Question: Are you watching BTW for a breakout? 👀
#BTWUSDT #CryptoSetup
$BTW #TradingSignal #CryptoAnalysis

1
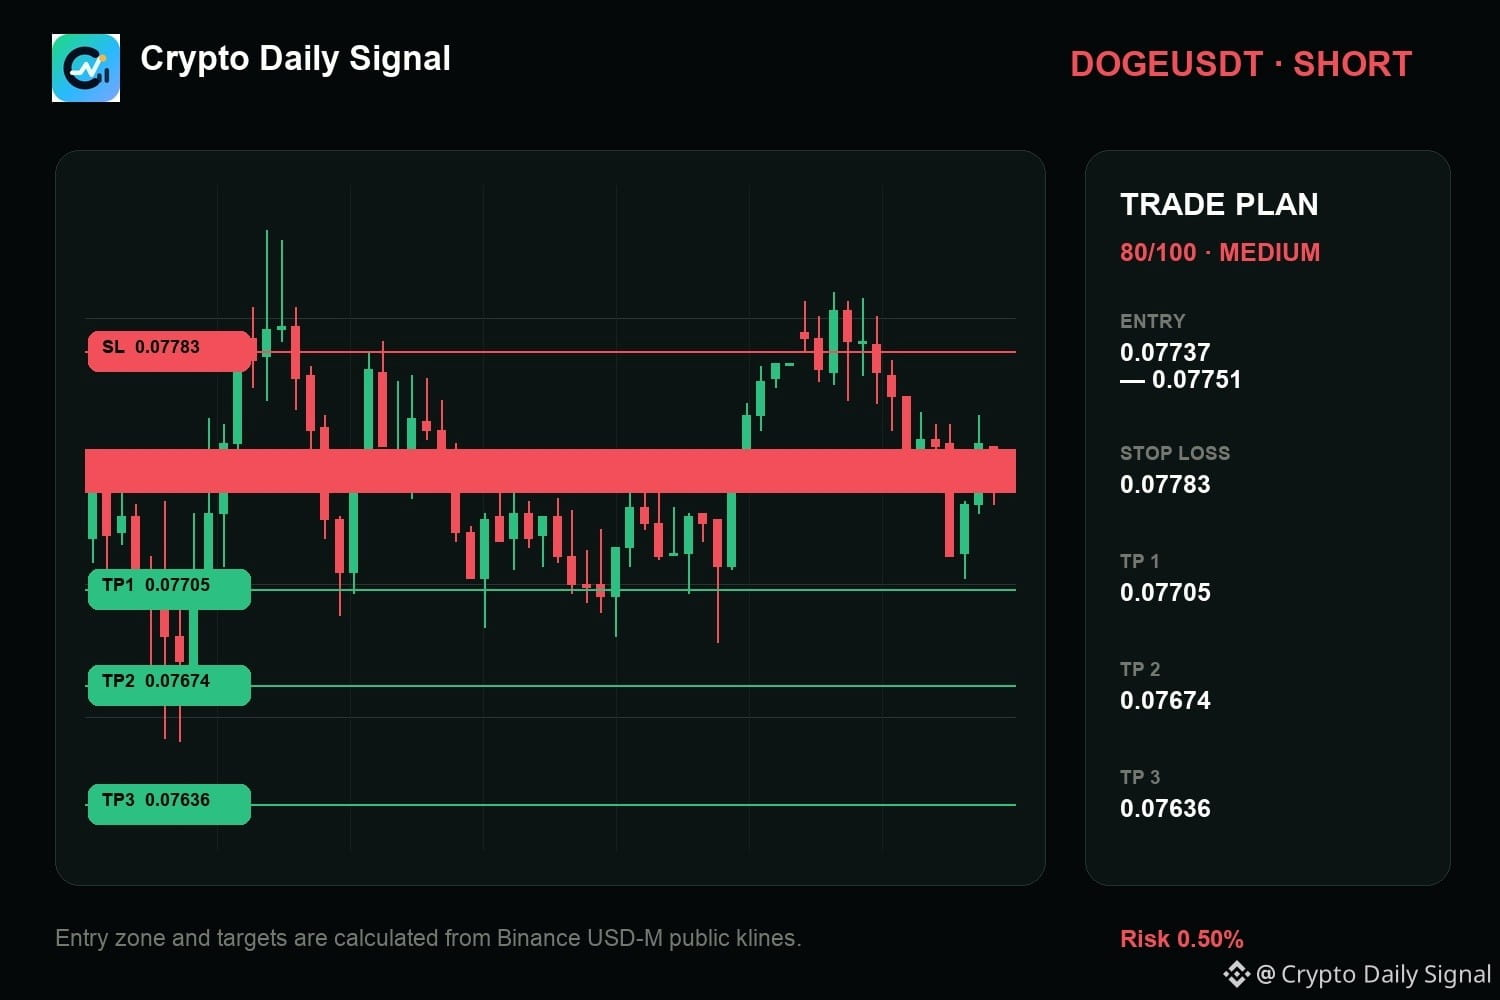
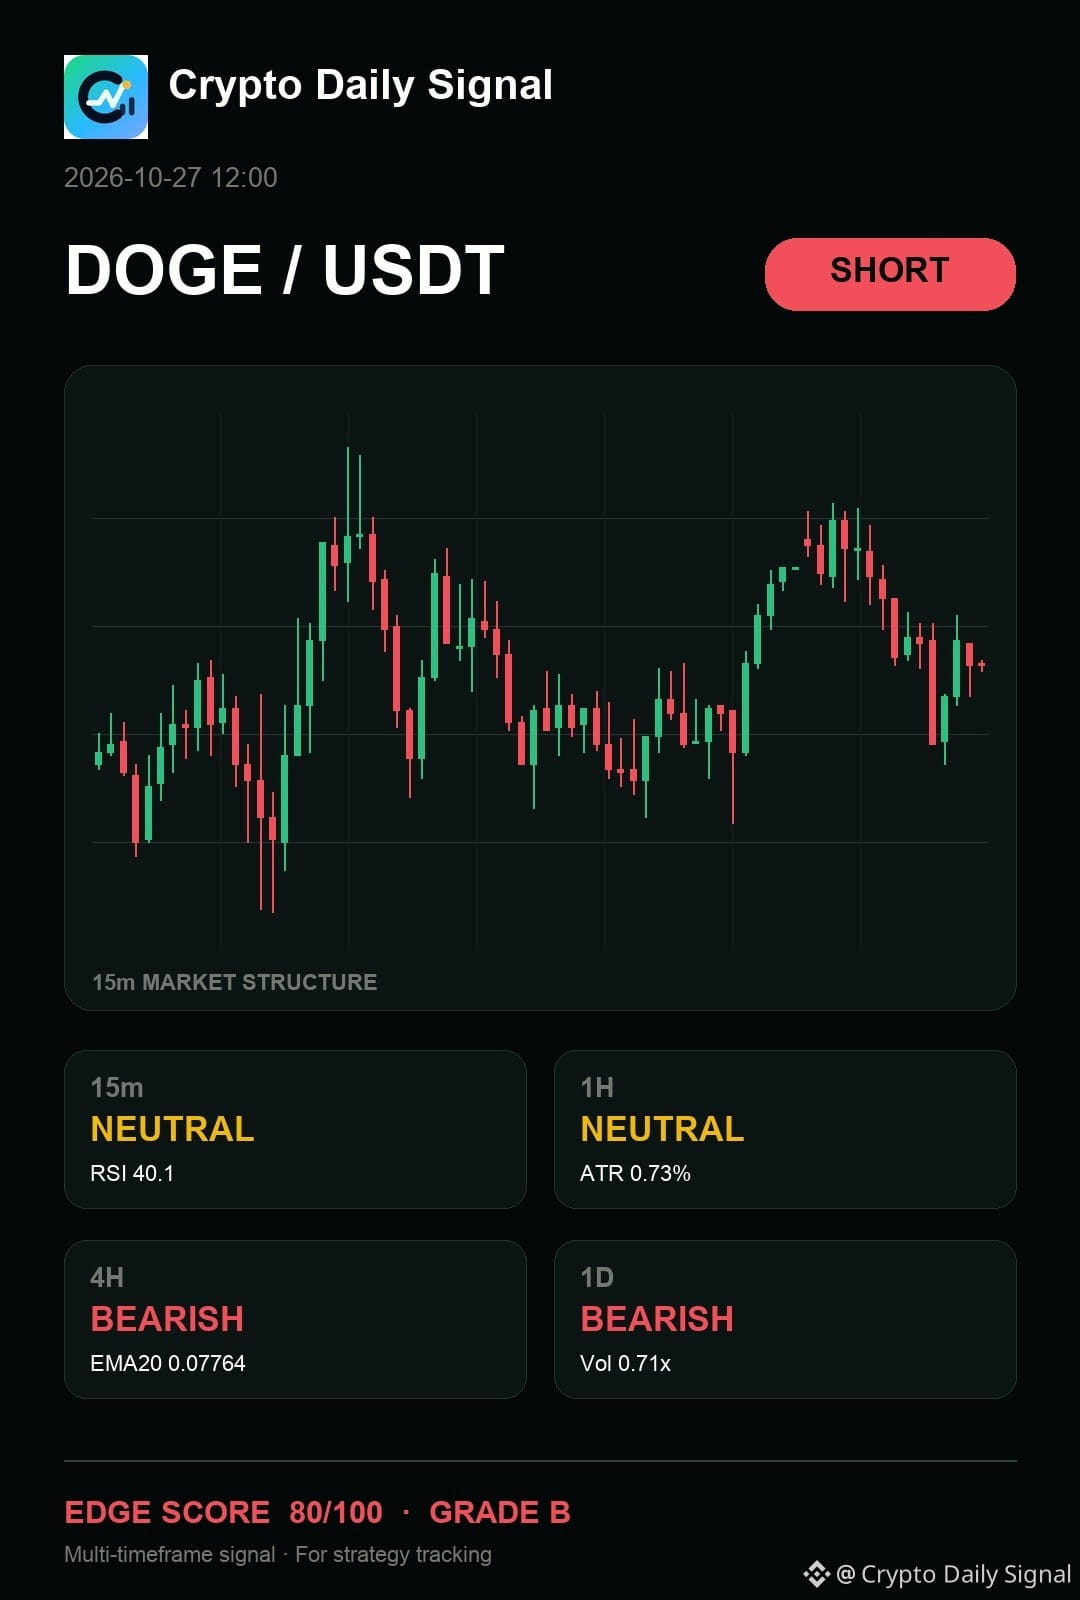
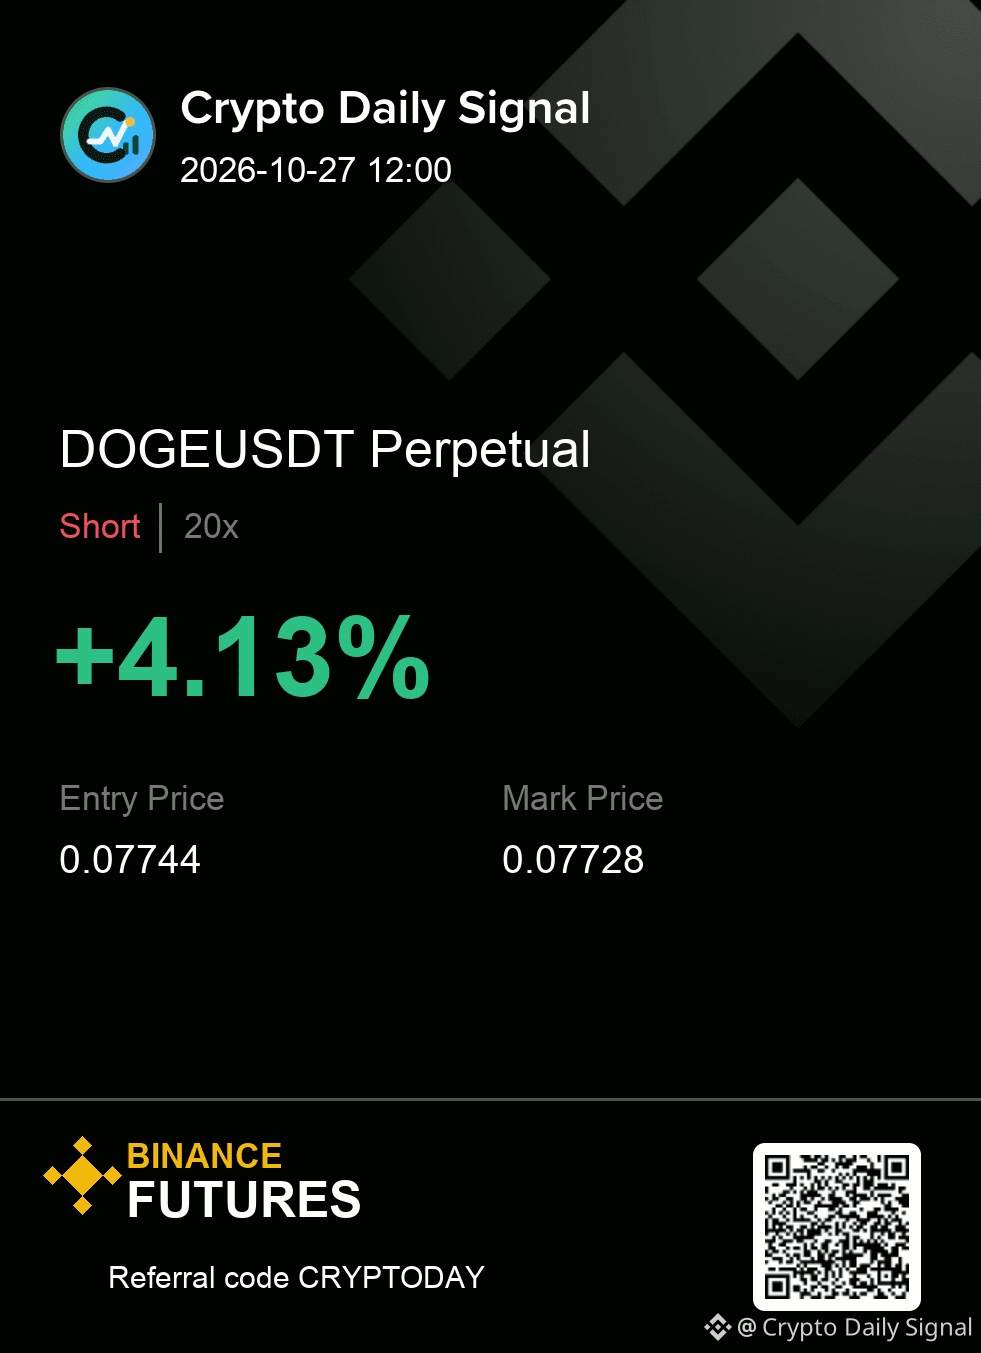
$DOGE — for me, the core read is that it is one rejection away from a cleaner short. The pattern of lower highs building up is in place, and the larger timeframes confirm bearish momentum, which is the main support for this view. However, a sharp move above the recent high would quickly cancel this bearish picture.
The levels matter more than the prediction. Size it accordingly.
DOGEUSDT SHORT
IN 0.07737 - 0.07751
OUT 0.07783
TP 0.07705 · 0.07674 · 0.07636
#TradingSignal
{future}(DOGEUSDT)
$DOGE — for me, the core read is that it is one rejection away from a cleaner short. The pattern of lower highs building up is in place, and the larger timeframes confirm bearish momentum, which is the main support for this view. However, a sharp move above the recent high would quickly cancel this bearish picture.
The levels matter more than the prediction. Size it accordingly.
DOGEUSDT SHORT
IN 0.07737 - 0.07751
OUT 0.07783
TP 0.07705 · 0.07674 · 0.07636
#TradingSignal
The levels matter more than the prediction. Size it accordingly.
DOGEUSDT SHORT
IN 0.07737 - 0.07751
OUT 0.07783
TP 0.07705 · 0.07674 · 0.07636
#TradingSignal
8
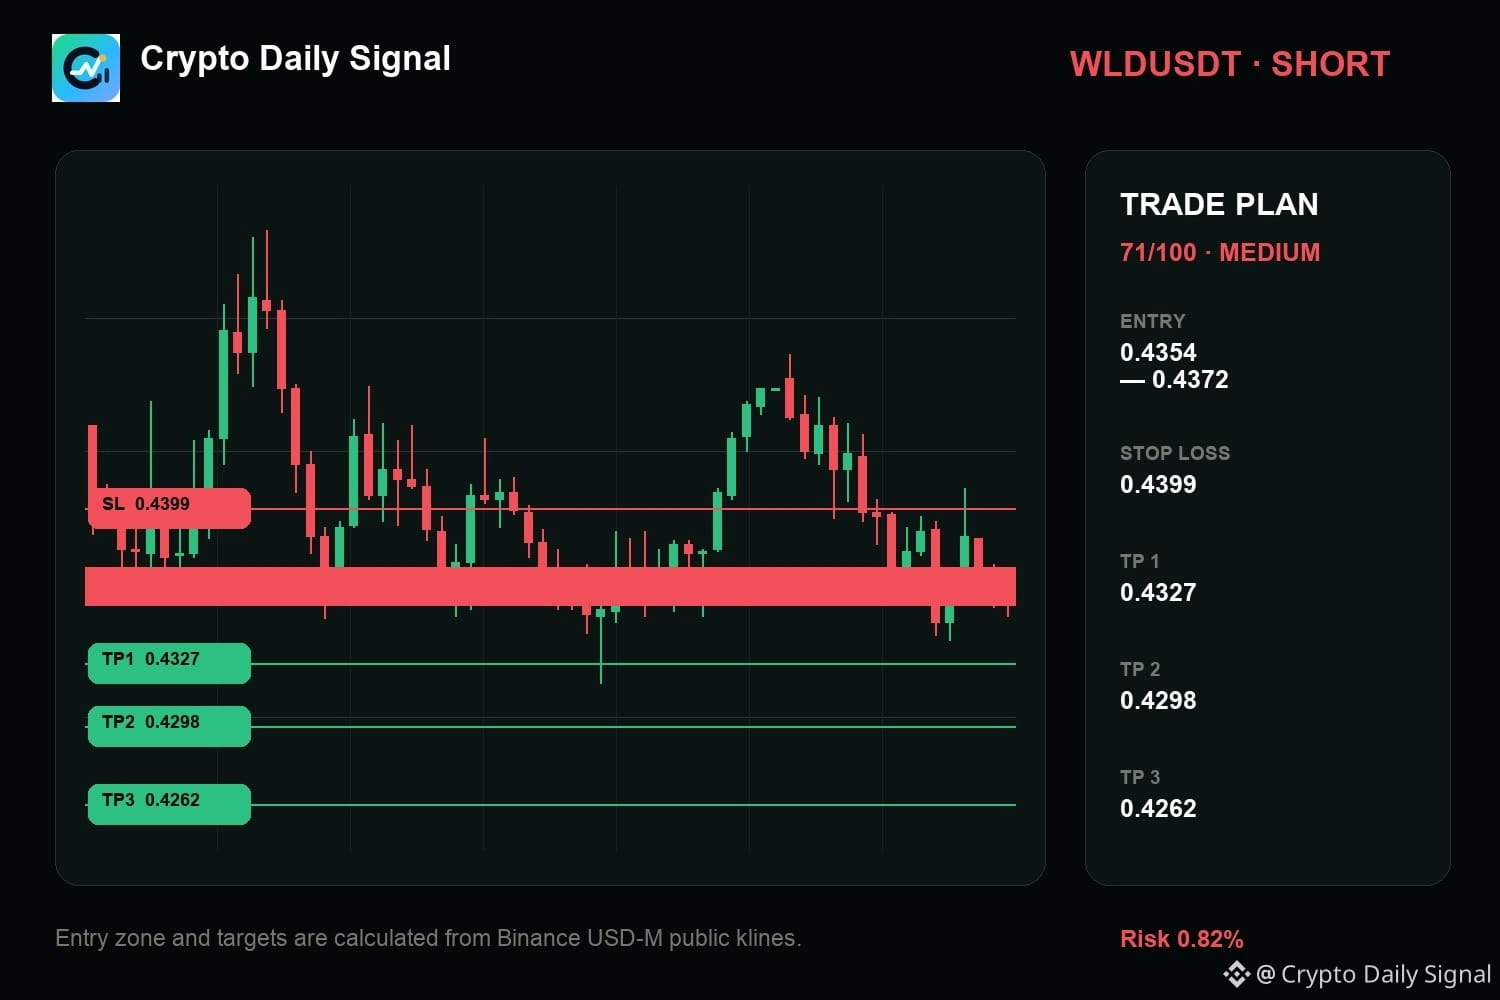
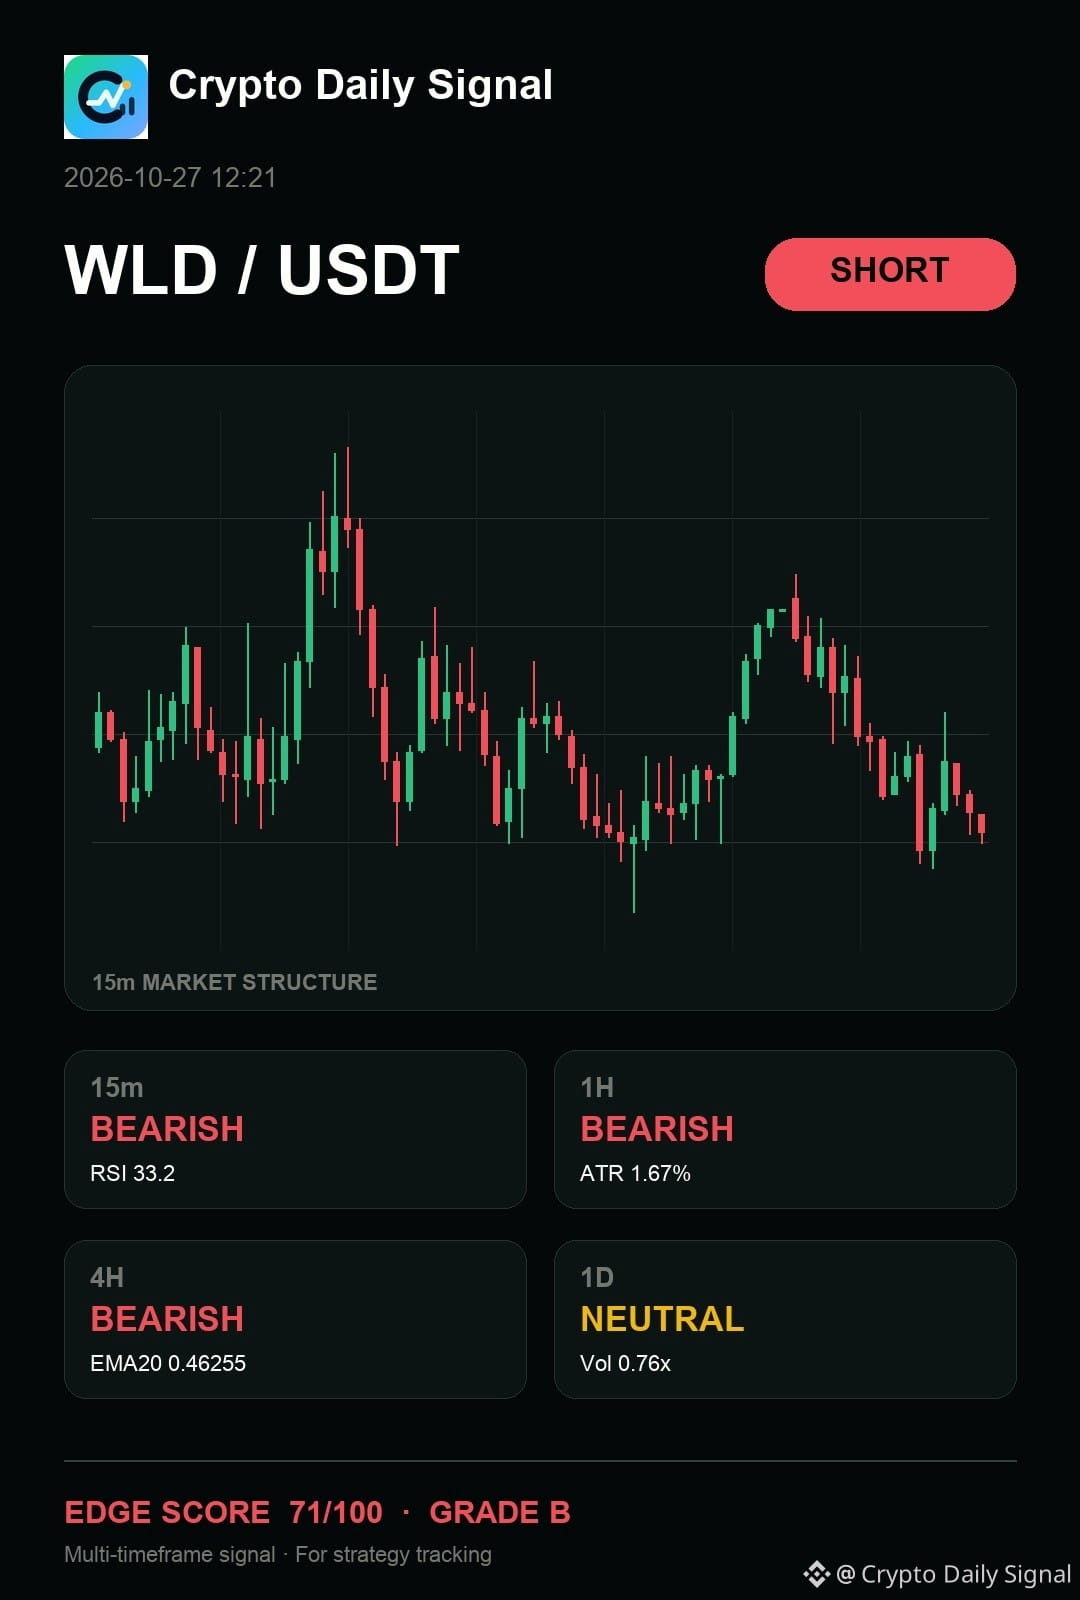
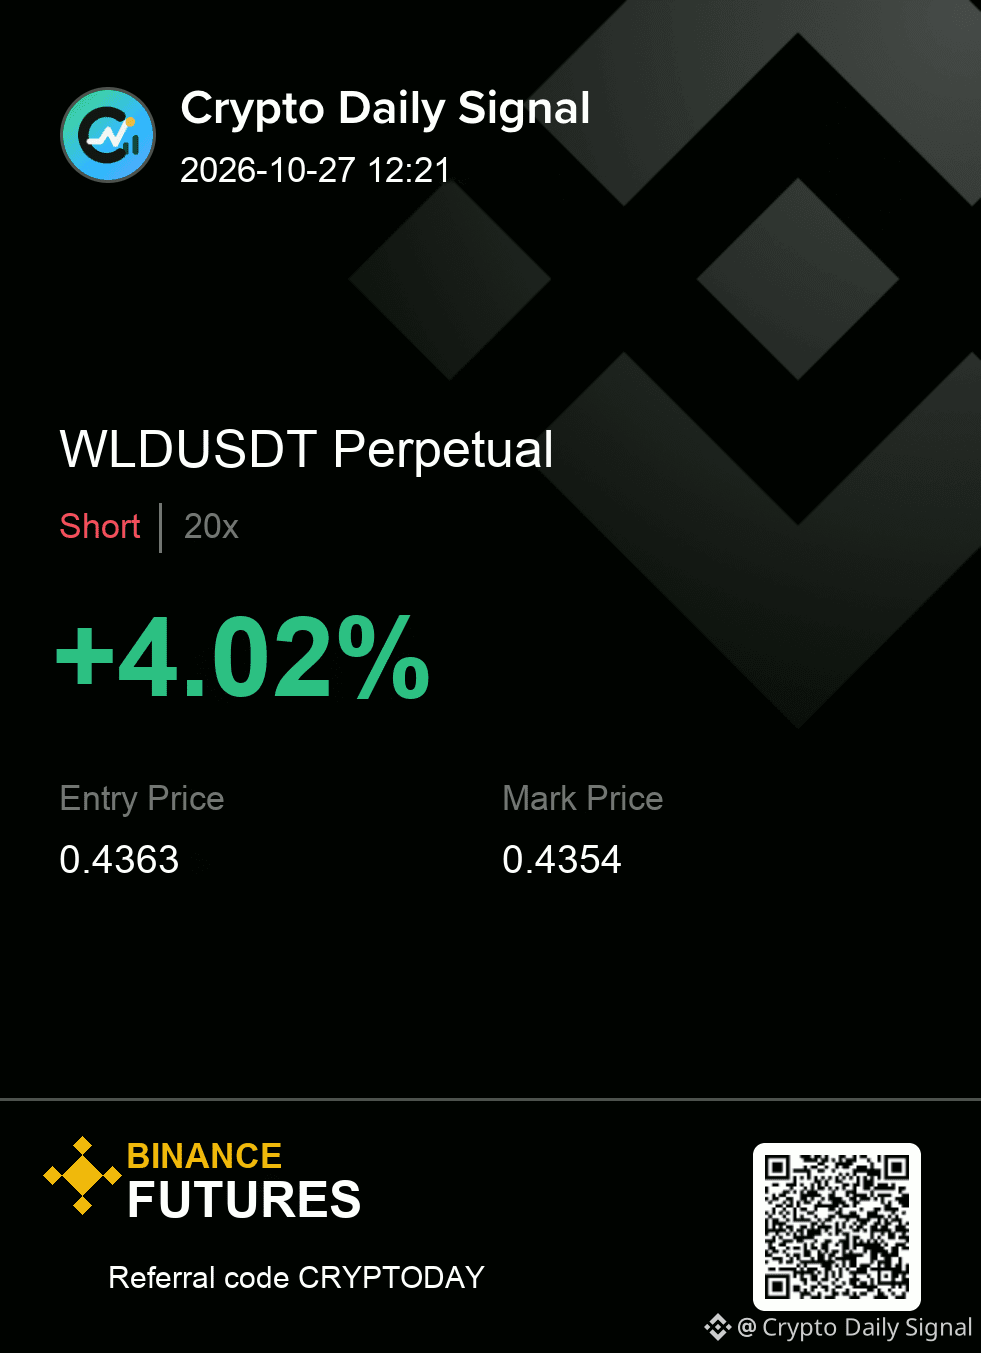
$WLD — quick take, I still think it remains a short idea for me. The daily picture is neutral and the four-hour structure is bearish. I want the entry zone to hold before committing; a clean break through the risk line kills the idea. No need to chase the first candle.
Trade Plan — WLDUSDT SHORT
Entry: 0.4354 - 0.4372
Stop Loss: 0.4399
TP1: 0.4327 | TP2: 0.4298 | TP3: 0.4262
#TradingSignal
{future}(WLDUSDT)
$WLD — quick take, I still think it remains a short idea for me. The daily picture is neutral and the four-hour structure is bearish. I want the entry zone to hold before committing; a clean break through the risk line kills the idea. No need to chase the first candle.
Trade Plan — WLDUSDT SHORT
Entry: 0.4354 - 0.4372
Stop Loss: 0.4399
TP1: 0.4327 | TP2: 0.4298 | TP3: 0.4262
#TradingSignal
Trade Plan — WLDUSDT SHORT
Entry: 0.4354 - 0.4372
Stop Loss: 0.4399
TP1: 0.4327 | TP2: 0.4298 | TP3: 0.4262
#TradingSignal
11
·
--
🔥 JCTUSDT SHORT SETUP
Combined score: 53.83. Bearish pressure confirmed.
Entry: 0.007043
SL: 0.00728317
TP1: 0.00668274
TP2: 0.00644257
24h price +25.02% | Volume spikes 5m +220.8%
A setup, not a guarantee.
📉 What’s your view on JCT? #JCTUSDT #BinanceSquare
$JCT #TradingSignal #CryptoAnalysis
🔥 JCTUSDT SHORT SETUP
Combined score: 53.83. Bearish pressure confirmed.
Entry: 0.007043
SL: 0.00728317
TP1: 0.00668274
TP2: 0.00644257
24h price +25.02% | Volume spikes 5m +220.8%
A setup, not a guarantee.
📉 What’s your view on JCT? #JCTUSDT #BinanceSquare
$JCT #TradingSignal #CryptoAnalysis
Combined score: 53.83. Bearish pressure confirmed.
Entry: 0.007043
SL: 0.00728317
TP1: 0.00668274
TP2: 0.00644257
24h price +25.02% | Volume spikes 5m +220.8%
A setup, not a guarantee.
📉 What’s your view on JCT? #JCTUSDT #BinanceSquare
$JCT #TradingSignal #CryptoAnalysis

7
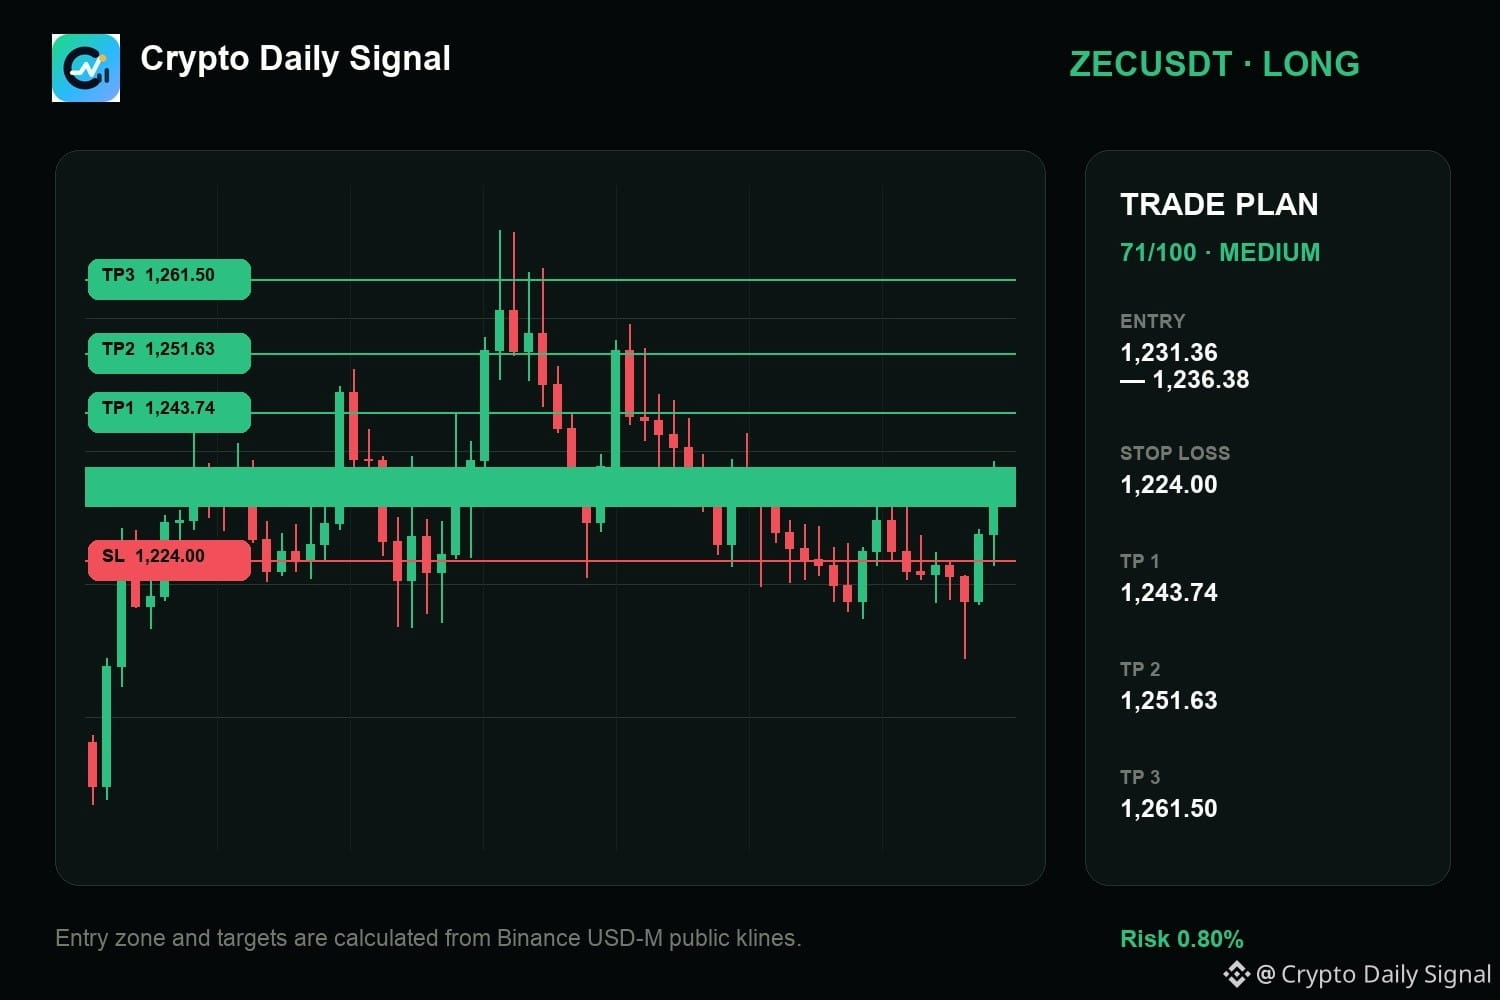
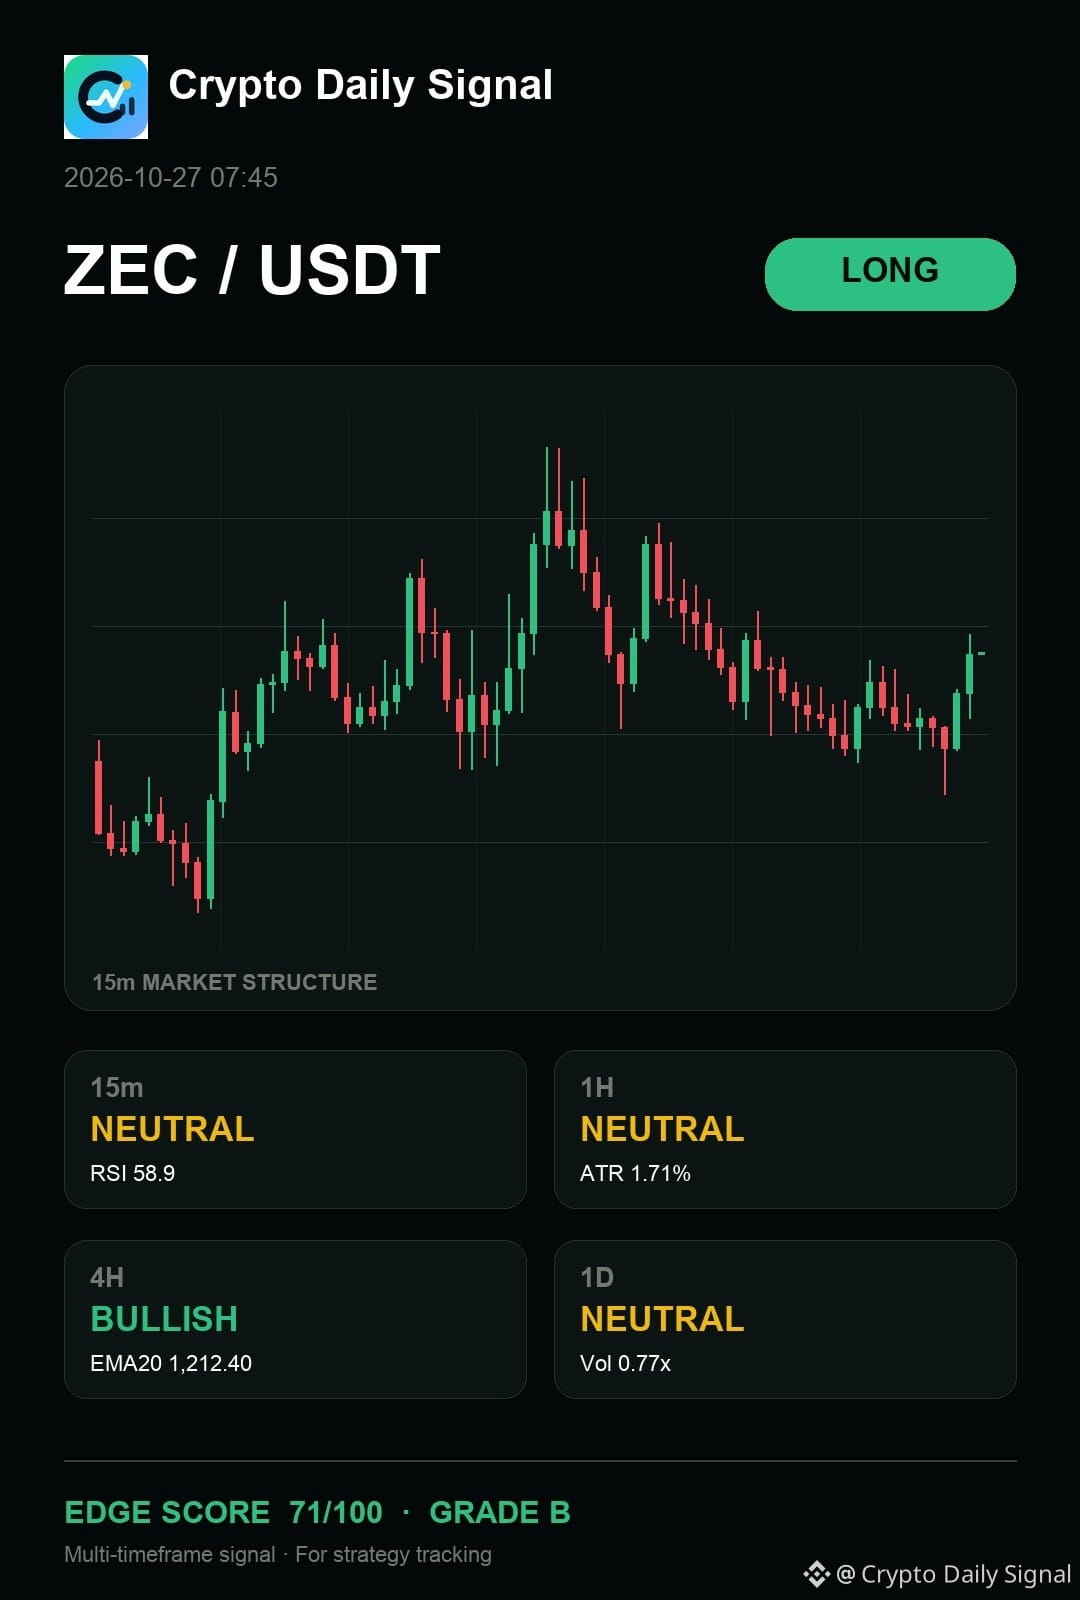
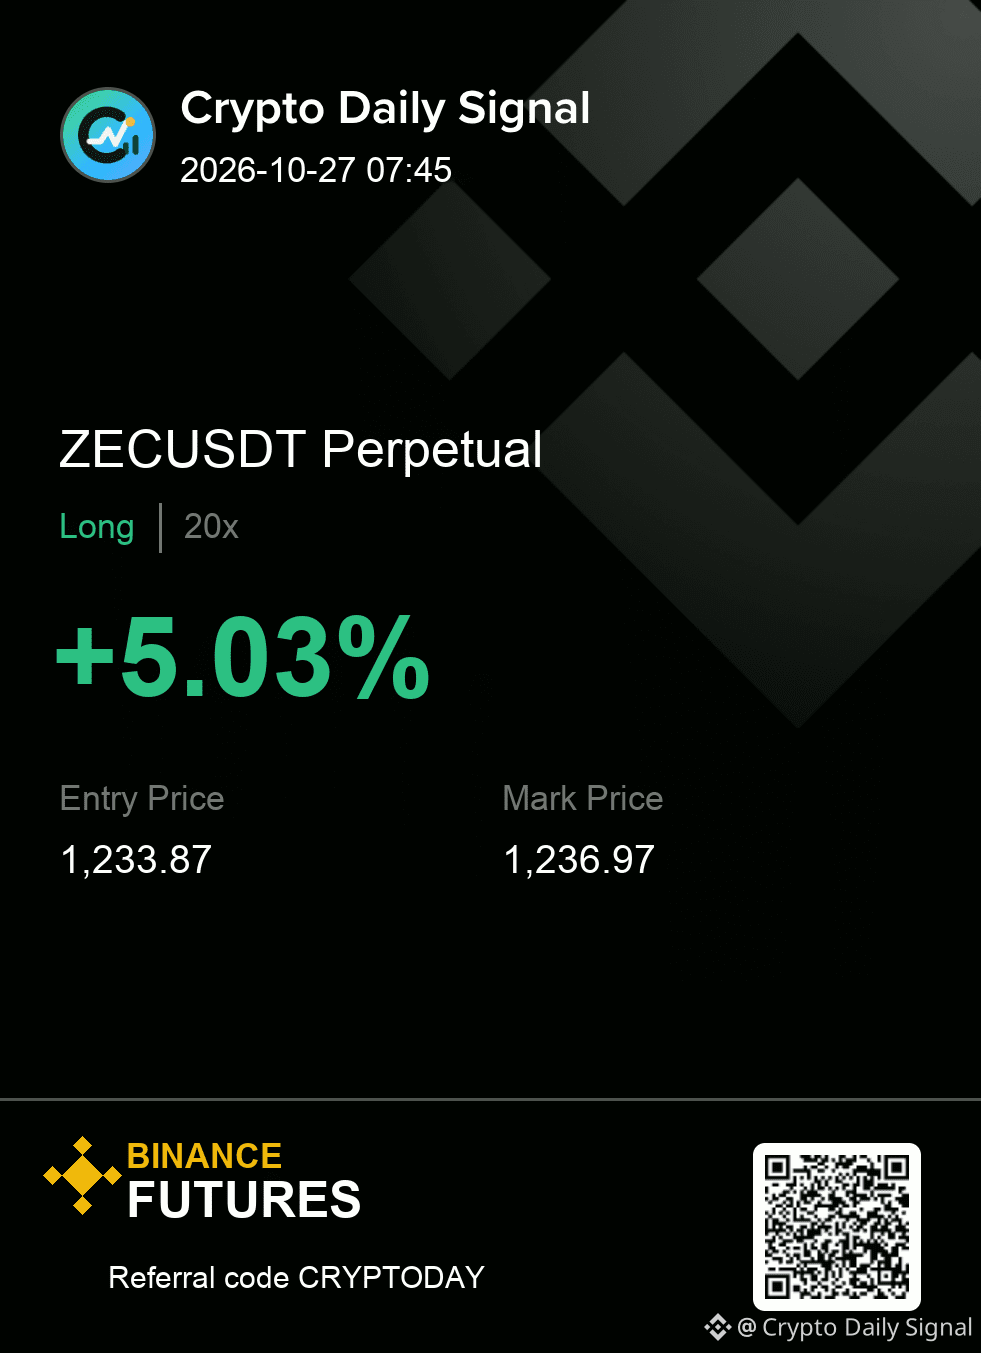
$ZEC — honestly, the chart still says it is still tilted toward buyers because the recent price action is showing stronger bullish candles and higher lows near the established range floor. The flow on the fifteen-minute chart shows positive momentum despite the neutral daily picture. If it breaks decisively above the immediate swing high, that would be the key confirmation here.
ZECUSDT LONG
IN 1,231.36 - 1,236.38
OUT 1,224.00
TP 1,243.74 · 1,251.63 · 1,261.50
#TradingSignal
{future}(ZECUSDT)
$ZEC — honestly, the chart still says it is still tilted toward buyers because the recent price action is showing stronger bullish candles and higher lows near the established range floor. The flow on the fifteen-minute chart shows positive momentum despite the neutral daily picture. If it breaks decisively above the immediate swing high, that would be the key confirmation here.
ZECUSDT LONG
IN 1,231.36 - 1,236.38
OUT 1,224.00
TP 1,243.74 · 1,251.63 · 1,261.50
#TradingSignal
ZECUSDT LONG
IN 1,231.36 - 1,236.38
OUT 1,224.00
TP 1,243.74 · 1,251.63 · 1,261.50
#TradingSignal
21
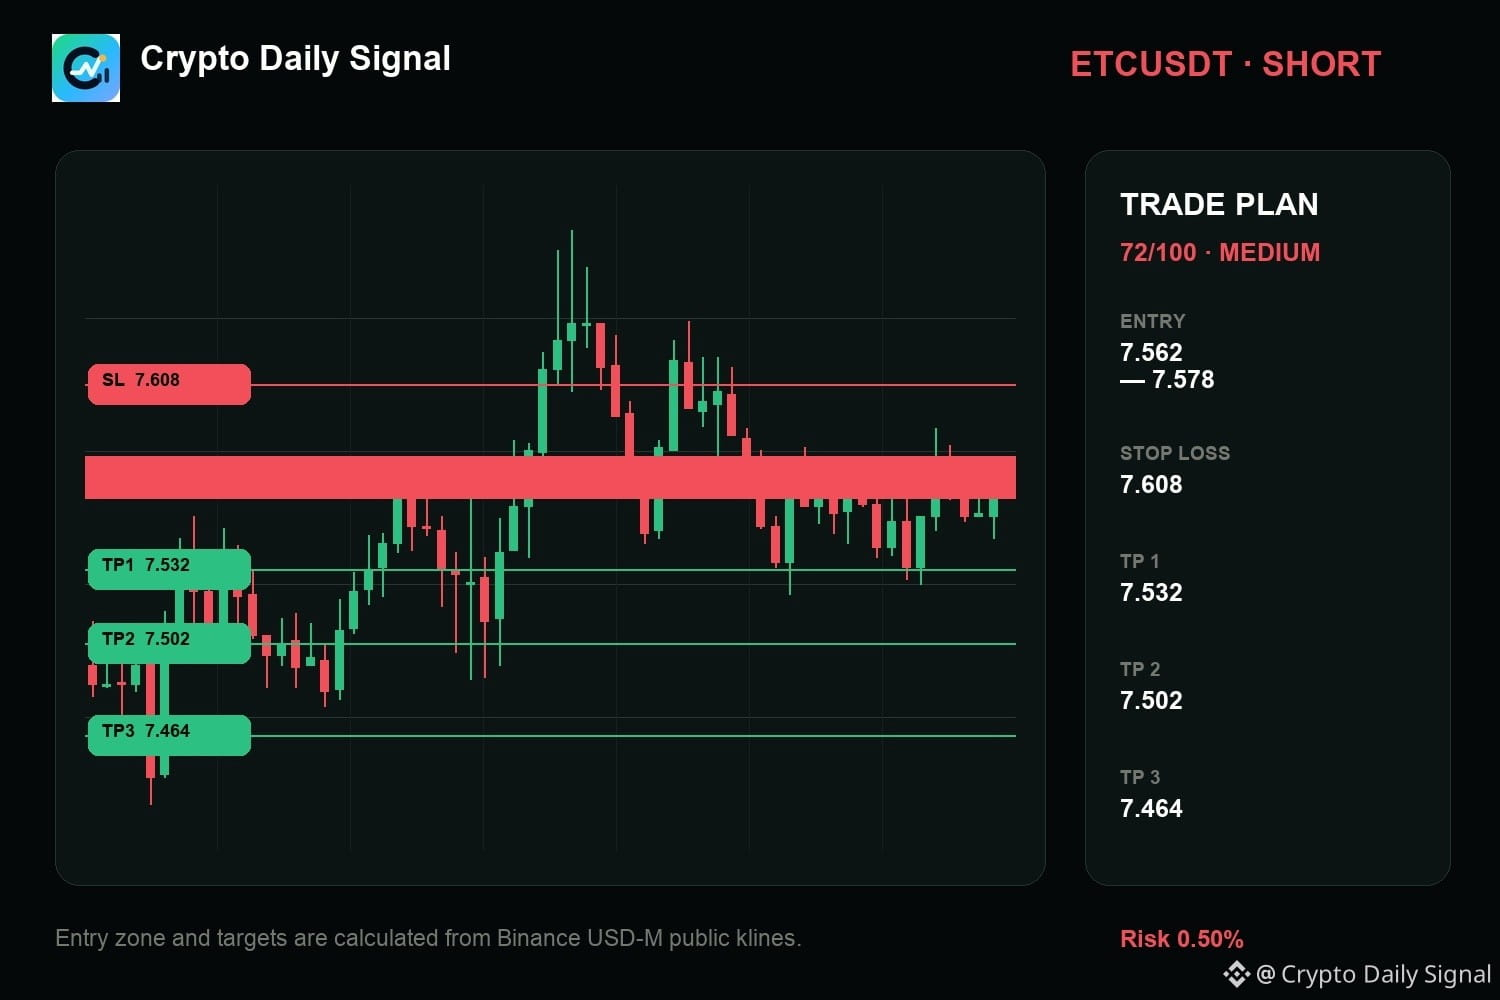
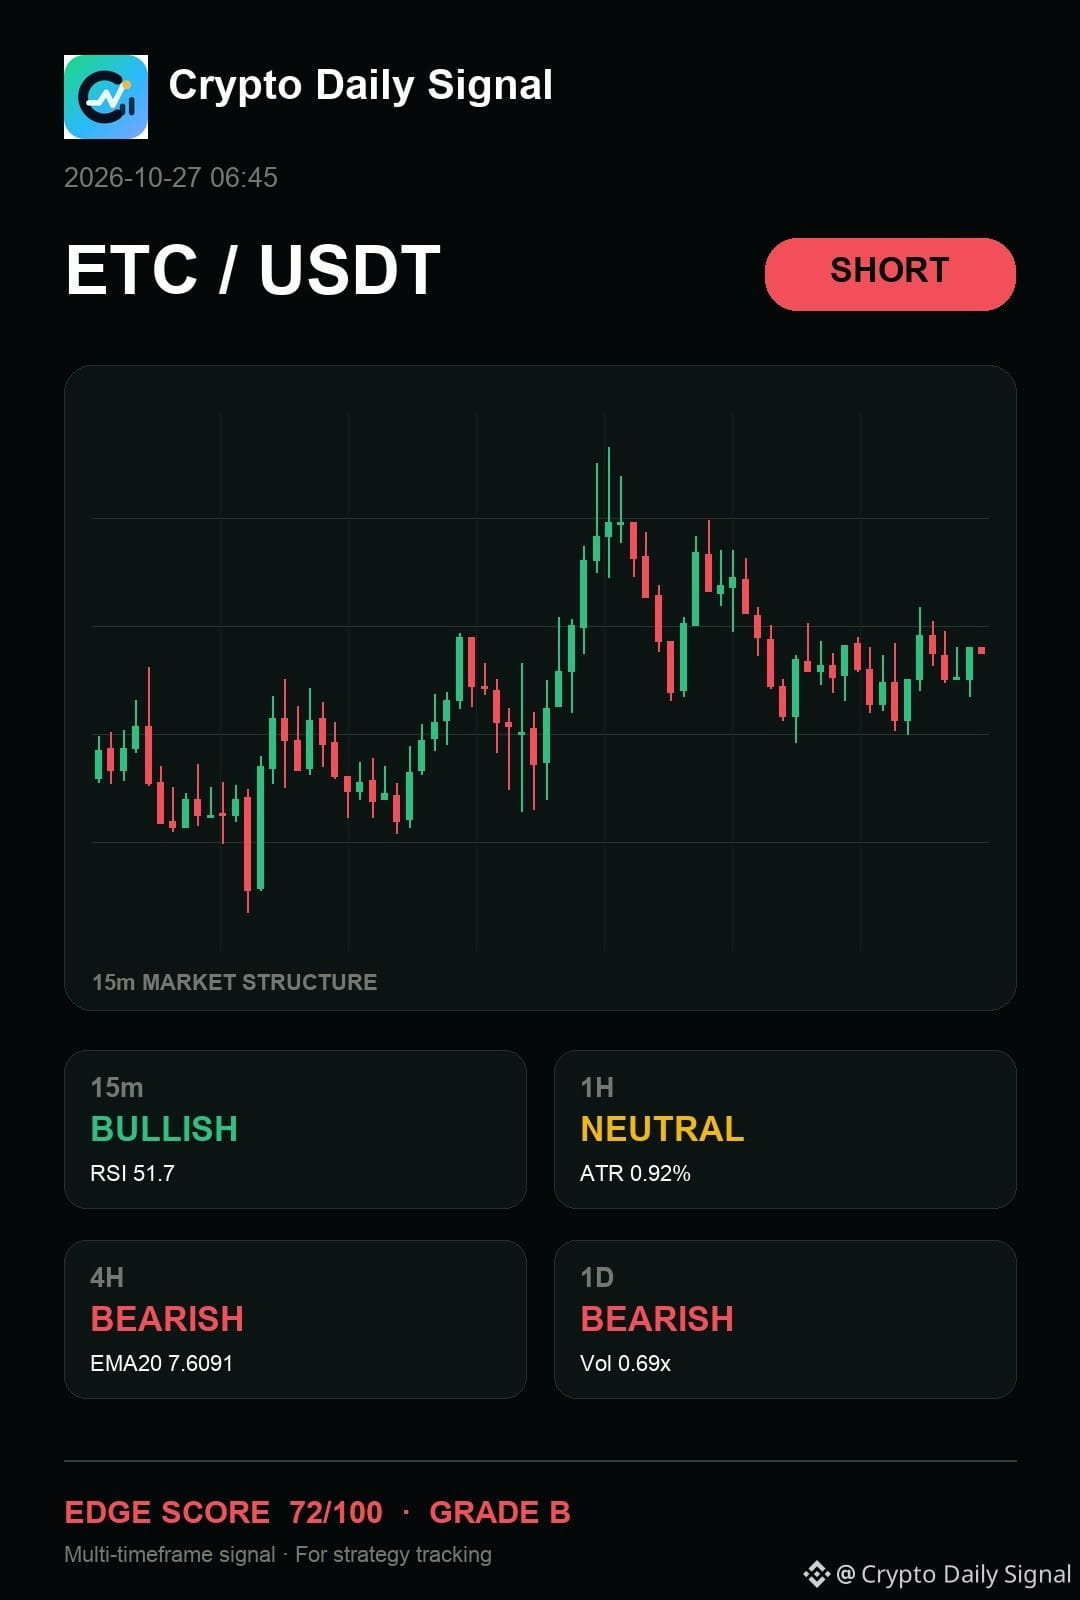
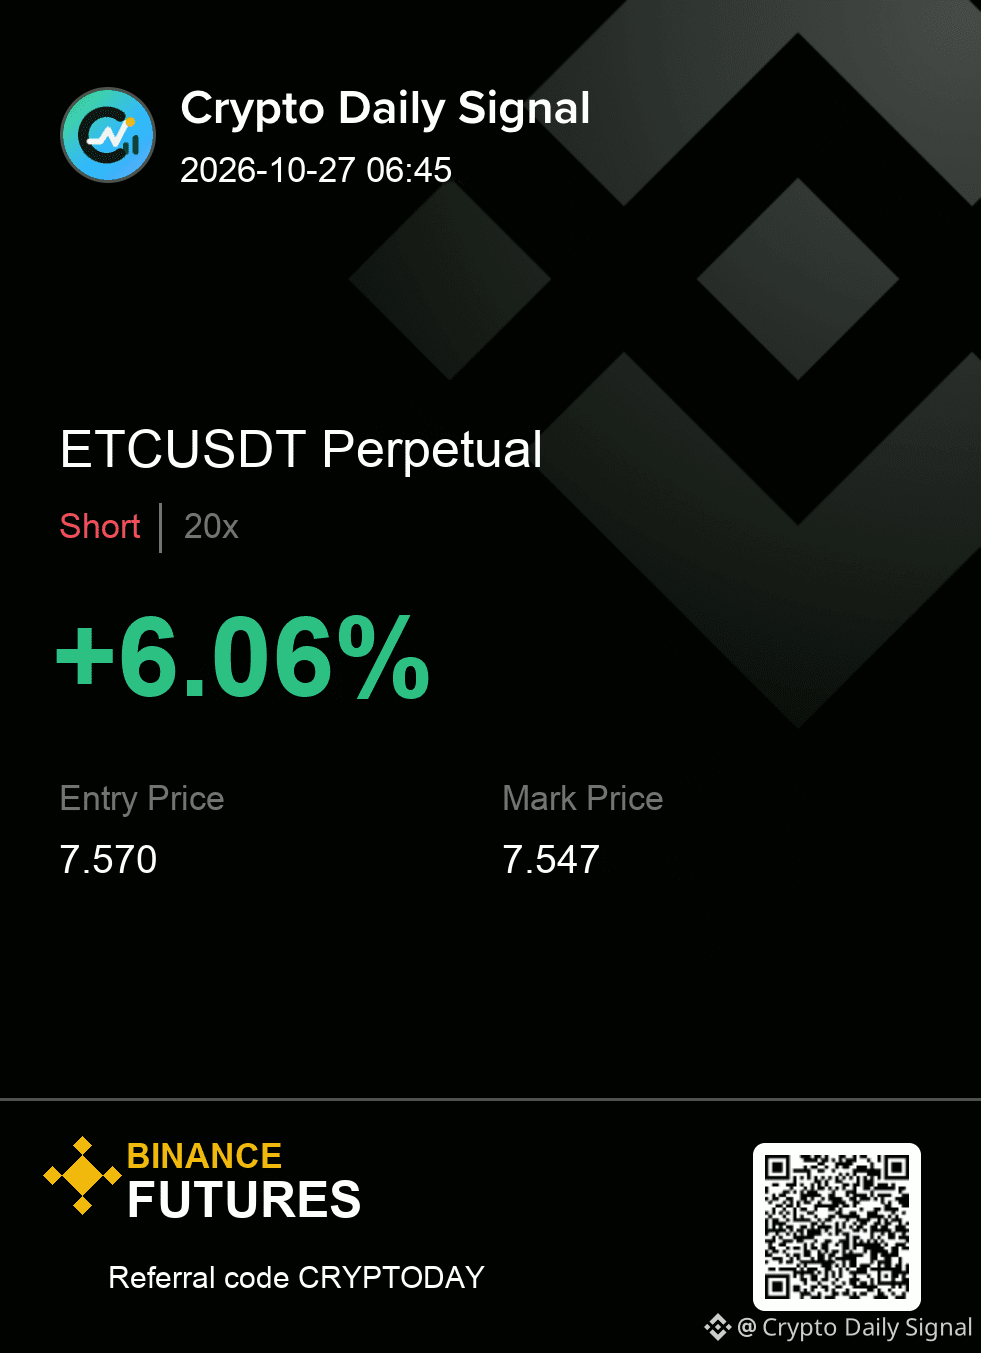
$ETC — tbh, I keep coming back to how it has not invalidated the short case; the current action is trapped within a relatively tight box, despite the broader daily and four-hour trends pointing down. Sellers are pushing hard at the upper edge of this range, and a break below the floor would confirm the bearish setup. A strong close back above that high would throw this short narrative into question.
Execution plan (ETCUSDT — SHORT)
Entry: 7.562 - 7.578 | SL: 7.608
Take profit: 7.532 → 7.502 → 7.464
Would you take it here, or wait for one more confirmation candle?
#TradingSignal
{future}(ETCUSDT)
$ETC — tbh, I keep coming back to how it has not invalidated the short case; the current action is trapped within a relatively tight box, despite the broader daily and four-hour trends pointing down. Sellers are pushing hard at the upper edge of this range, and a break below the floor would confirm the bearish setup. A strong close back above that high would throw this short narrative into question.
Execution plan (ETCUSDT — SHORT)
Entry: 7.562 - 7.578 | SL: 7.608
Take profit: 7.532 → 7.502 → 7.464
Would you take it here, or wait for one more confirmation candle?
#TradingSignal
Execution plan (ETCUSDT — SHORT)
Entry: 7.562 - 7.578 | SL: 7.608
Take profit: 7.532 → 7.502 → 7.464
Would you take it here, or wait for one more confirmation candle?
#TradingSignal
8
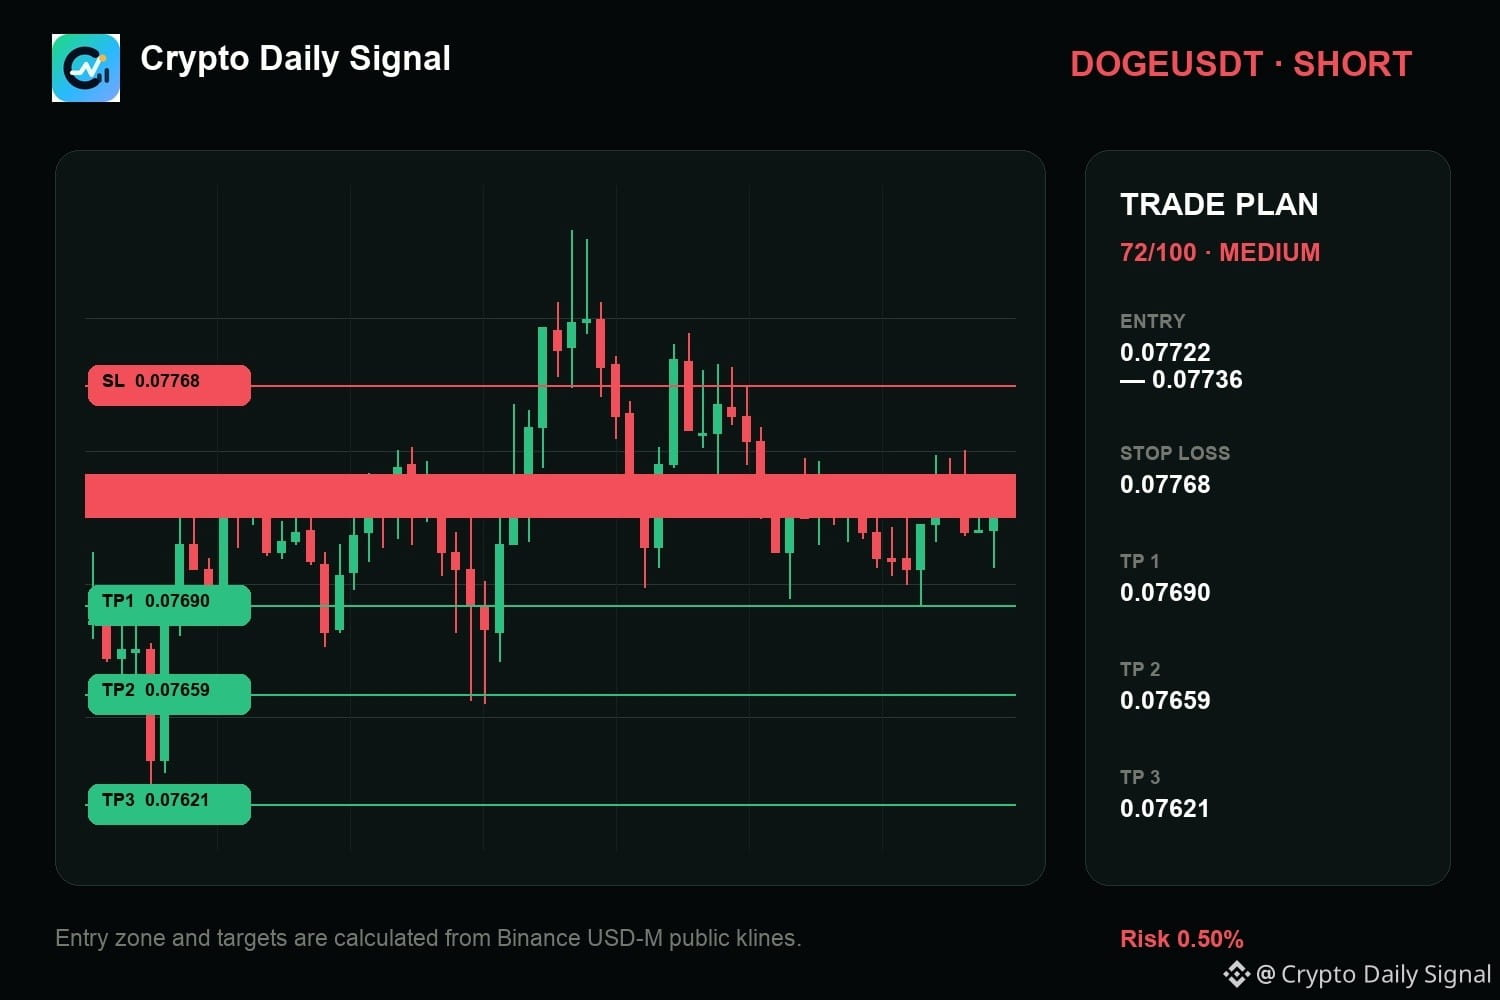
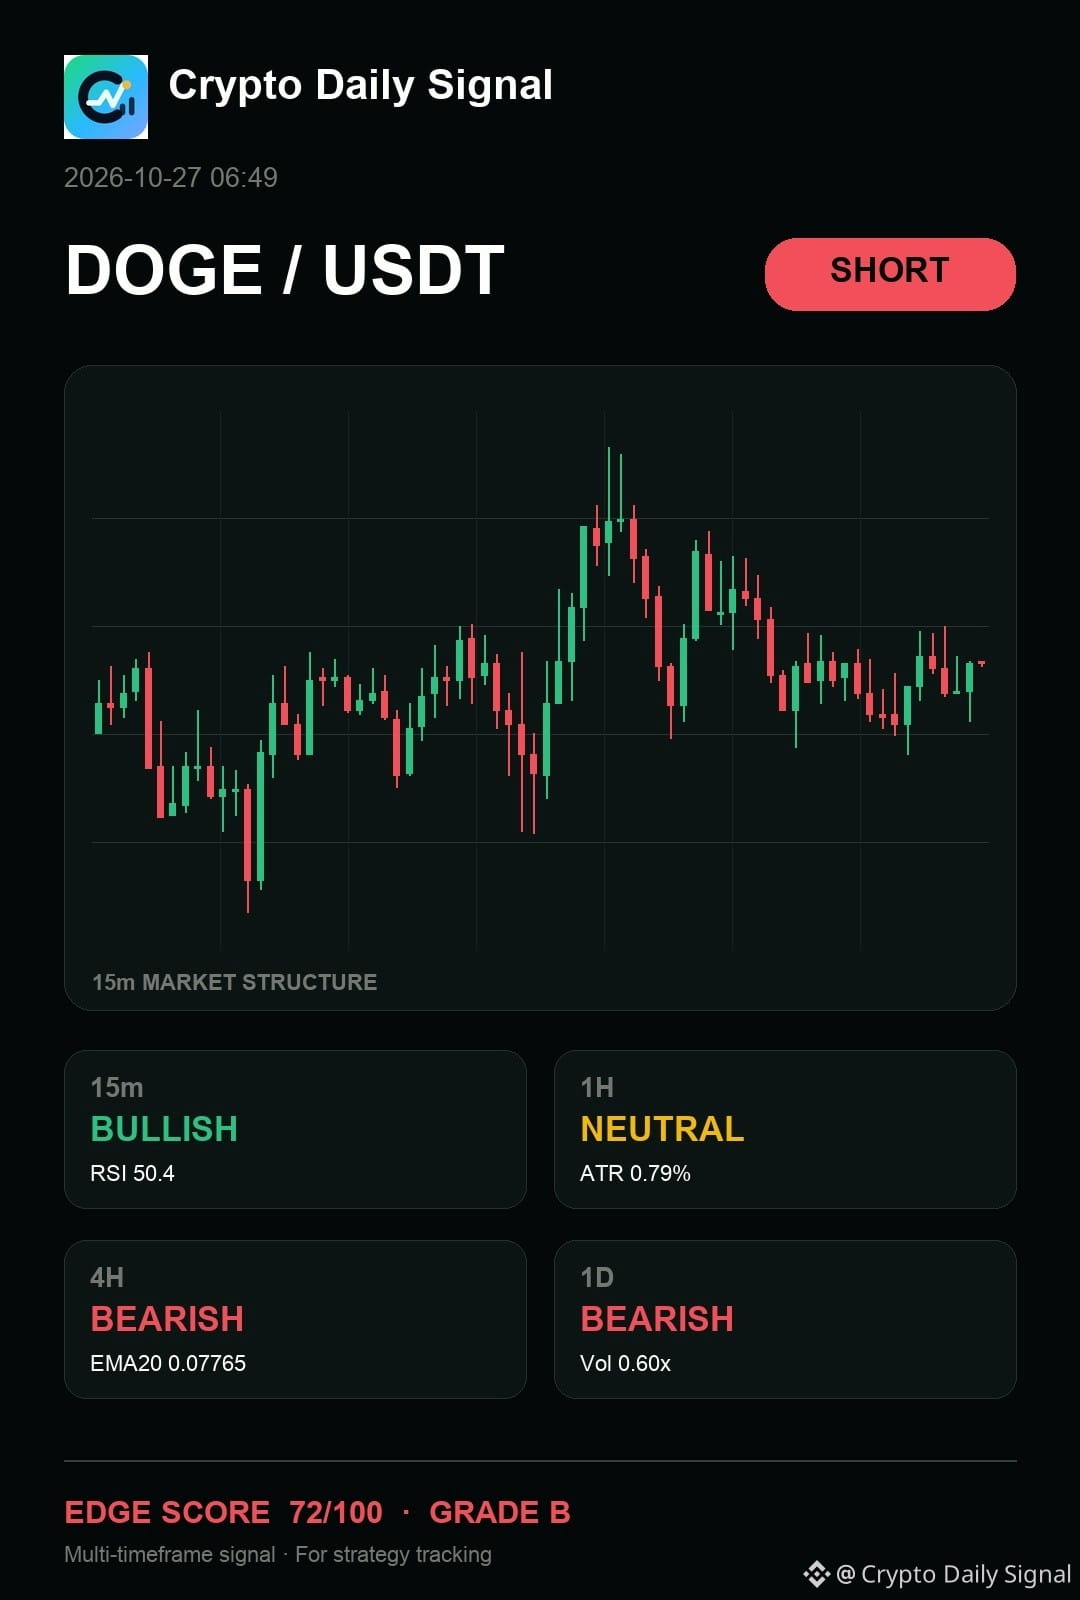
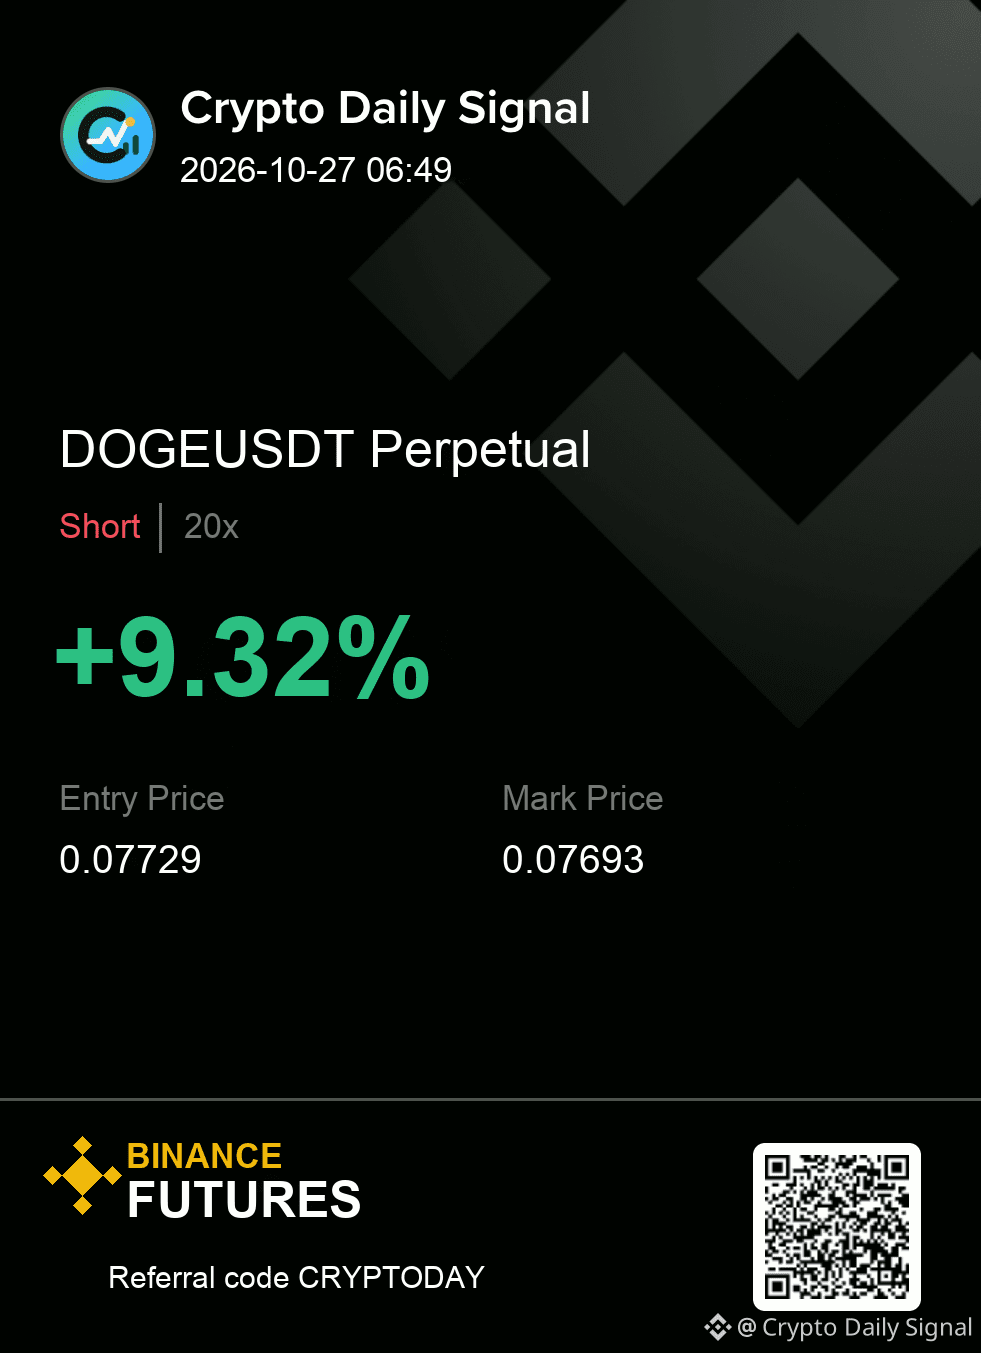
$DOGE — right now, I would say it requires patience before the short is actionable as the price action is making lower highs in the current range, and the latest candle shows clear selling pressure rejection from higher areas. The underlying view from the daily and four-hour charts remains bearish, suggesting bears are in control. A definitive drop below the recent short-term range floor would confirm the bearish setup.
DOGEUSDT | SHORT
Entry 0.07722 - 0.07736
Invalidation 0.07768
Targets 0.07690 / 0.07659 / 0.07621
#TradingSignal
{future}(DOGEUSDT)
$DOGE — right now, I would say it requires patience before the short is actionable as the price action is making lower highs in the current range, and the latest candle shows clear selling pressure rejection from higher areas. The underlying view from the daily and four-hour charts remains bearish, suggesting bears are in control. A definitive drop below the recent short-term range floor would confirm the bearish setup.
DOGEUSDT | SHORT
Entry 0.07722 - 0.07736
Invalidation 0.07768
Targets 0.07690 / 0.07659 / 0.07621
#TradingSignal
DOGEUSDT | SHORT
Entry 0.07722 - 0.07736
Invalidation 0.07768
Targets 0.07690 / 0.07659 / 0.07621
#TradingSignal
22
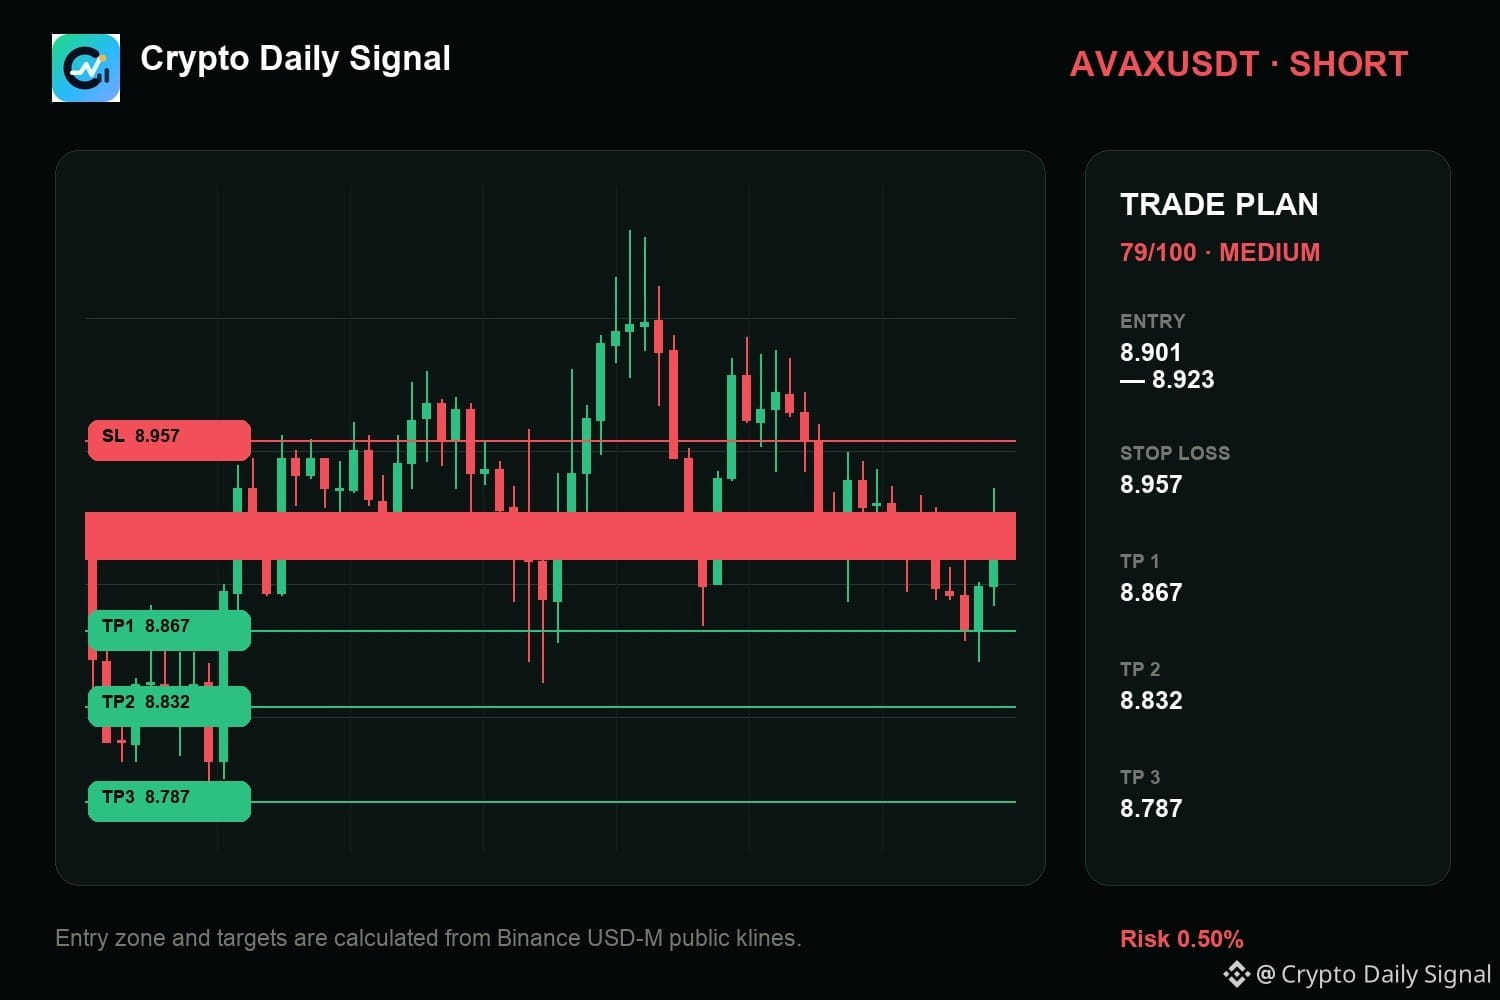
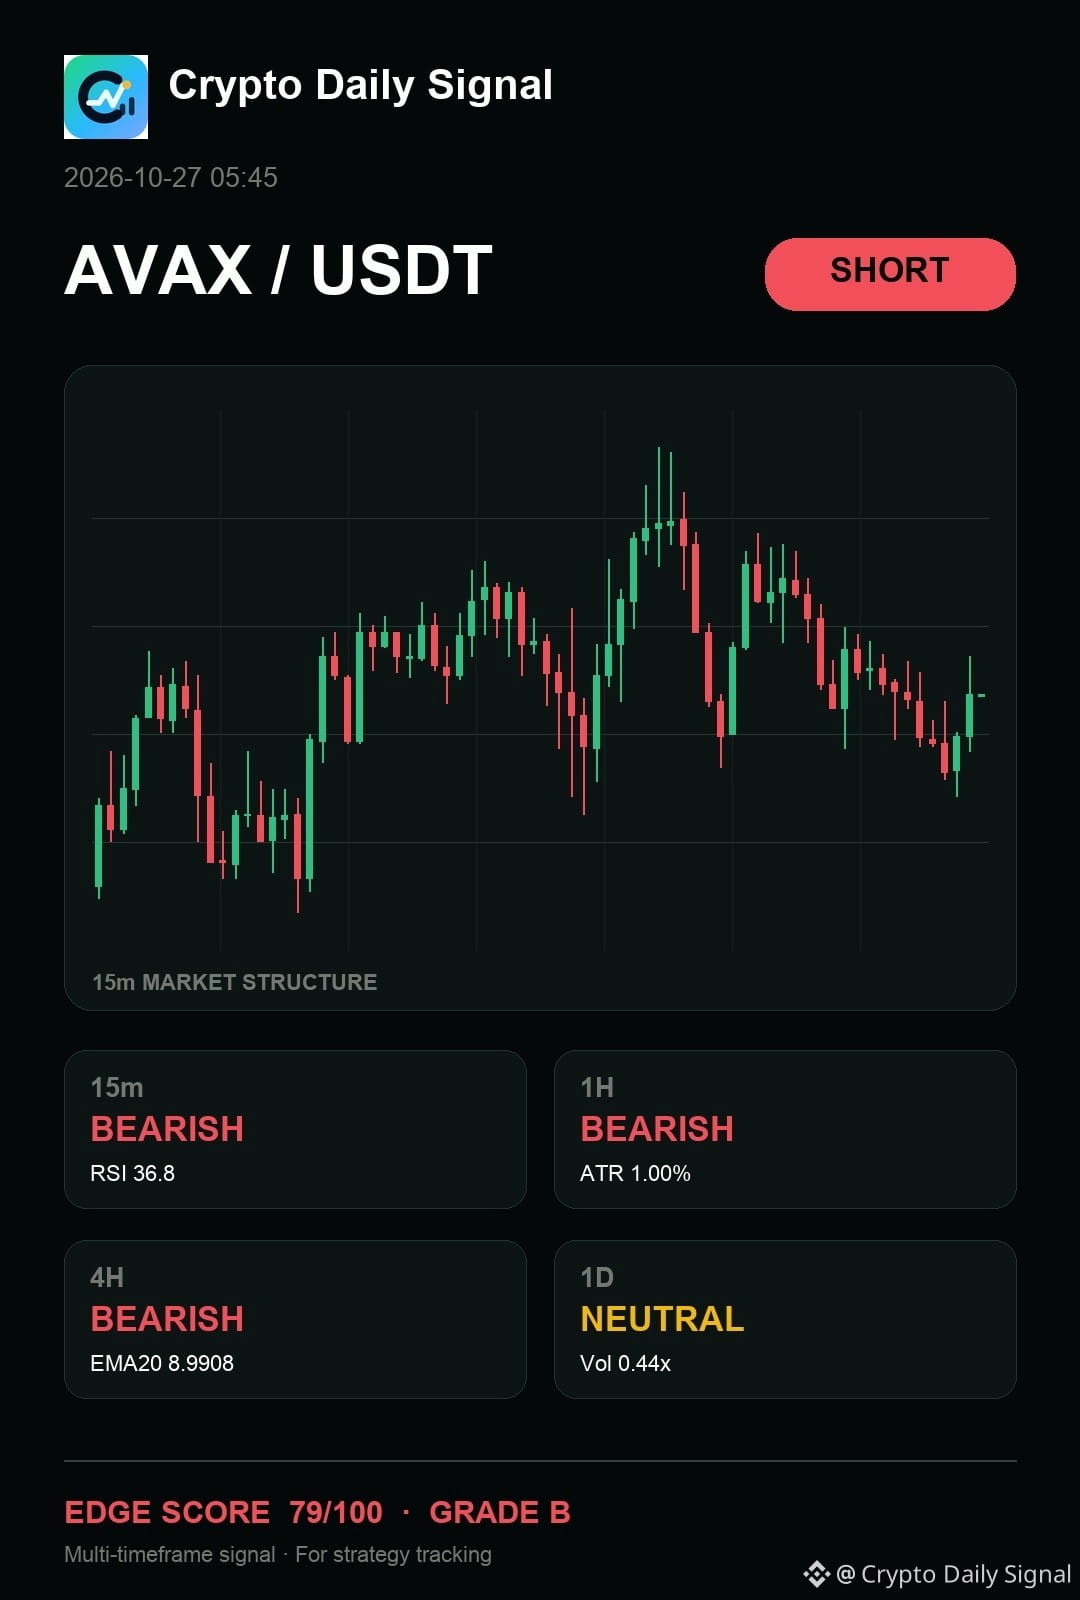
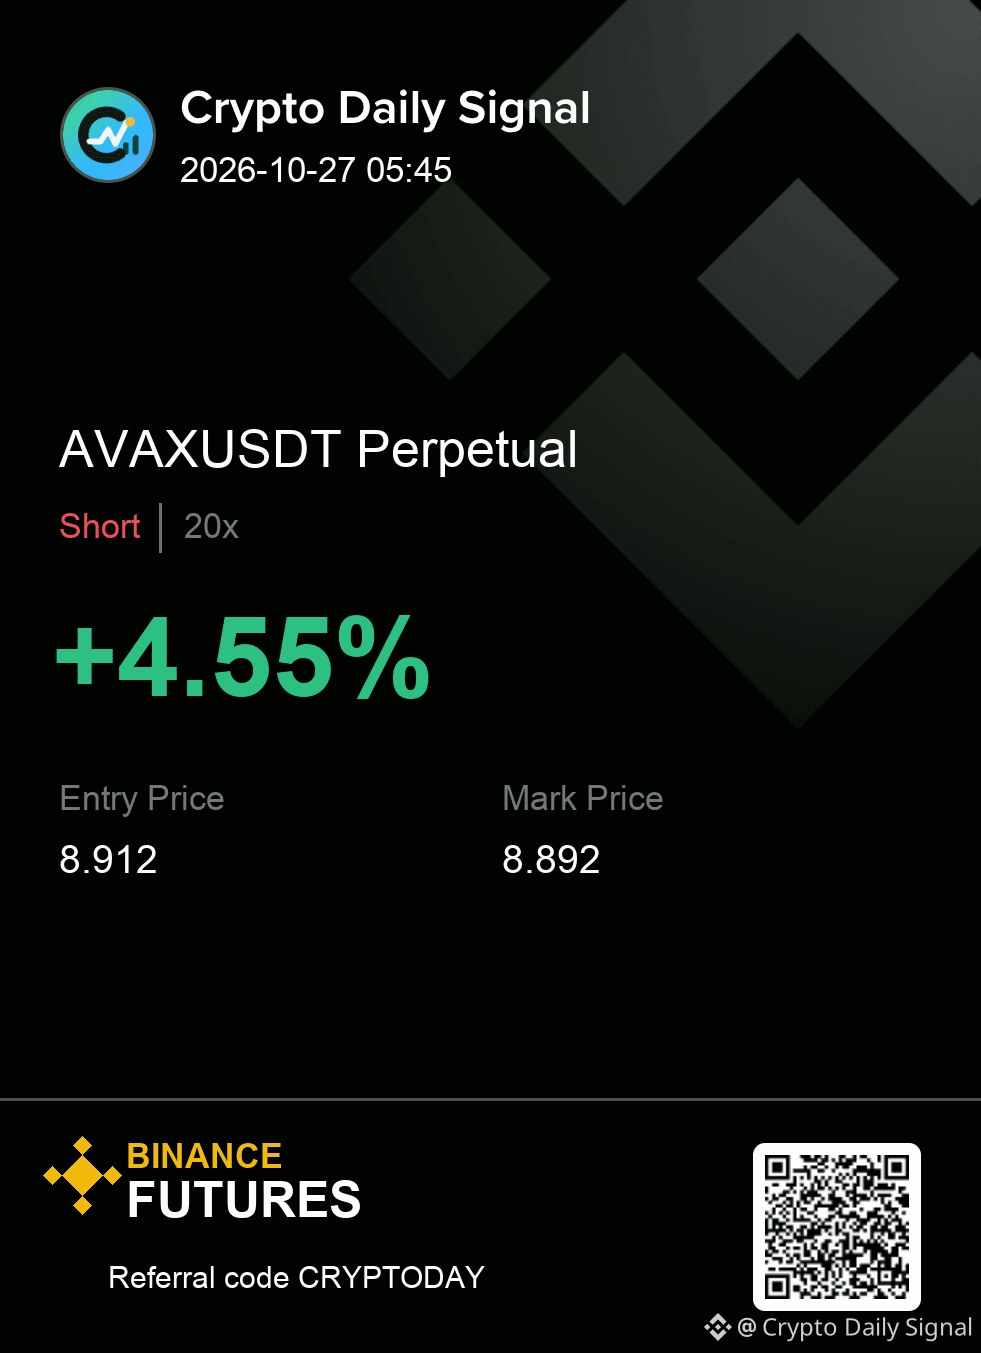
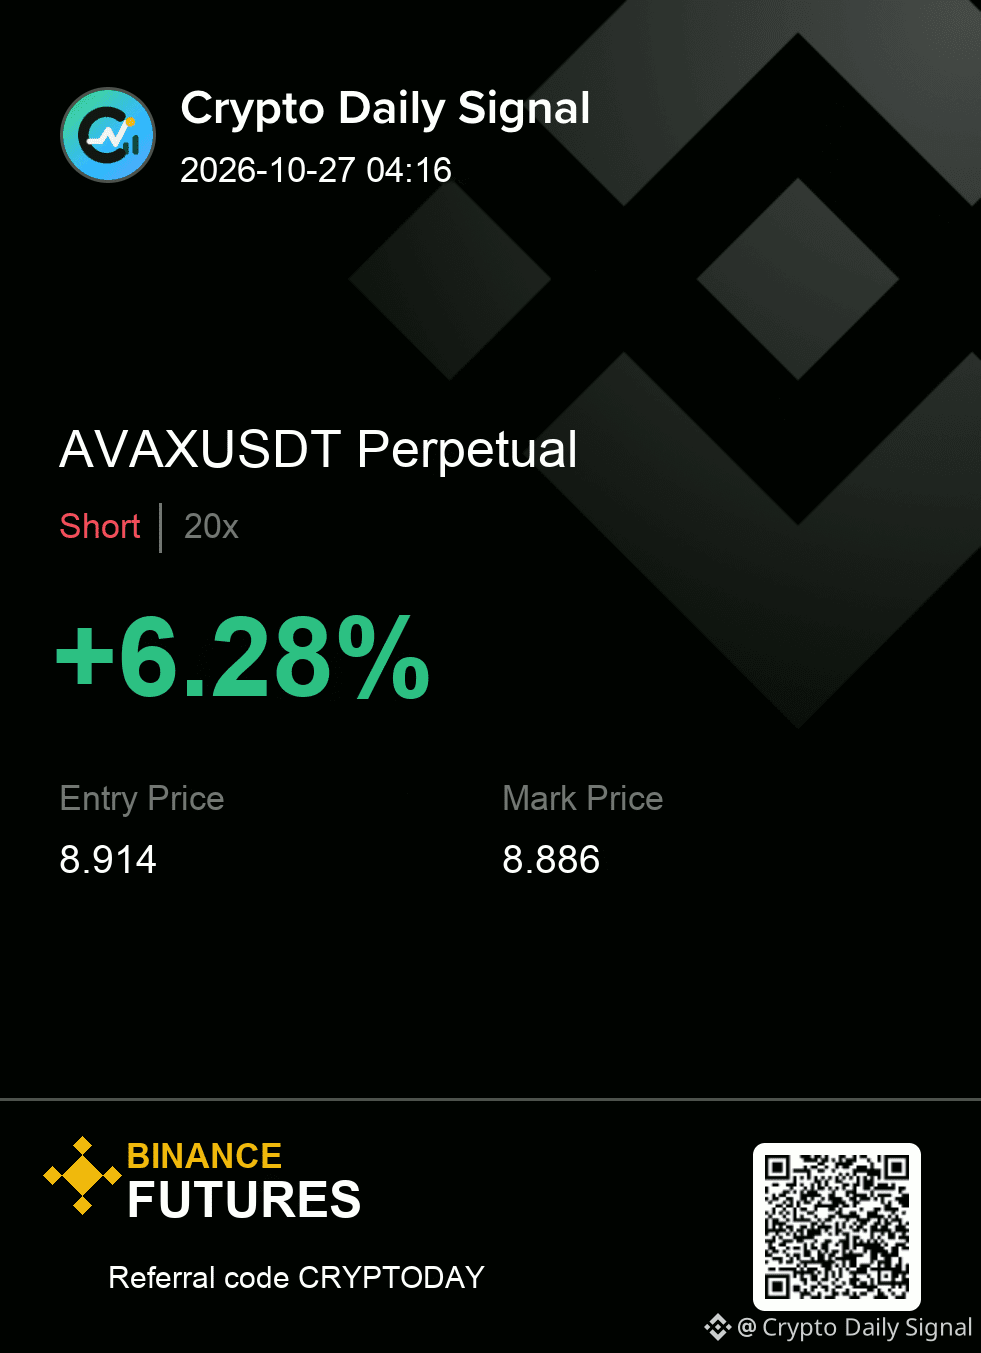
$AVAX still offers the cleaner bearish argument as the price remains trapped in a descending channel, despite the broader daily picture being neutral. Short-term action shows rejection from higher levels on the fifteen-minute chart, suggesting selling pressure persists. A clear drop below the immediate short-term low would push the case forward, but a break above the recent high would negate the setup.
Levels — AVAXUSDT
Zone: 8.901 - 8.923
Cut: 8.957
Scale: 8.867 | 8.832 | 8.787
Does the structure look clean enough, or would you leave this one alone?
#TradingSignal
{future}(AVAXUSDT)
$AVAX still offers the cleaner bearish argument as the price remains trapped in a descending channel, despite the broader daily picture being neutral. Short-term action shows rejection from higher levels on the fifteen-minute chart, suggesting selling pressure persists. A clear drop below the immediate short-term low would push the case forward, but a break above the recent high would negate the setup.
Levels — AVAXUSDT
Zone: 8.901 - 8.923
Cut: 8.957
Scale: 8.867 | 8.832 | 8.787
Does the structure look clean enough, or would you leave this one alone?
#TradingSignal
Levels — AVAXUSDT
Zone: 8.901 - 8.923
Cut: 8.957
Scale: 8.867 | 8.832 | 8.787
Does the structure look clean enough, or would you leave this one alone?
#TradingSignal
9
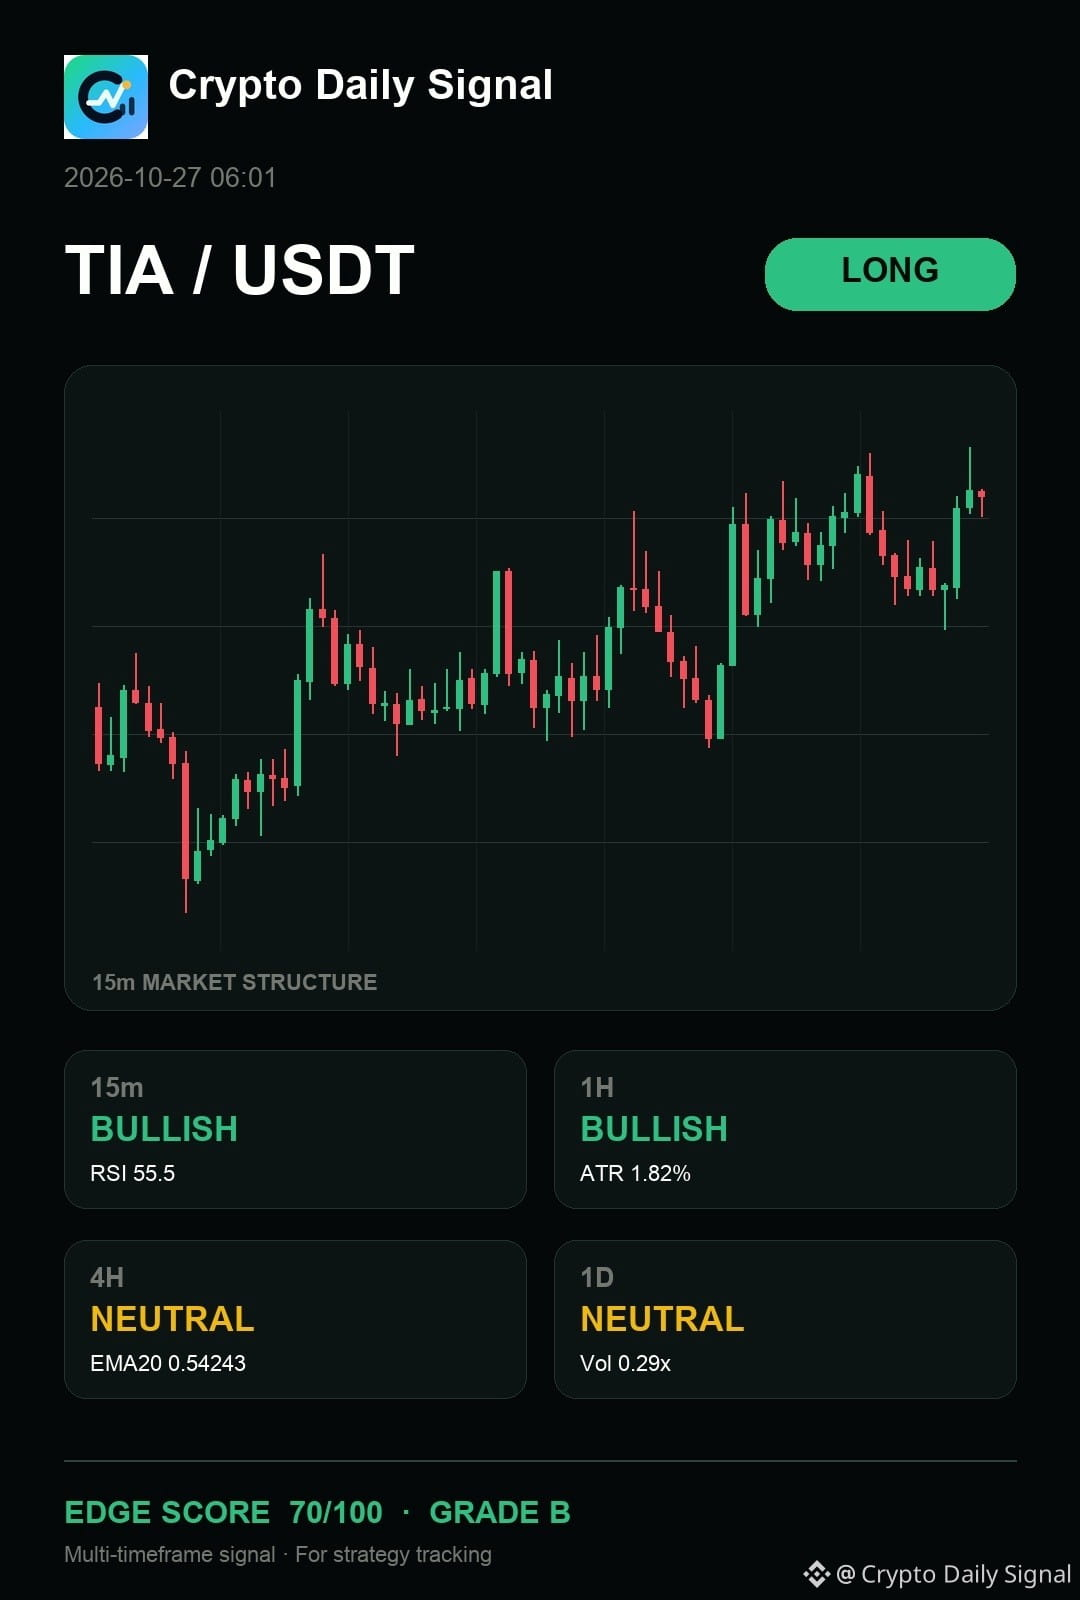
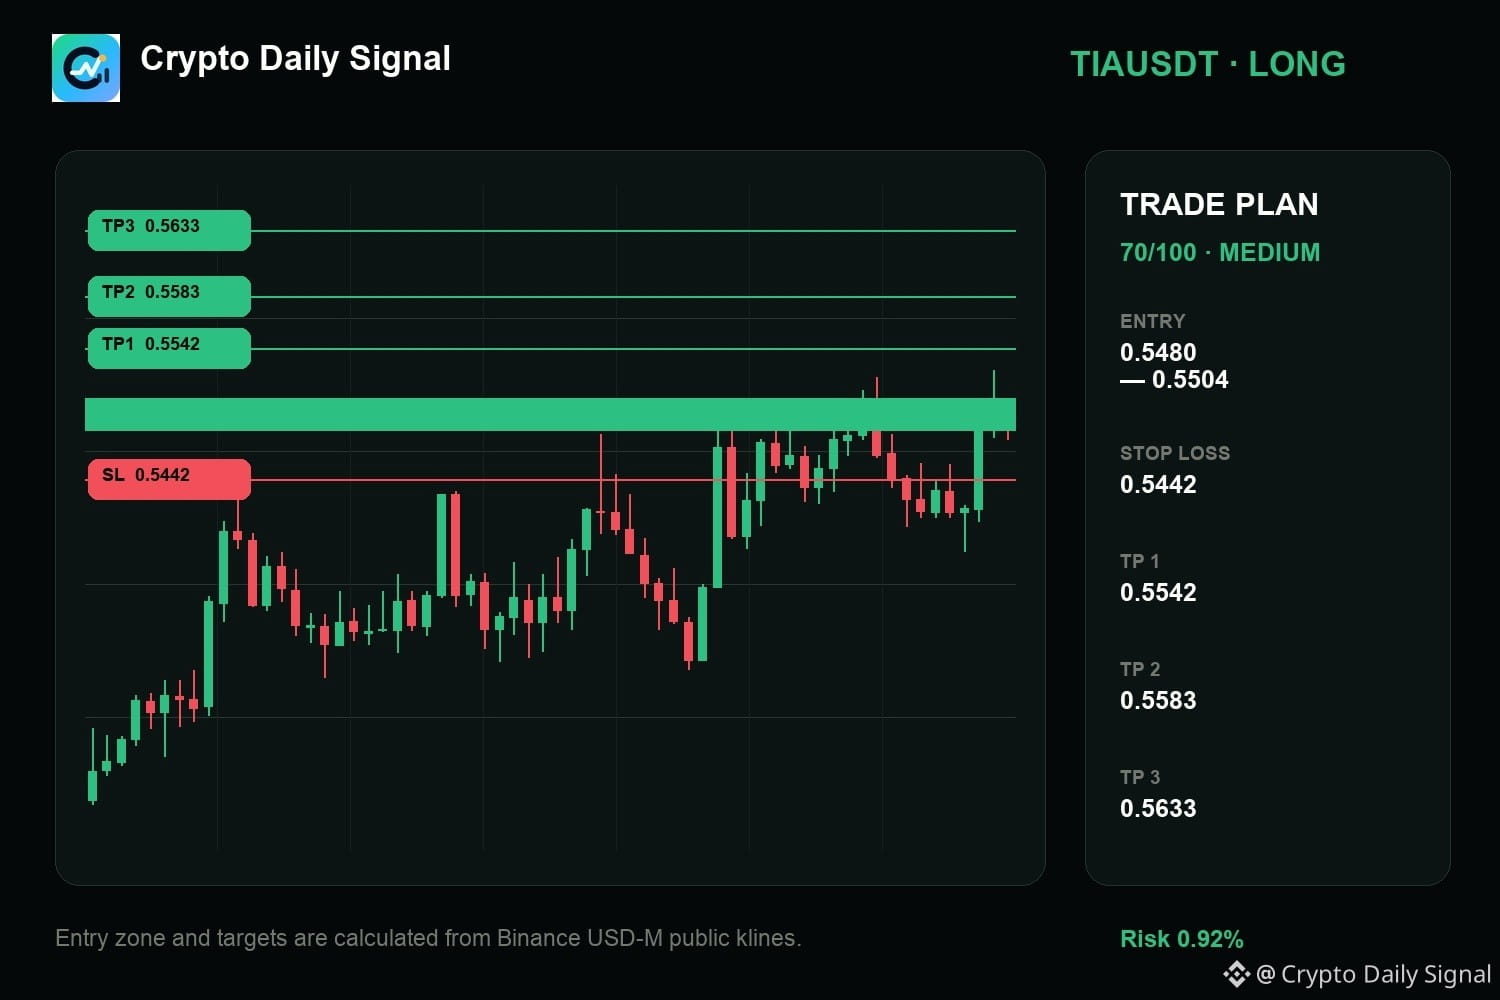
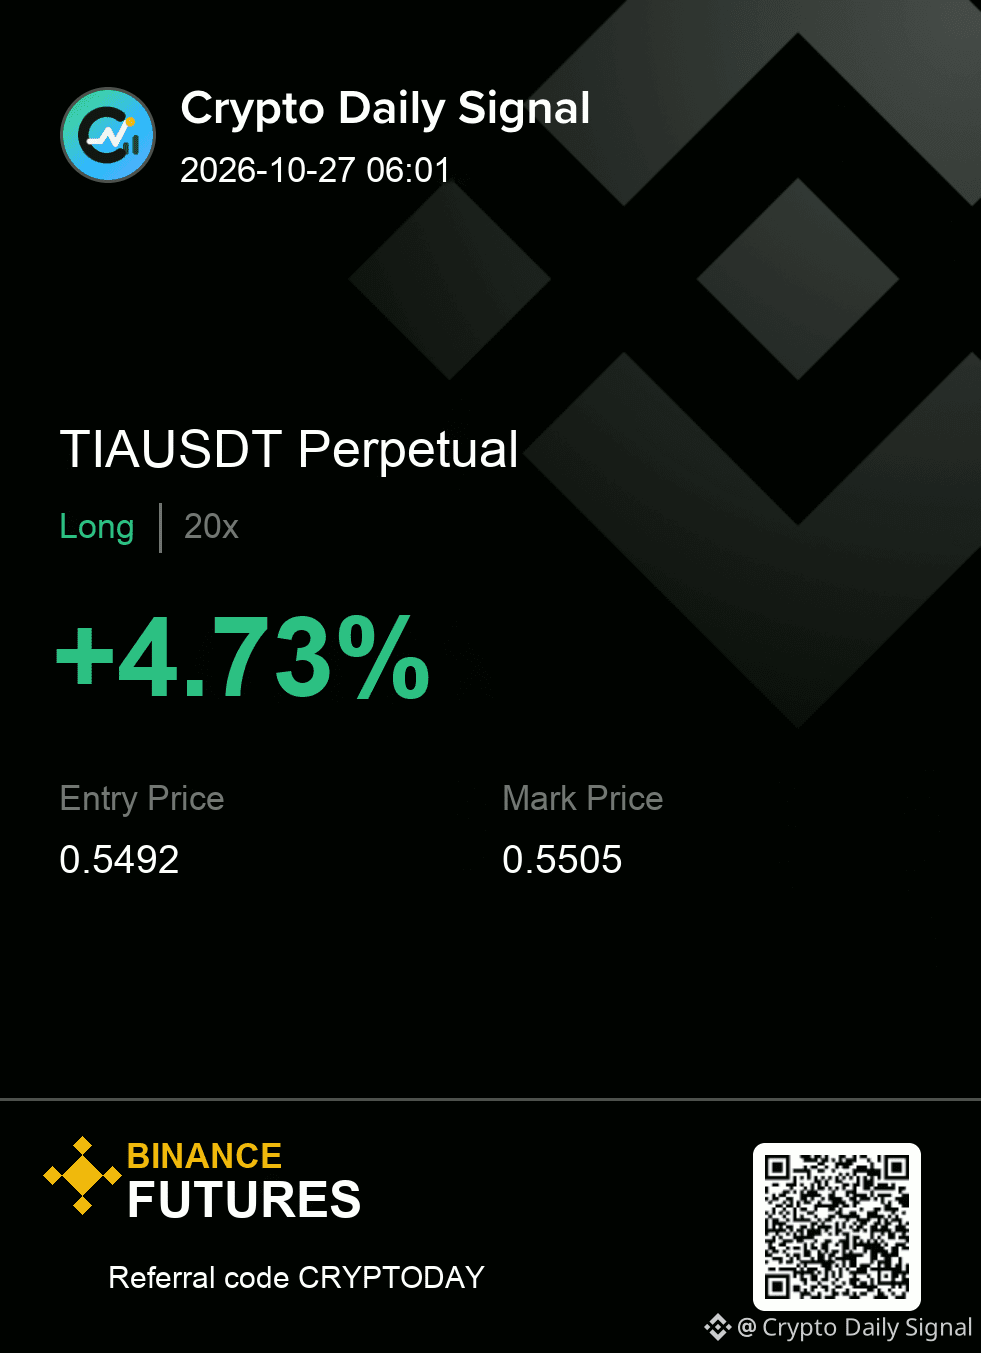
$TIA — right now, I would say it continues to favor the long case as recent candles build a higher-low pattern, keeping above the low of the recent pullback. The short-term action shows buying overcoming immediate selling, which is a key setup. If it breaches the recent high, that reinforces the upward move. However, any bearish close back below that established range floor would signal a reversal.
Levels — TIAUSDT
Zone: 0.5480 - 0.5504
Cut: 0.5442
Scale: 0.5542 | 0.5583 | 0.5633
Clean enough to execute, or still too early for you?
#TradingSignal
{future}(TIAUSDT)
$TIA — right now, I would say it continues to favor the long case as recent candles build a higher-low pattern, keeping above the low of the recent pullback. The short-term action shows buying overcoming immediate selling, which is a key setup. If it breaches the recent high, that reinforces the upward move. However, any bearish close back below that established range floor would signal a reversal.
Levels — TIAUSDT
Zone: 0.5480 - 0.5504
Cut: 0.5442
Scale: 0.5542 | 0.5583 | 0.5633
Clean enough to execute, or still too early for you?
#TradingSignal
Levels — TIAUSDT
Zone: 0.5480 - 0.5504
Cut: 0.5442
Scale: 0.5542 | 0.5583 | 0.5633
Clean enough to execute, or still too early for you?
#TradingSignal
20
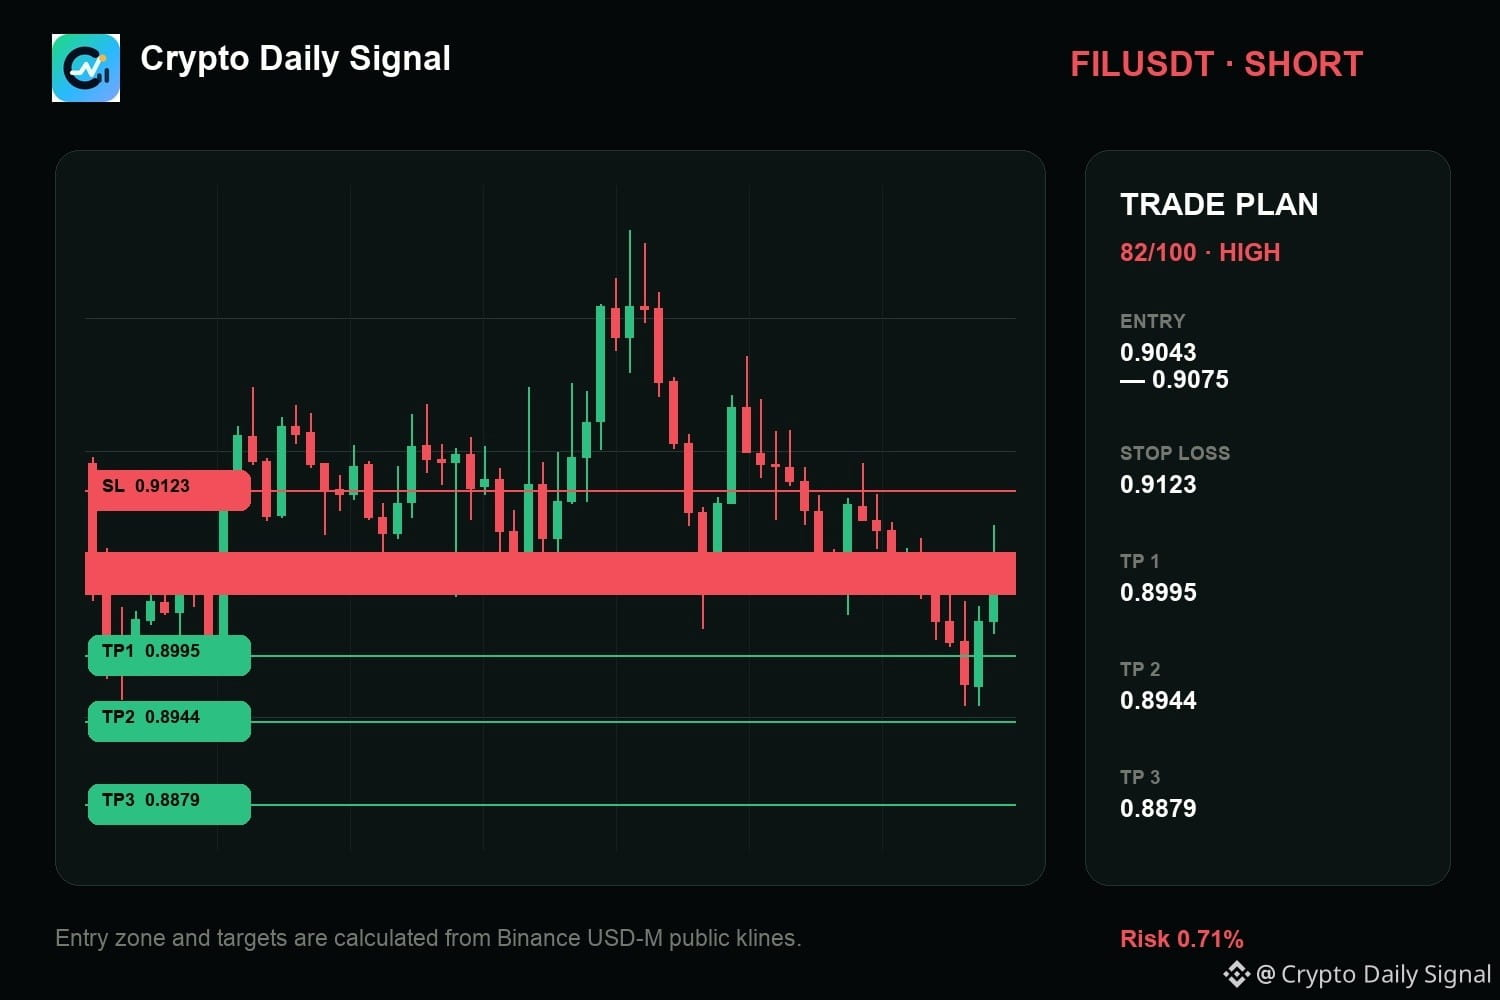
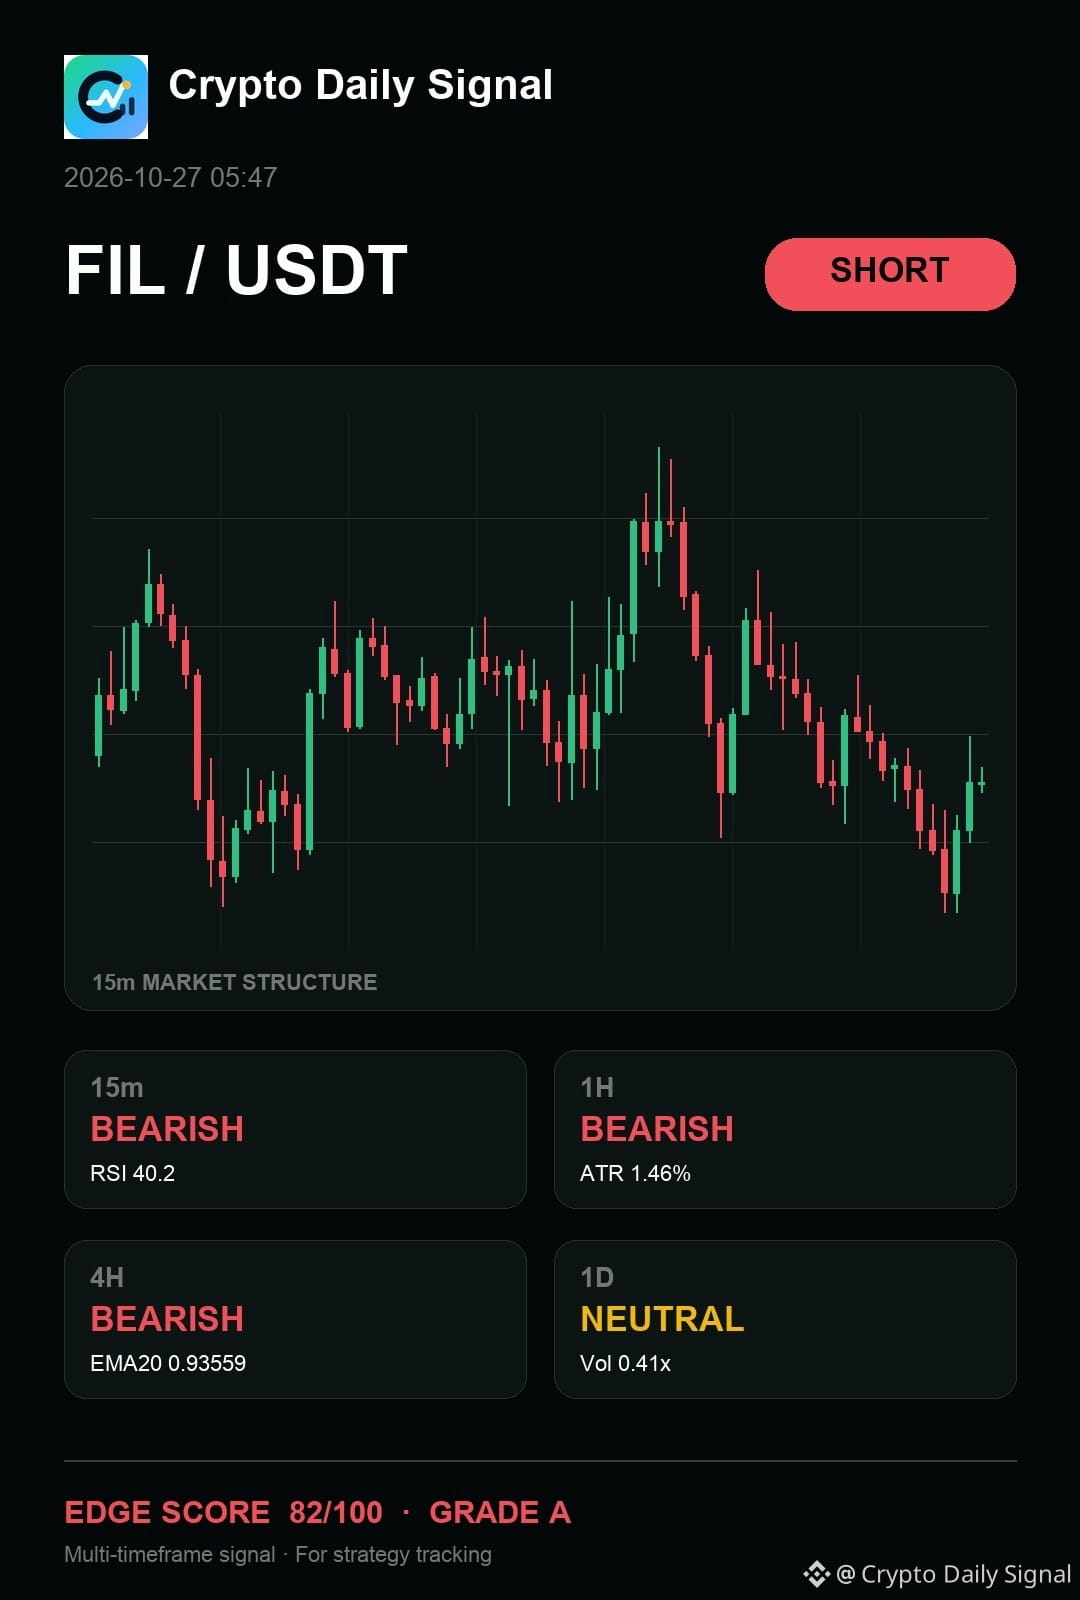
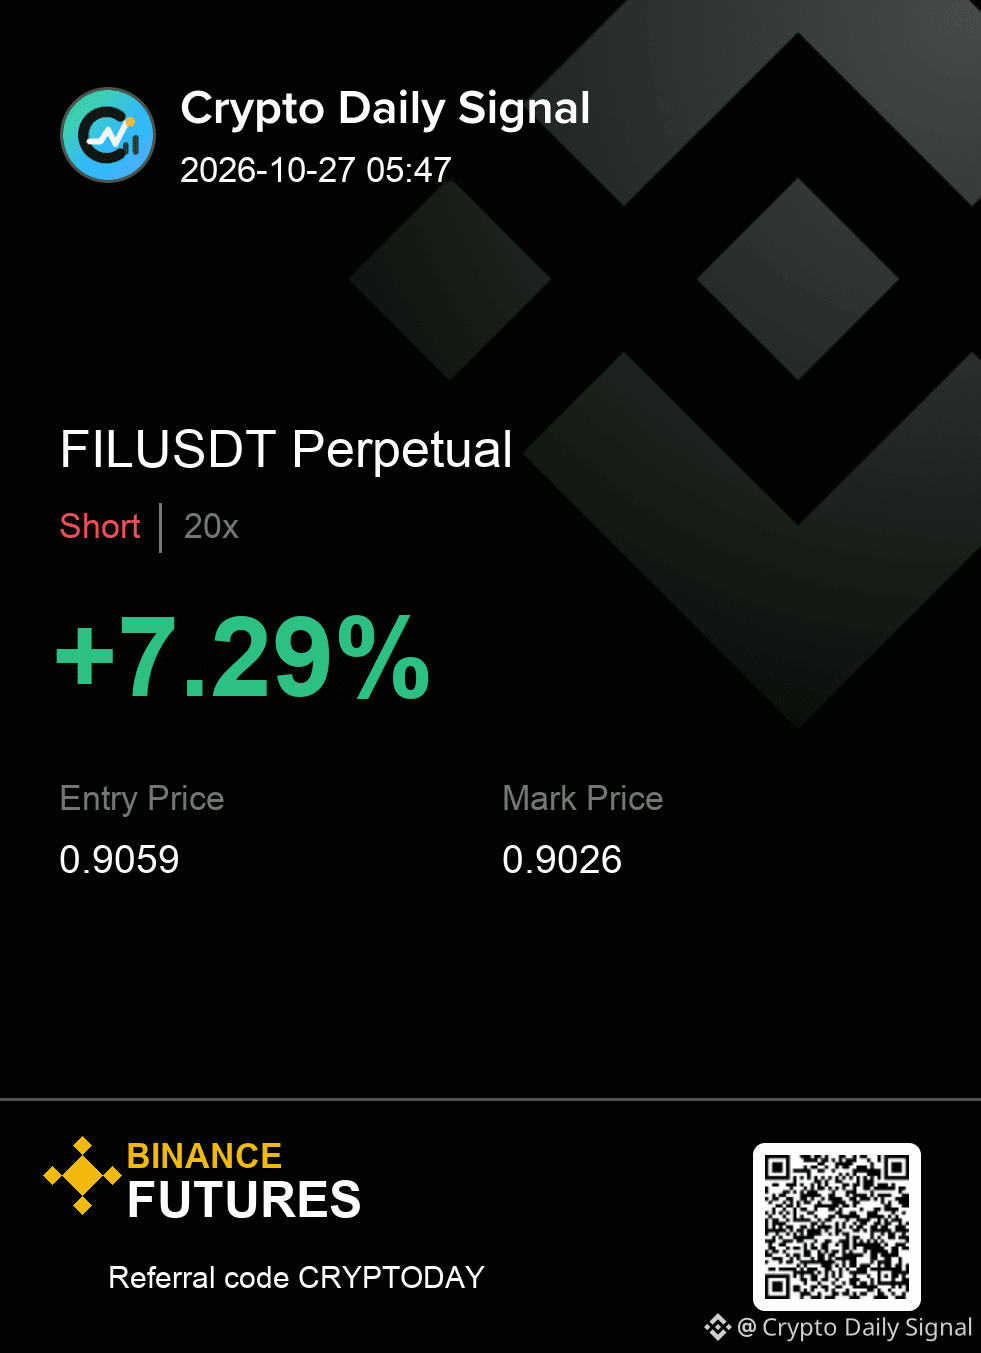
$FIL — ngl, the cleanest read is that it requires patience before the short is actionable. The price shows lower highs forming, and recent wick action suggests rejection near the upper bound. If it breaks below short-term support, the bearish view solidifies, but a move above the recent swing high invalidates the trade.
The map is useful only while the invalidation remains intact.
My levels for FILUSDT — SHORT
Entry zone 0.9043 - 0.9075
Risk line 0.9123
Targets 0.8995 / 0.8944 / 0.8879
#TradingSignal
{future}(FILUSDT)
$FIL — ngl, the cleanest read is that it requires patience before the short is actionable. The price shows lower highs forming, and recent wick action suggests rejection near the upper bound. If it breaks below short-term support, the bearish view solidifies, but a move above the recent swing high invalidates the trade.
The map is useful only while the invalidation remains intact.
My levels for FILUSDT — SHORT
Entry zone 0.9043 - 0.9075
Risk line 0.9123
Targets 0.8995 / 0.8944 / 0.8879
#TradingSignal
The map is useful only while the invalidation remains intact.
My levels for FILUSDT — SHORT
Entry zone 0.9043 - 0.9075
Risk line 0.9123
Targets 0.8995 / 0.8944 / 0.8879
#TradingSignal
30
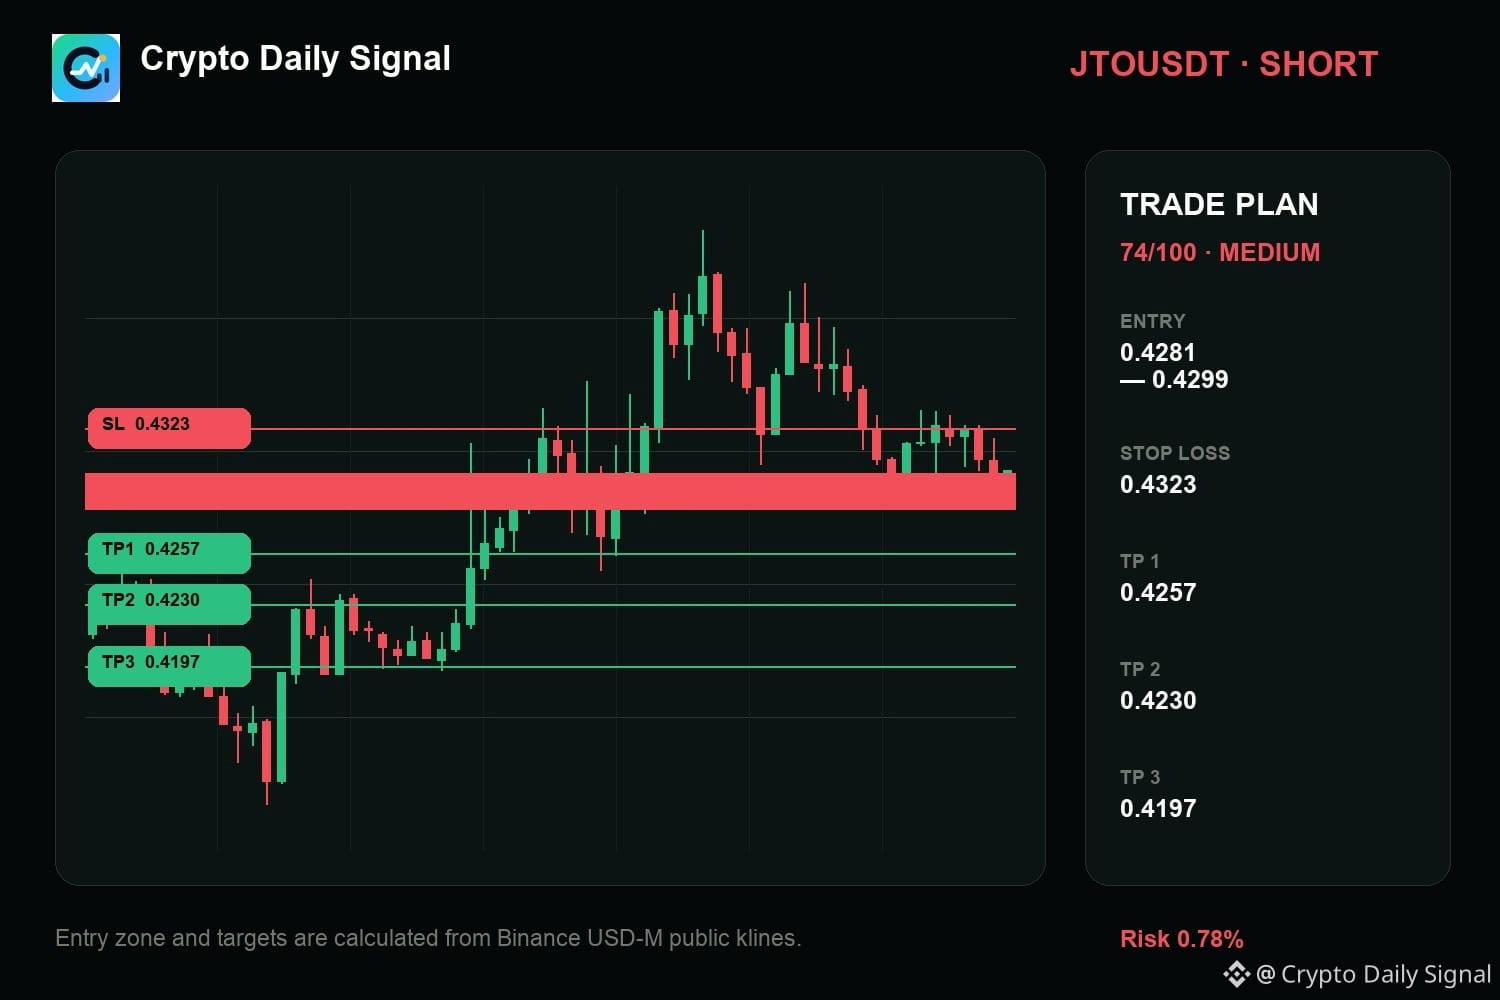
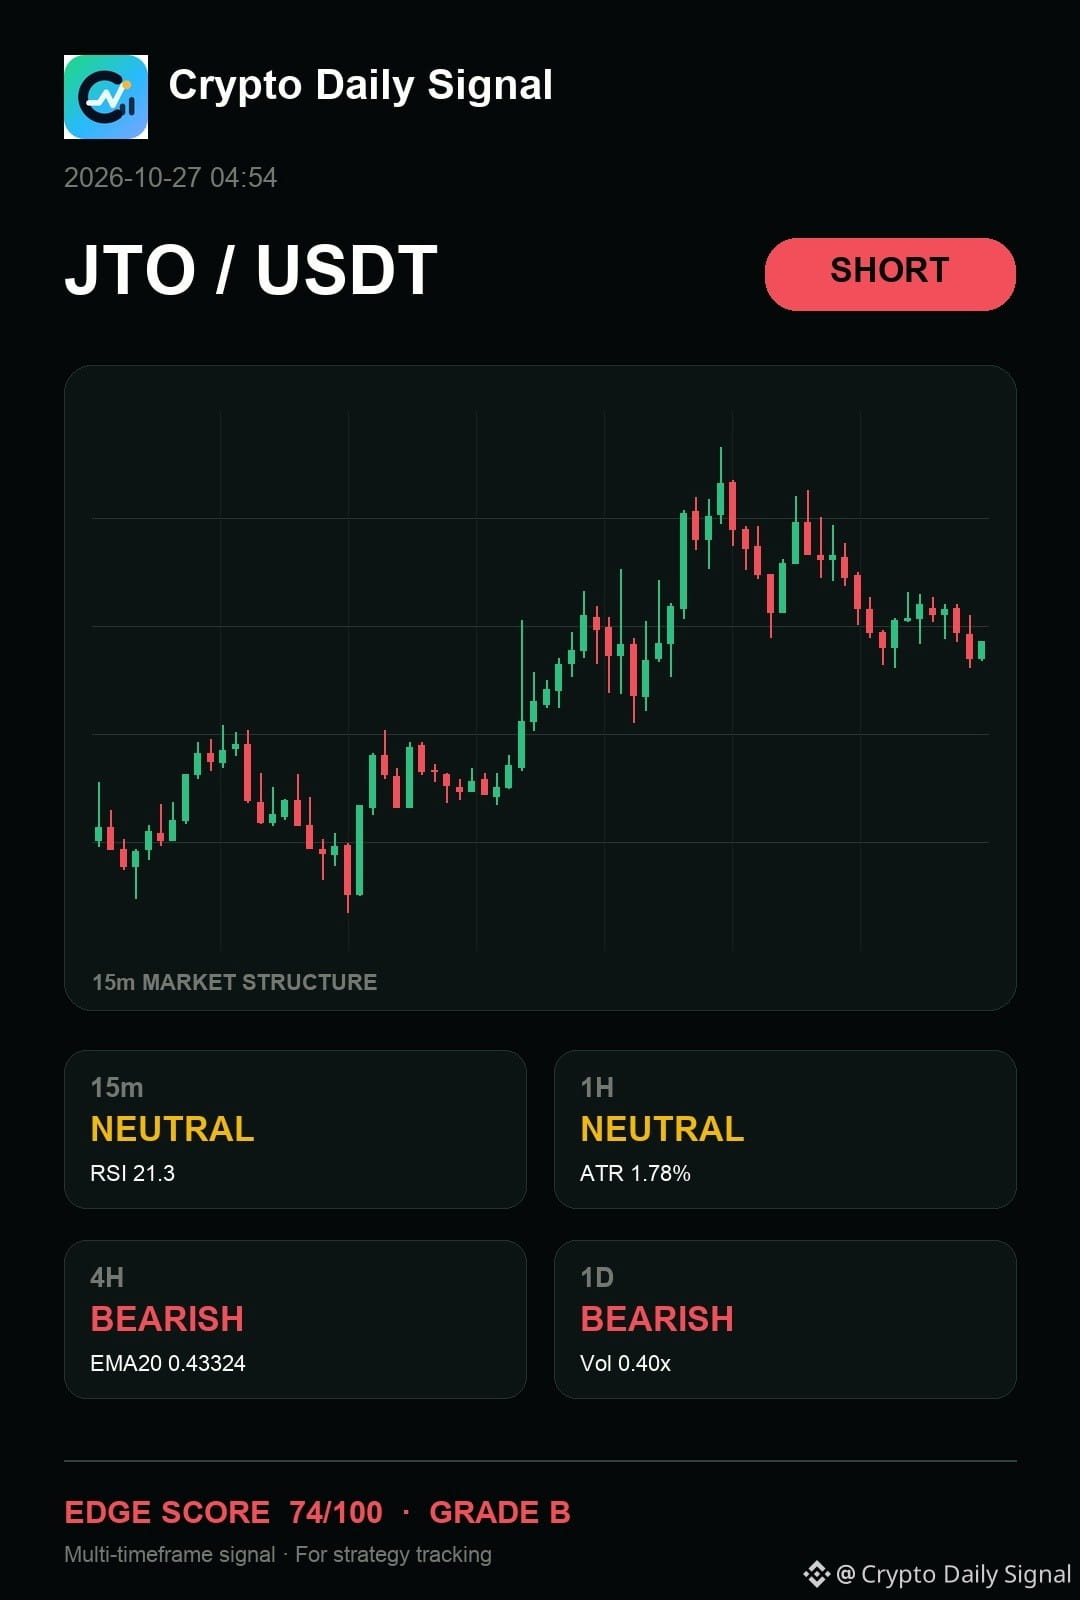
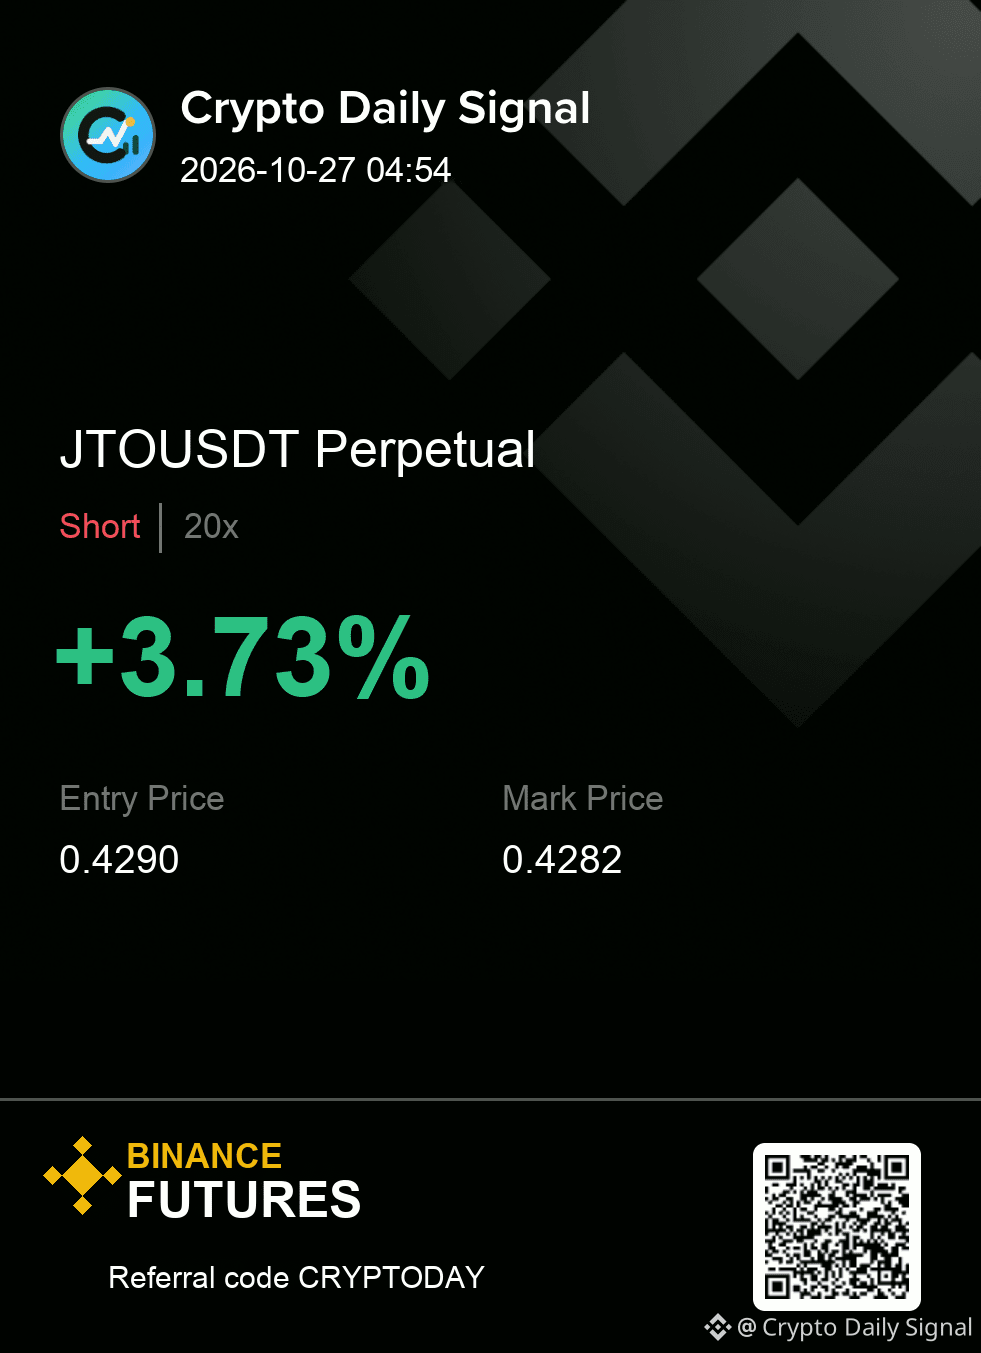
$JTO needs confirmation before I press the short. The action is tight, stuck between recent highs and lows, but the higher-timeframe view remains weighted to the downside. Watching for a solid break out and below the range floor would give the downside bias a real boost.
Trade Plan — JTOUSDT SHORT
Entry: 0.4281 - 0.4299
Stop Loss: 0.4323
TP1: 0.4257 | TP2: 0.4230 | TP3: 0.4197
What would you need to see before putting risk behind this idea?
#TradingSignal
{future}(JTOUSDT)
$JTO needs confirmation before I press the short. The action is tight, stuck between recent highs and lows, but the higher-timeframe view remains weighted to the downside. Watching for a solid break out and below the range floor would give the downside bias a real boost.
Trade Plan — JTOUSDT SHORT
Entry: 0.4281 - 0.4299
Stop Loss: 0.4323
TP1: 0.4257 | TP2: 0.4230 | TP3: 0.4197
What would you need to see before putting risk behind this idea?
#TradingSignal
Trade Plan — JTOUSDT SHORT
Entry: 0.4281 - 0.4299
Stop Loss: 0.4323
TP1: 0.4257 | TP2: 0.4230 | TP3: 0.4197
What would you need to see before putting risk behind this idea?
#TradingSignal
24
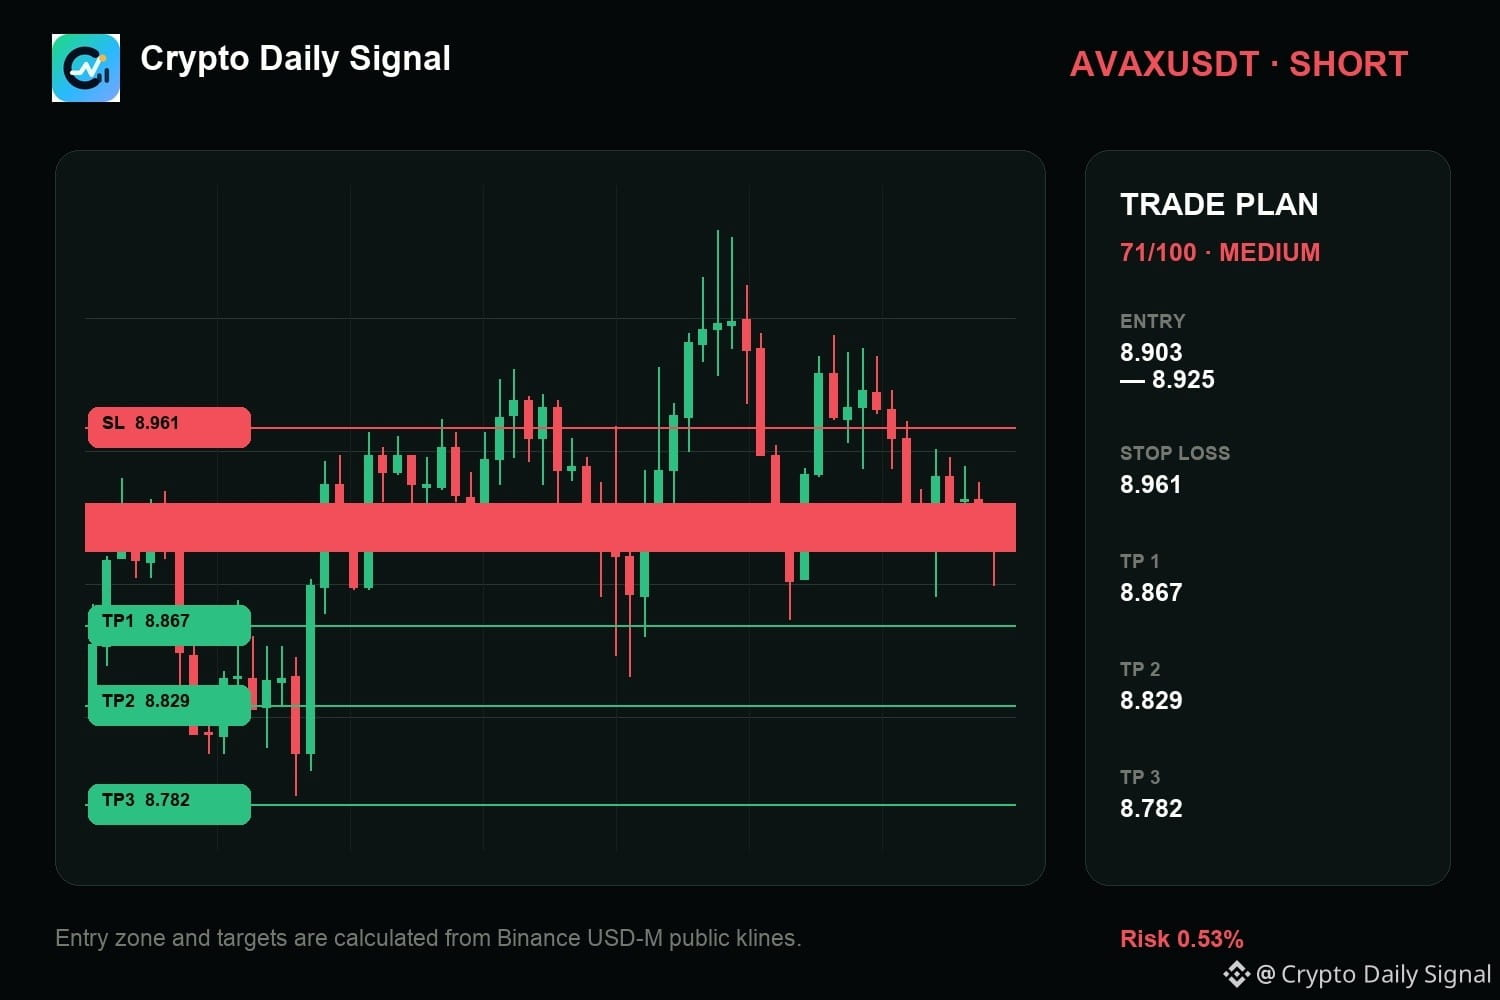
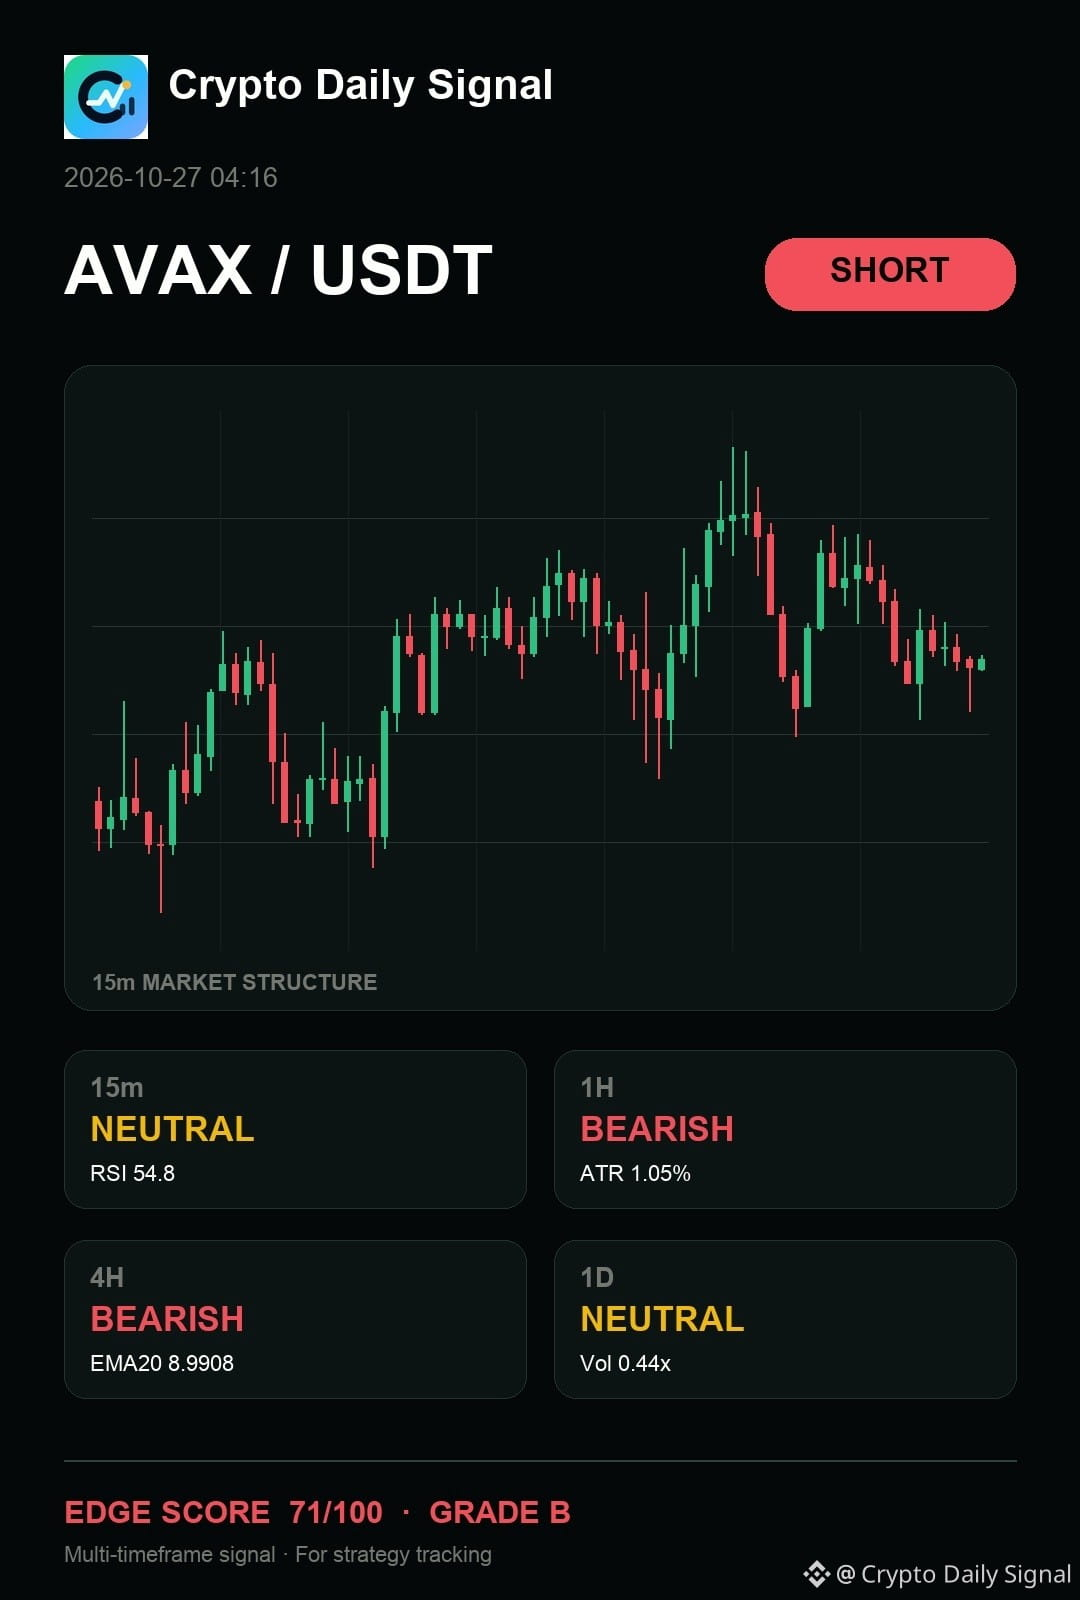
$AVAX is still tilted toward sellers as the price stays tucked inside a clear descending channel. Bearish indications hold on the hourly and four-hour views, even though short-term momentum is balanced. A close under the consolidation's recent low would strengthen this bearish take.
A clean invalidation ends the thesis — no averaging into it.
AVAXUSDT SHORT
IN 8.903 - 8.925
OUT 8.961
TP 8.867 · 8.829 · 8.782
#TradingSignal
{future}(AVAXUSDT)
$AVAX is still tilted toward sellers as the price stays tucked inside a clear descending channel. Bearish indications hold on the hourly and four-hour views, even though short-term momentum is balanced. A close under the consolidation's recent low would strengthen this bearish take.
A clean invalidation ends the thesis — no averaging into it.
AVAXUSDT SHORT
IN 8.903 - 8.925
OUT 8.961
TP 8.867 · 8.829 · 8.782
#TradingSignal
A clean invalidation ends the thesis — no averaging into it.
AVAXUSDT SHORT
IN 8.903 - 8.925
OUT 8.961
TP 8.867 · 8.829 · 8.782
#TradingSignal
10
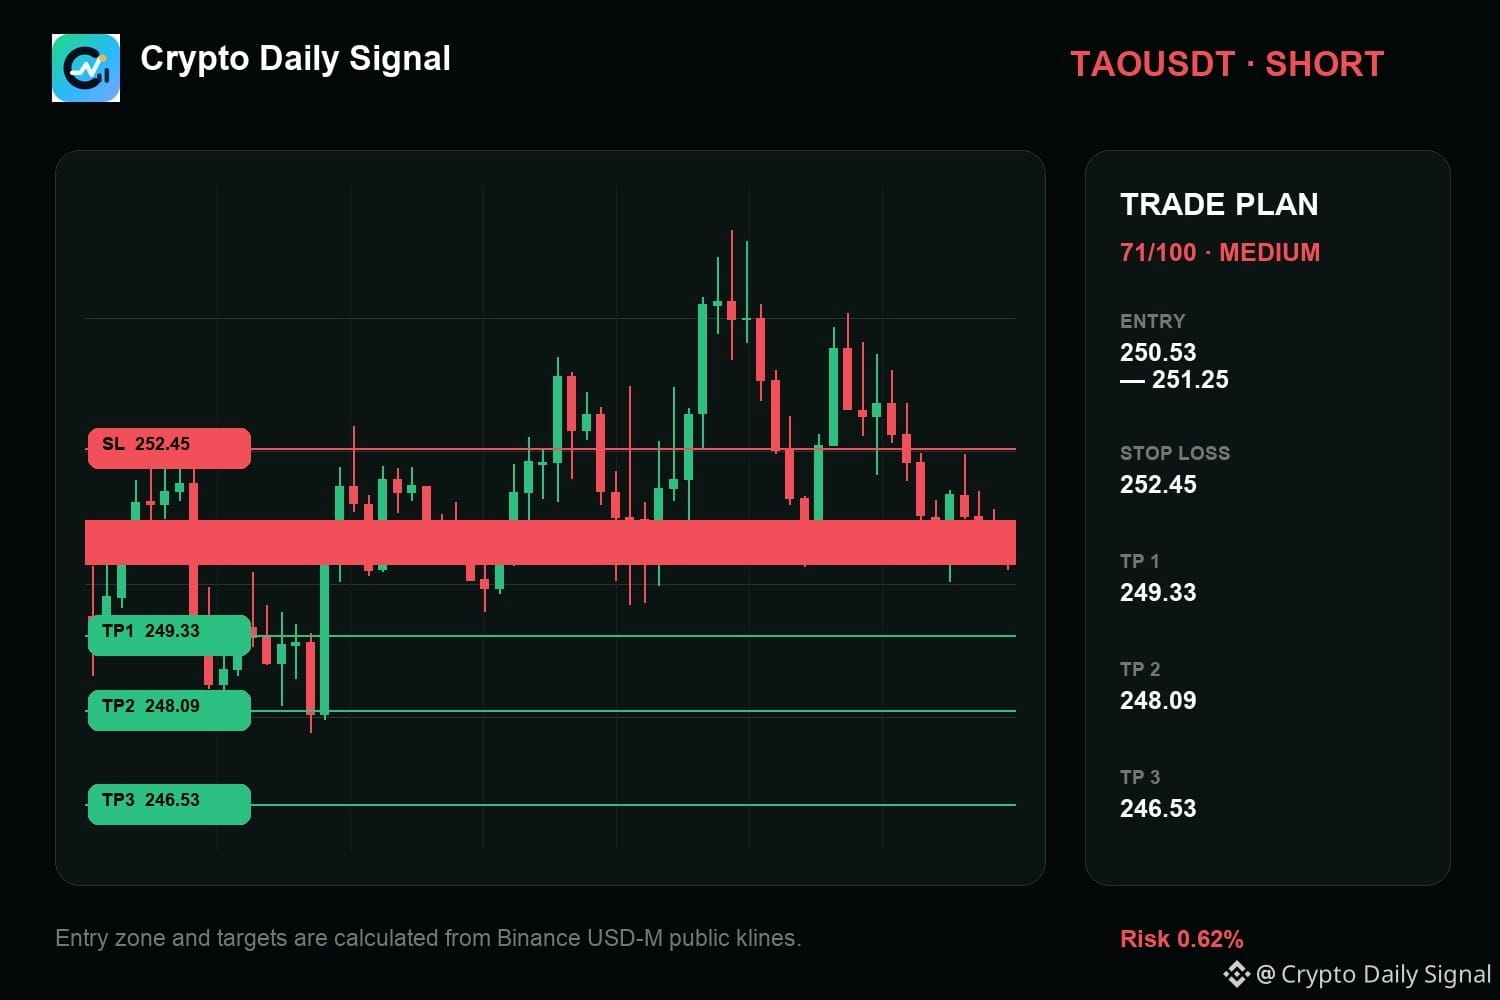
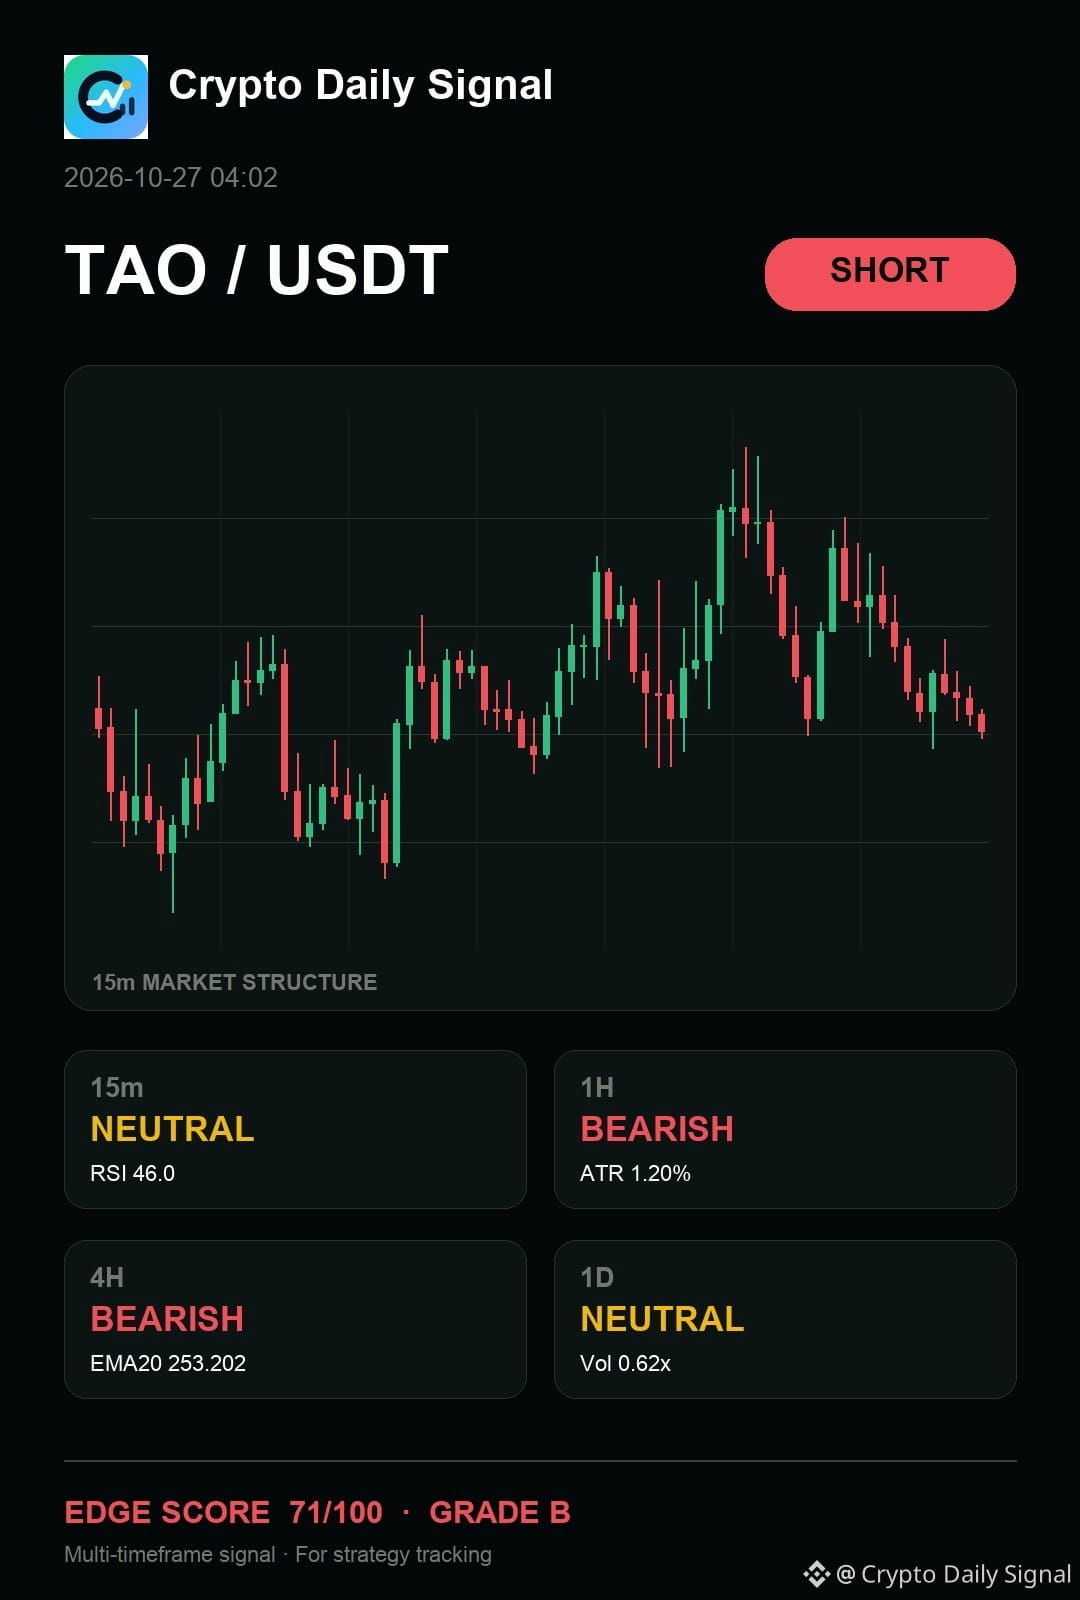
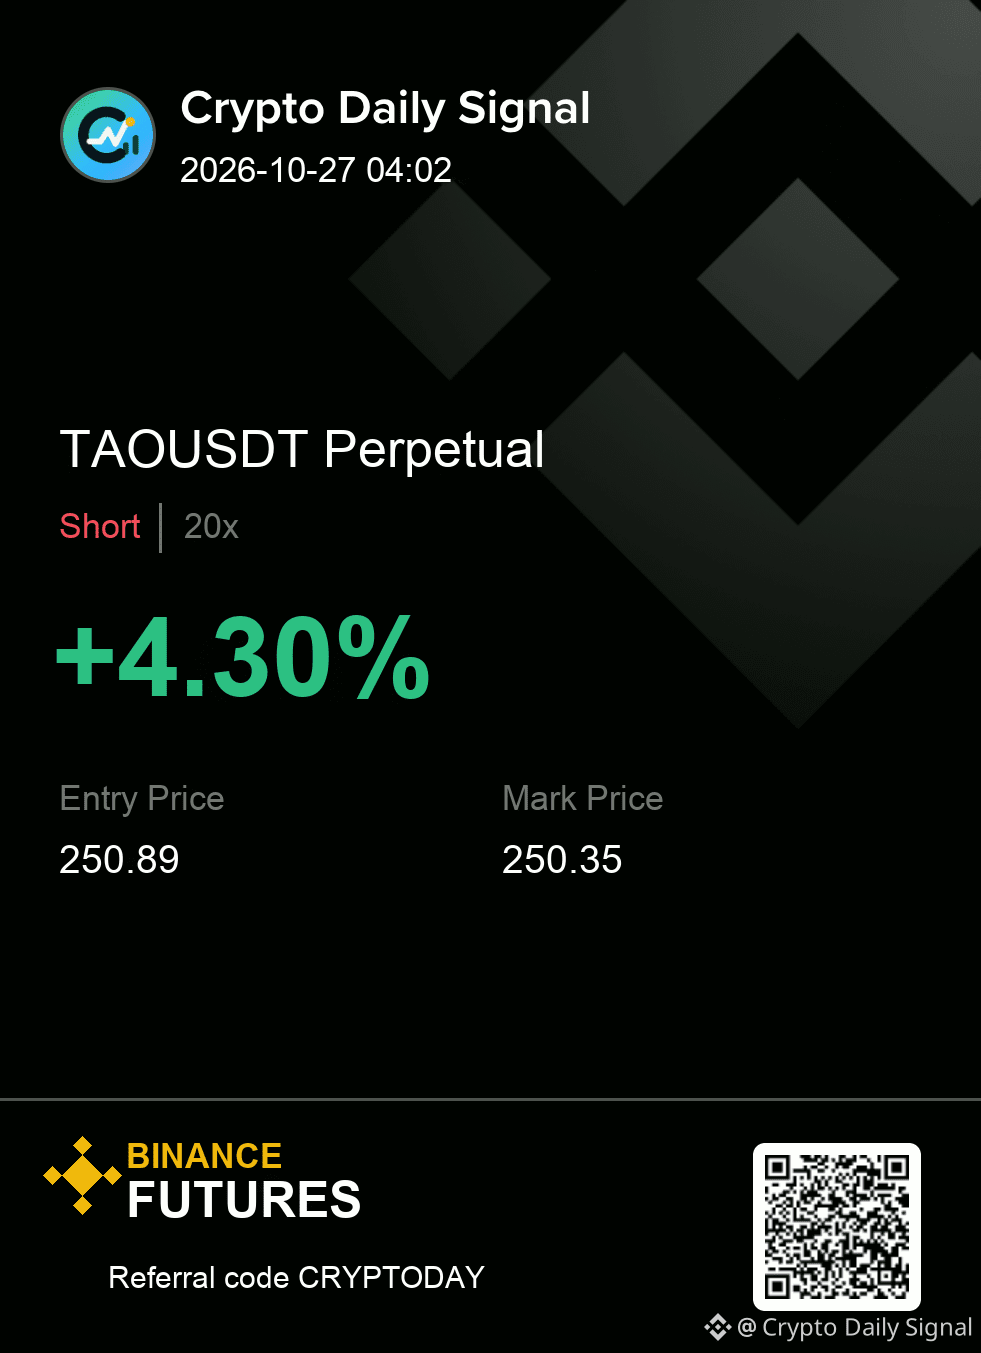
$TAO — the way I see this move, it keeps the short case alive. The daily read is neutral, with the four-hour view still bearish. I care more about the reaction at the planned zone than the first burst away from it. Break the invalidation and there is nothing left to defend.
TAOUSDT SHORT
IN 250.53 - 251.25
OUT 252.45
TP 249.33 · 248.09 · 246.53
Clean enough to execute, or still too early for you?
#TradingSignal
{future}(TAOUSDT)
$TAO — the way I see this move, it keeps the short case alive. The daily read is neutral, with the four-hour view still bearish. I care more about the reaction at the planned zone than the first burst away from it. Break the invalidation and there is nothing left to defend.
TAOUSDT SHORT
IN 250.53 - 251.25
OUT 252.45
TP 249.33 · 248.09 · 246.53
Clean enough to execute, or still too early for you?
#TradingSignal
TAOUSDT SHORT
IN 250.53 - 251.25
OUT 252.45
TP 249.33 · 248.09 · 246.53
Clean enough to execute, or still too early for you?
#TradingSignal
10
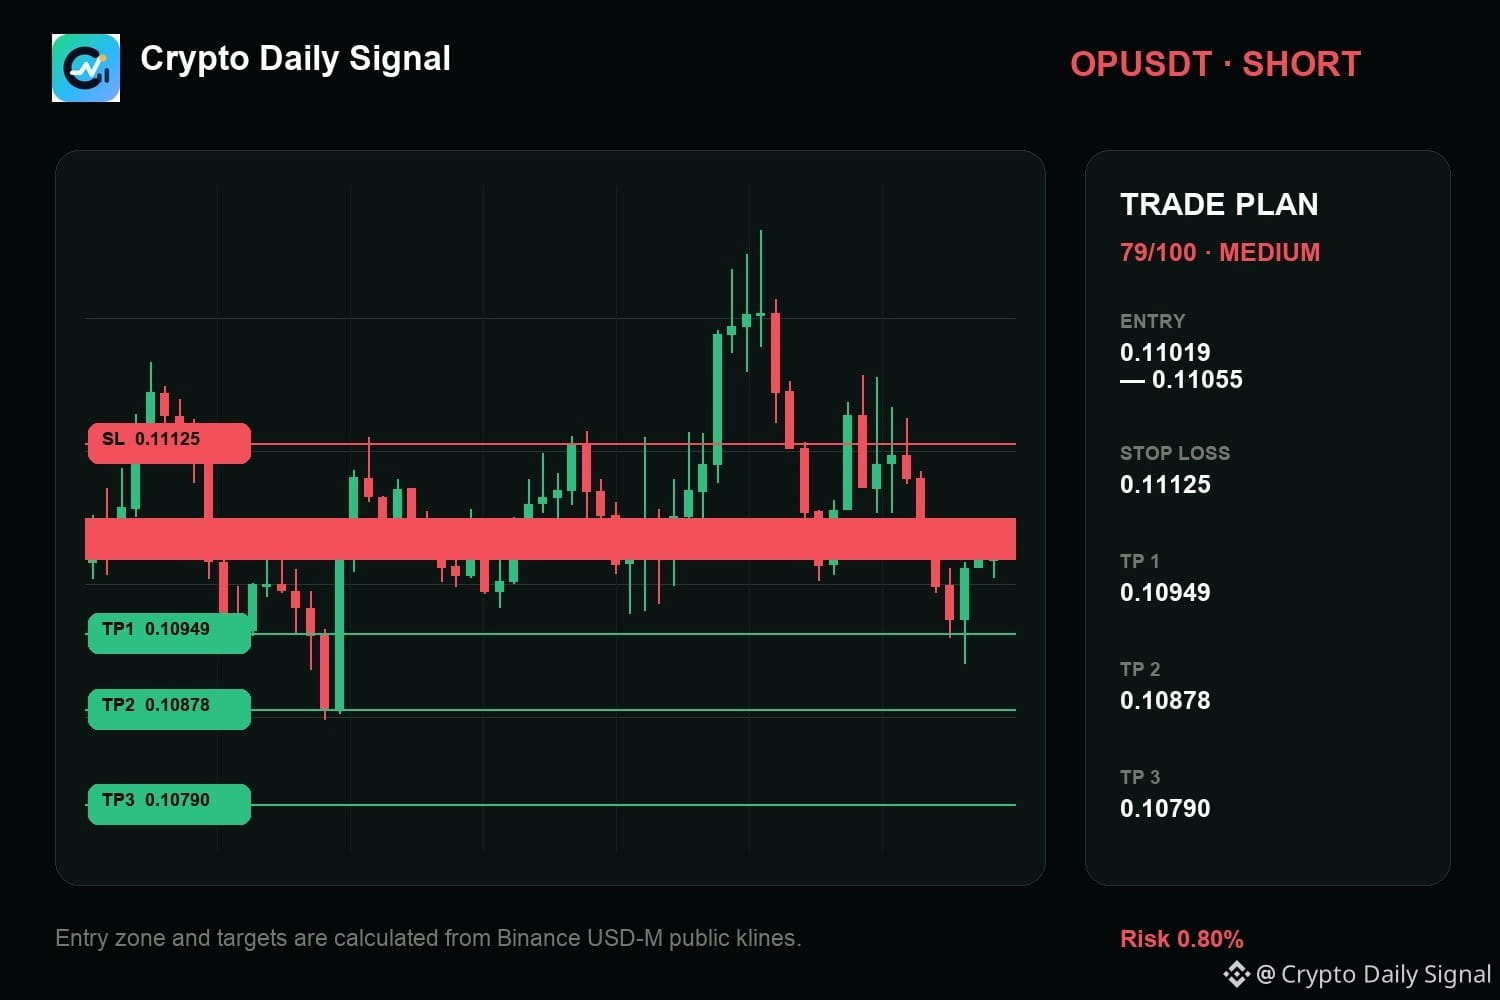
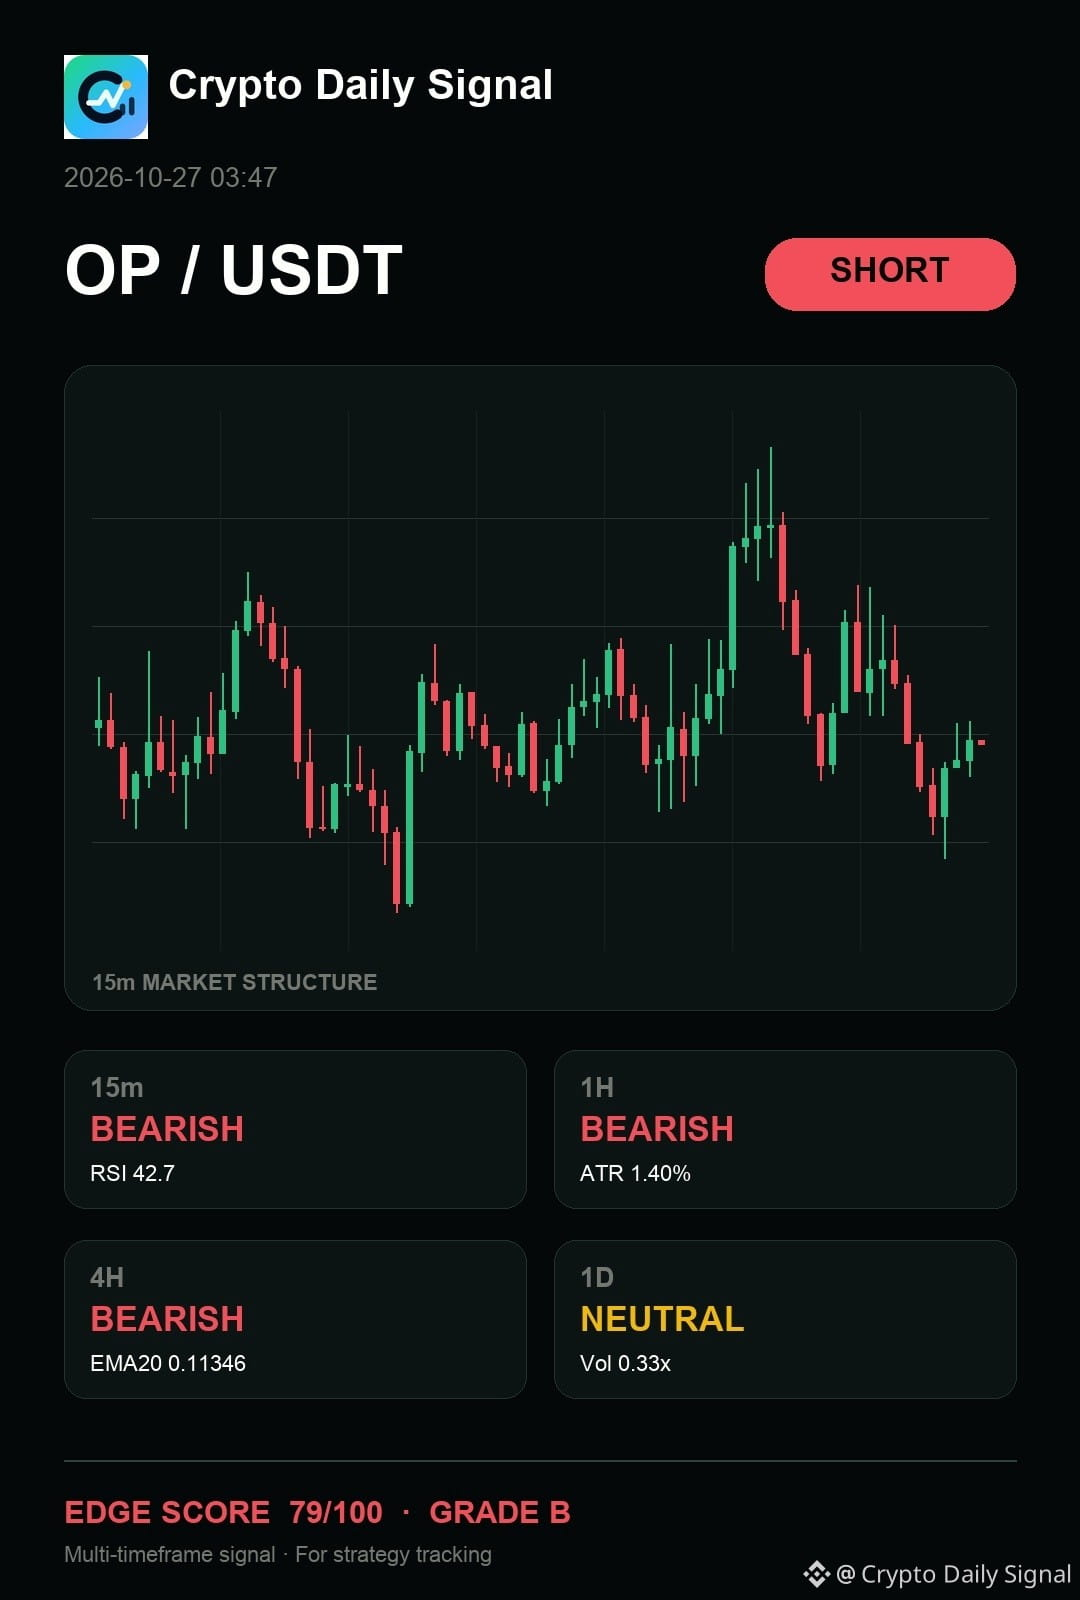
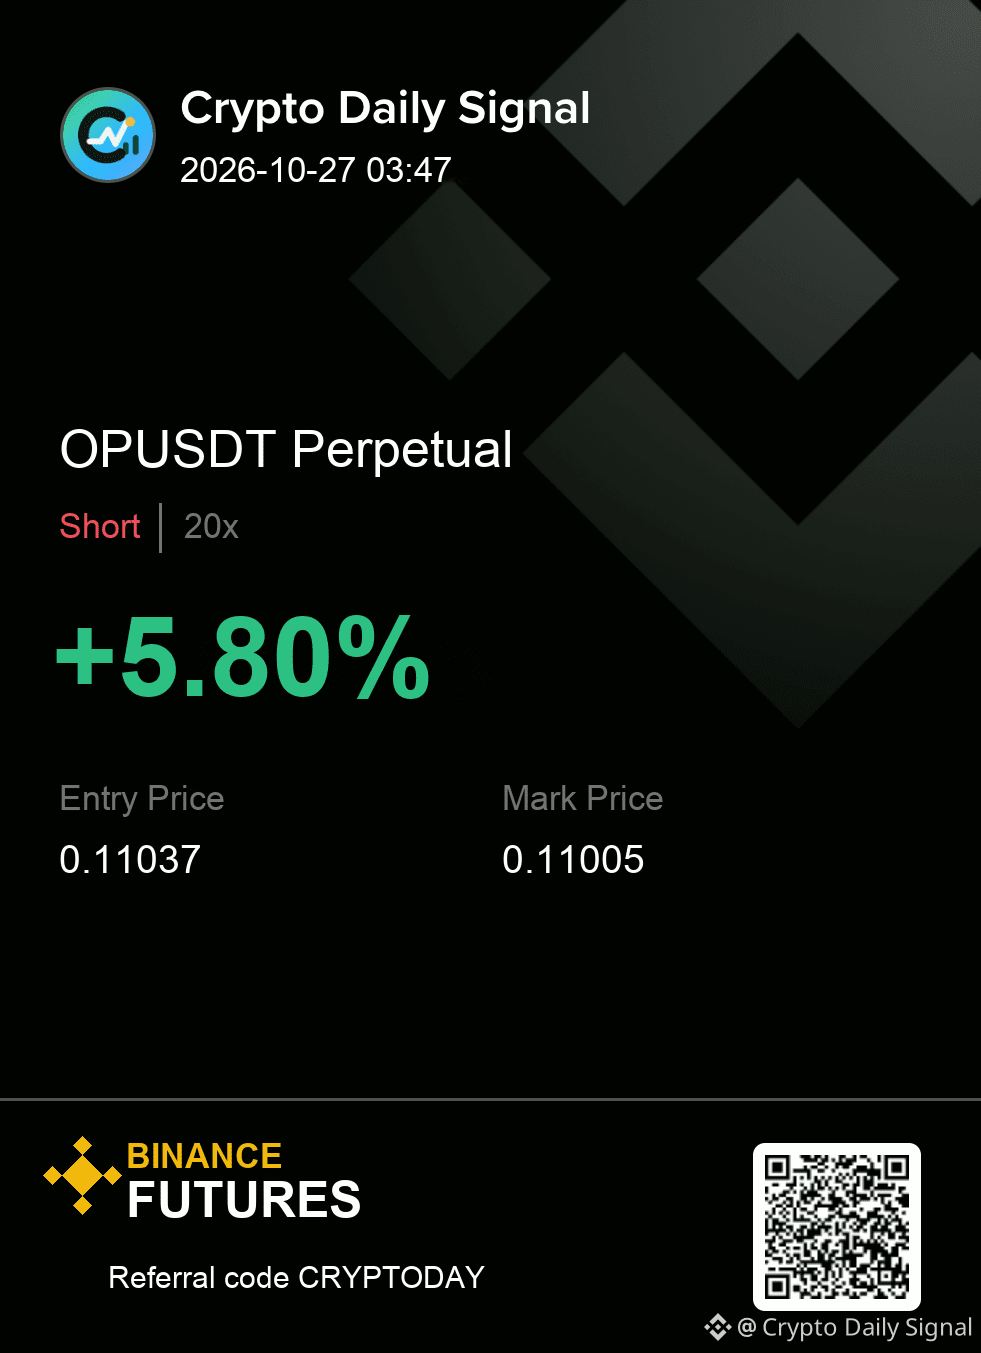
$OP — my two cents, I am reading it like it remains a short idea for me. The daily picture is neutral and the four-hour structure is bearish. I want the entry zone to hold before committing; a clean break through the risk line kills the idea. No need to chase the first candle.
Levels — OPUSDT
Zone: 0.11019 - 0.11055
Cut: 0.11125
Scale: 0.10949 | 0.10878 | 0.10790
#TradingSignal
{future}(OPUSDT)
$OP — my two cents, I am reading it like it remains a short idea for me. The daily picture is neutral and the four-hour structure is bearish. I want the entry zone to hold before committing; a clean break through the risk line kills the idea. No need to chase the first candle.
Levels — OPUSDT
Zone: 0.11019 - 0.11055
Cut: 0.11125
Scale: 0.10949 | 0.10878 | 0.10790
#TradingSignal
Levels — OPUSDT
Zone: 0.11019 - 0.11055
Cut: 0.11125
Scale: 0.10949 | 0.10878 | 0.10790
#TradingSignal
7
Log in to explore more content
Join global crypto users on Binance Square
⚡️ Get latest and useful information about crypto.
💬 Trusted by the world’s largest crypto exchange.
👍 Discover real insights from verified creators.
Email / Phone number
Trending Topics
1
#BinancePick
3.4M views
165,648 Discussing
2
#EarningsSeason
5.5M views
27,001 Discussing
3
#StrategySkipsBitcoinPurchasesSpends$205MOnSTRCBuybacks
1,040 views
37 Discussing
4
#BitmineAdds10452ETH
12,628 views
295 Discussing
5
#SouthKoreaConsidersEducationTaxOnCryptoExchanges
10,209 views
261 Discussing
6
#OCCUrgesCommunityBanksToEnterStablecoinPayments
9,504 views
160 Discussing
7
#RippleWinsFullApprovalAsNationalTrustBank
8,173 views
168 Discussing
8
#AkashSelectsSolanaAsMigrationTarget
6,154 views
87 Discussing
9
#OndoToOpenSubscriptionsForOpenAIPreIPOTokenizedNotes
387 views
19 Discussing
10
#AnthropicTTMRevenueGrewAbout1200%
61,965 views
611 Discussing