Question: After a $500 million market liquidation, where will BTC and ETH's market trend go?
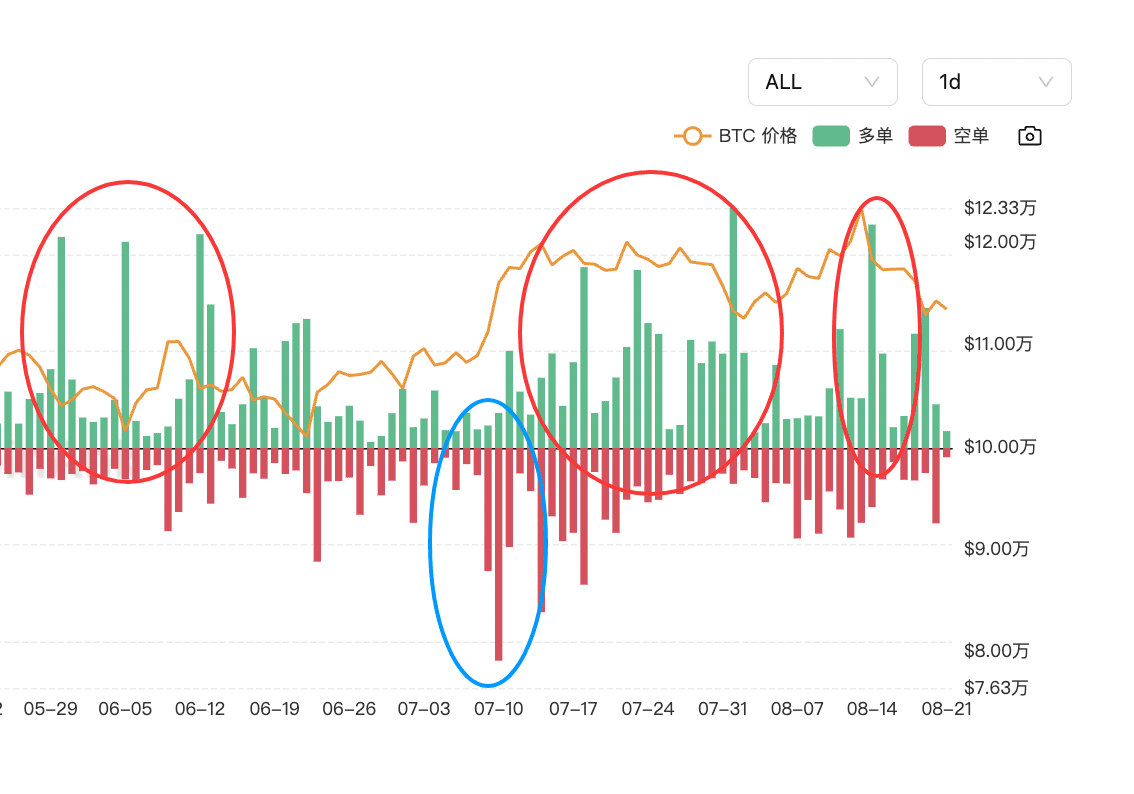
This question mentioned a liquidation scale of $500 million, which is the data from August 14 when Bitcoin peaked and then dropped significantly in 24 hours. I checked some tool applications, and different tools may show slightly different results. The mainstream data is $584 million; a scale over $500 million is considered relatively large. However, when the market dropped sharply on August 1, a similar scale of liquidation occurred. More recently, on July 23 and July 18, there were similar scales of liquidation as well. In fact, this happens several times each month.
In addition, according to the historical highs we have seen recently, the scale of contract holdings has reached a historical peak, often around $70-80 billion. The amount of liquidations isn't too much actually; I personally estimate that more of it is from high-leverage players chasing the rally at the top, who would get liquidated.
In this round of liquidations, long positions in ETH accounted for nearly 50%, which is quite rare. This is also a normal cleanup after overheating in leverage and does not count as a systemic risk outbreak. After similar historical liquidation events, the market has generally recovered its losses within 13 weeks. As I mentioned earlier, there are always a few days each month like this; haha, I used to say this is like a 'monthly period.'
Regarding liquidations, I won't go off-topic here; let's mainly discuss the trend analysis of BTC and ETH. Of course, this is just my personal opinion, for reference only. I believe the market was too crazy for a while; this round is just a normal adjustment. The market is under short-term pressure, but there is a lot of support below. BTC may continue to pull back and then consolidate, while the pullback space for ETH will depend on whether institutions continue to speculate on accumulating Ethereum and strategic reserve treasury narratives, and whether the Ethereum being staked will continue to queue for exit and the scale involved.
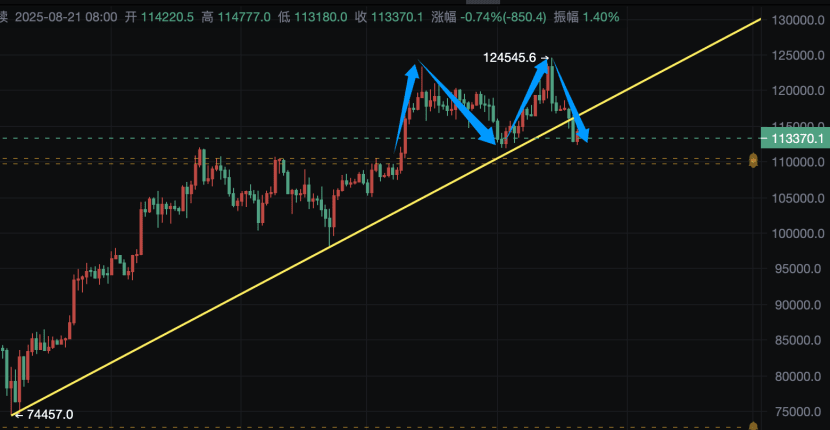
Let's also discuss the technical aspects. BTC has a potential 'double top' pattern, or a daily level 2B top, and this round of market broke below the ascending trend line since the April low of $75,000. If this 2B top is established and effectively breaks below $111,850, it may drop by an equivalent height of one time, which I roughly calculate to be a drop of $12,624 from $111,850, landing at around $99,226. Considering the price differences between different platforms and spot contracts, it will be in the range of $99,000 to $100,000. This calculation suggests a pullback of about 20%, which is not large compared to the previous several pullbacks of around 32-33% in this bull market. If we also reference the maximum pullback of 33.58% since the end of 2022 in this bull market, the lowest point of this pullback may need to drop to around $82,850.
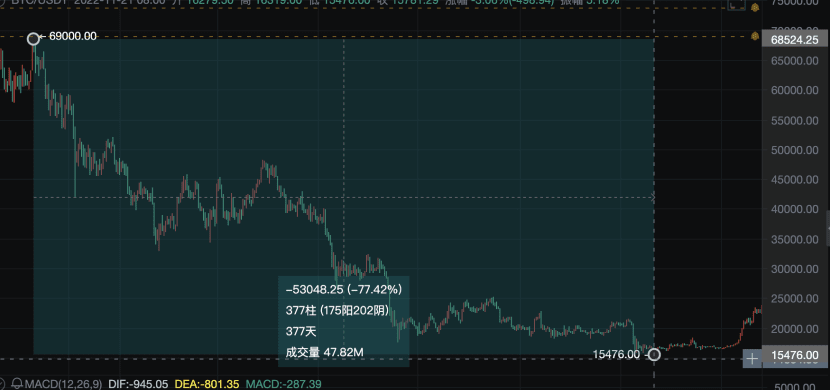
However, we also need to consider the possibility of the end of the bull market, which could lead to larger drops in the future. For example, referencing previous bear markets, the drop after the peak in 2021 was 77.42%; the drop after the peak in 2019 was around 73%; and the drop after the peak in 2017 was around 84%. Calculating like this, in the long term, it may eventually drop to $33,500 or even $20,000, which may be far below the current mining costs. At an electricity price of $0.05, the mining costs for mainstream mining machines are around $40,000 to $60,000, which is also a very strong support level. Currently, the coin price is still at $110,000 to $120,000, at a historical high. My long-term view may sound a bit alarming, and this is not a process that happens overnight, so I won't elaborate too much on it. Moreover, this round of ETF and institutional narratives has stronger support than previous bull markets, with the maximum pullback being only about 33.58%, so for now, there's no need to be overly concerned.
Of course, if $111,850 can hold this time and does not form a daily top pattern, it may continue to maintain a high-level consolidation in the medium-short term. Even if it breaks down, $100,000 is a key psychological level, and $90,000 has strong support, forming a liquidity dense area. The probability of a mid-term breakdown is also relatively low.
On the macro front, BTC is increasingly becoming 'American stock-like.' The expectation of interest rate cuts by the Federal Reserve and the inflow of institutional ETF funds have formed a 'supply-demand imbalance' pattern, which can also hedge against short-term selling pressure. However, if the U.S. stock market peaks this time, Bitcoin may also be affected and drop together.
Moreover, ETH has an independent market foundation this time. Although the liquidation scale is relatively large, the narrative of institutional accumulation and strategic reserve treasury plans for ETH this time has resulted in a pullback that is significantly lower than historical levels. Using Bitcoin as a reference, this round of BTC pulled back about 10%, while ETH, considering yesterday's rebound, has also only pulled back about 10%. In the past, a 10% pullback in BTC might have seen ETH pull back by more than 20%.
Therefore, in the medium-short term, the market is in a healthy adjustment cycle. There is no need to worry too much as long as there is no major pattern breakdown and no change in macro conditions.
Let's look at this question again: Why did ETH perform strongly during the market pullback? Is it a flash in the pan, or does it have unlimited potential?
The front has taken too long, so let's briefly talk about why ETH rebounded strongly after the pullback this time. In fact, if we pay attention to news and data every day, we can easily find the answer.
For example, the ETH holdings of 69 Ethereum treasury companies have exceeded 4 million, and the market value of the top three companies' ETH holdings exceeds $10 billion. These institutions' strategic reserve treasury plans are not expected to sell in the short term, continuously providing momentum for ETH.
For example, ETF fund flow data shows that in September, the proportion of Ethereum ETF holdings will exceed that of Bitcoin ETF. Recently, the inflow of spot Ethereum ETF funds has been strong, with a continuous net increase of $3.1 billion over seven days, accounting for 10% of its historical total inflow, highlighting the increased market enthusiasm. Additionally, recently, ETH has attracted $2.3 billion in the market, pushing the cumulative inflow this year to over $10.5 billion.
On-chain data shows that U.S. spot Ethereum ETFs hold 6.3 million ETH, worth about $26.7 billion in on-chain assets, accounting for 5.1% of Ethereum's current total supply.
Also, regarding the ratio of Ethereum to Bitcoin, I don't know if everyone usually pays attention to the exchange rate between the two, that is, ETH/BTC has now reached a new high since the end of 2024. Previously, I often focused on the exchange rate between the two. Since the peak of the bull market at the end of 2021, ETH has actually been on a downward trend relative to BTC. Starting from April this year, the exchange rate between the two has rebounded significantly from a low of 0.001766, with a substantial rise and a long duration, which has not been seen before. This is also the most intuitive indicator of the strength of the two, the Matthew effect, where the strong get stronger. Therefore, after this round of market downturn, ETH's rebound is also quite strong.
By the way, I saw a couple of days ago that the scale of ETH waiting to exit staking is decreasing, which also reduces the possibility of increased market circulation and selling pressure. Additionally, the ETF institutional holdings have caused the annualized deflation rate of ETH to exceed 3%, combined with the on-chain burning mechanism, resulting in a continuous contraction of actual circulation, forming a rigid price support. Stablecoin issuance is 60% based on the ETH chain, and the daily average settlement volume exceeds Bitcoin by three times, supporting the coin price with real demand.
The Ethereum Foundation has been very active recently with technical iterations, and the recent influence of Vitalik Buterin, along with the favorable statements from the U.S. regarding Ethereum's regulatory environment, have all promoted the strong performance of ETH this time. Therefore, I remain very optimistic about Ethereum's future potential.
Alright, let's stop here for today. Thank you, everyone.

