The recent market situation has made many players anxious, but from the overall trend, the market's development does not seem to have deviated from expectations. Since April 16, Bitcoin's performance has almost perfectly matched the 'three-line convergence' model: when the red line starts to decline in sync with the blue and green lines, Bitcoin quickly enters a correction phase after reaching a new high. Just before that, Ethereum's strong performance had already boosted market sentiment, and the turning point came unexpectedly.
However, this anxiety may soon be alleviated. According to the model, from August 22 to September 7, the blue line and green line will show asynchronous movements. According to the pattern, the red line is likely to be positioned between the two lines at this time. Currently, the red line is running close to the green line, which means it is more likely to gradually rise in the near future rather than continue to decline.
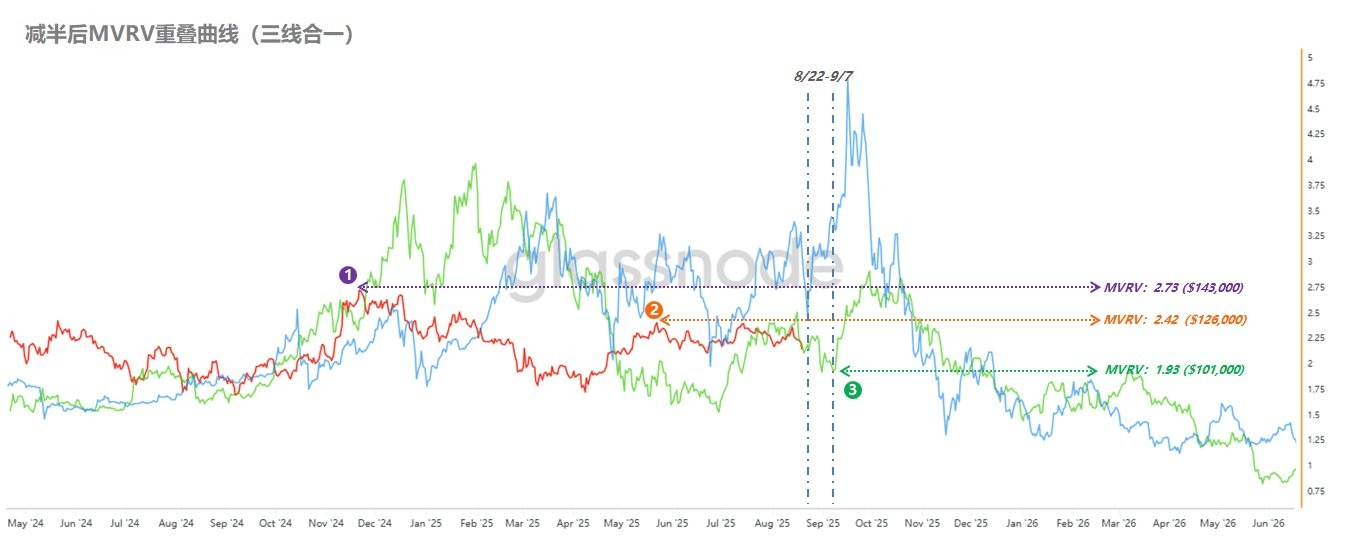
It is important to note that the long-term divergence of the MVRV indicator is still at play. The main resistance level above remains at MVRV=2.42, corresponding to a price of about $126,000. Only by breaking through this threshold can Bitcoin hope to further challenge higher ranges (purple dashed line position).
The most pessimistic scenario is that the red line continues to follow the green line downward, reaching around MVRV=1.93 before September 7, which corresponds to about $101,000. However, from a probabilistic perspective, unless there is a significant macroeconomic negative factor, the likelihood of dropping to this level is extremely low.
(Figure 1)
In summary, although the current market has experienced a correction, if we look at the trend patterns and indicator positions, the adjustment may have already entered its final stages.
