In the options market, the flow of premiums often reveals traders' true intentions more than prices do. By executing a net premium heatmap, we can clearly see the distribution and attitudes of both bulls and bears in different ranges, which essentially serves as a 'market expectation map.'
Different colors represent completely opposite funding behaviors:
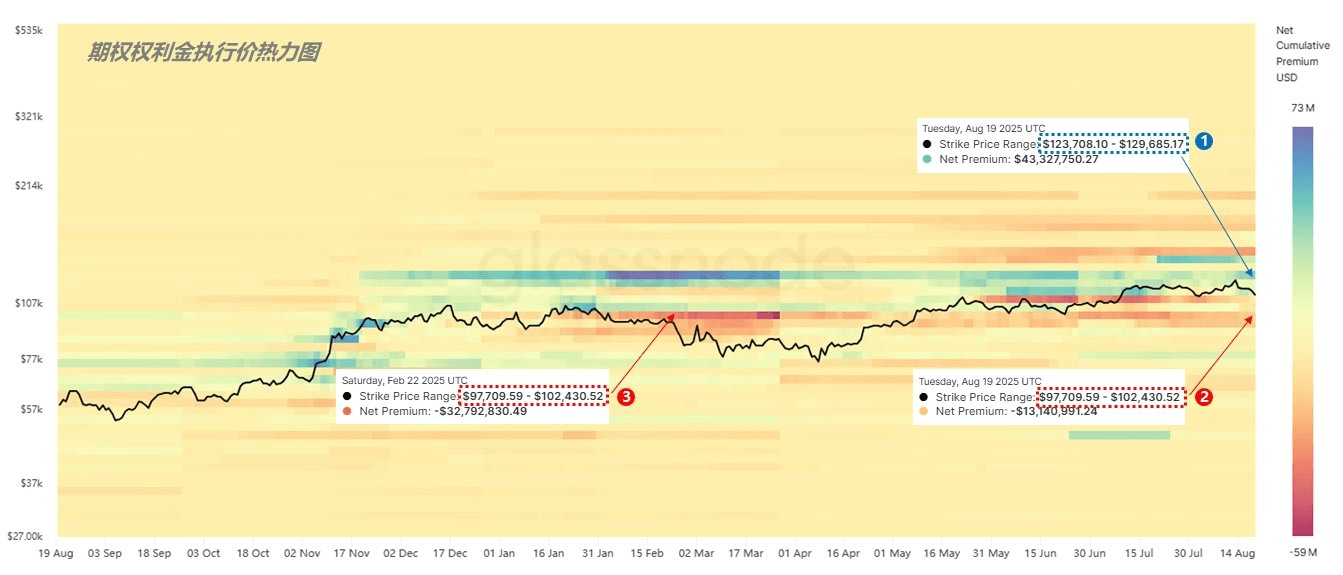
Blue/Green indicates net buying, showing that funds are more willing to pay premiums for protection against upward or downward movements;
Orange/Red indicates net selling, meaning that market participants choose to collect premiums, expressing a judgment that there is limited room for upward or downward movement.
(Figure 1)
From the data on August 19, in the $123,708 - $129,685 strike range, the capital flow for call options was significantly concentrated, with a cumulative amount of about $43.32 million. This indicates that major funds still tend to bet on Bitcoin's potential upward breakout, while buying for downside protection has almost disappeared.
At the same time, in the range of $97,709 - $102,430, there were about $13.14 million in sell options. This layout sends a signal: the market generally believes that Bitcoin is unlikely to fall below this range, with the maximum volatility likely not exceeding 20%.
Overall, the signals given by the options market are relatively optimistic: bullish targets point directly to the $124,000 range, while sellers indicate that the market bottom has gradually stabilized around $102,000. It is worth mentioning that in the previous round of correction, this price range was a key point where sellers bet on 'difficult to rise', but now it is seen as 'difficult to break below', showing a clear shift in sentiment and perception.#比特币
