Stock Top Escaping Skills:
When the K-line chart shows the following patterns, investors can escape the top: long upper shadow at high positions, bearish engulfing at high positions, dark cloud cover, hanging man at high positions, doji at high positions, dead spider pattern, M-head, head and shoulders top, etc. Additionally, technical indicators crossing downwards and top divergence indicate a peak.
Bottom Picking Skills:
When the stock shows: 'Lotus Out of Water' K-line pattern, low position doji, single needle bottoming pattern, V-shaped reversal, head and shoulders bottom, etc., it can be bottom picked. Additionally, technical indicators golden cross and bottom divergence indicate a bottom, allowing for appropriate buying.
Today's shared Tongda Xinyi top and bottom exclusive indicator formula is an indicator formula that analyzes stock bottom picking and top escaping signals.
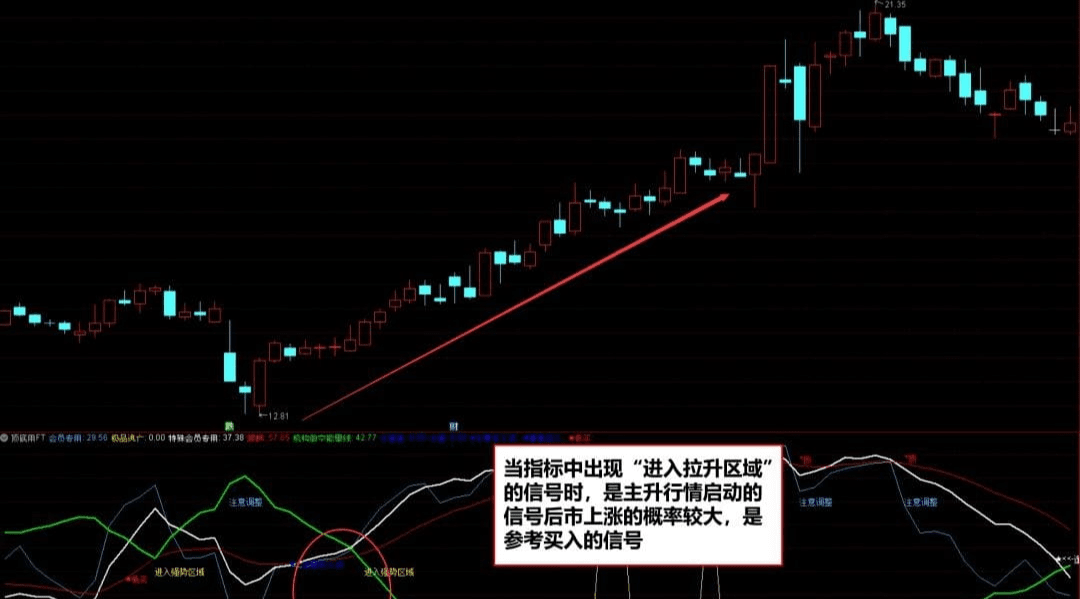
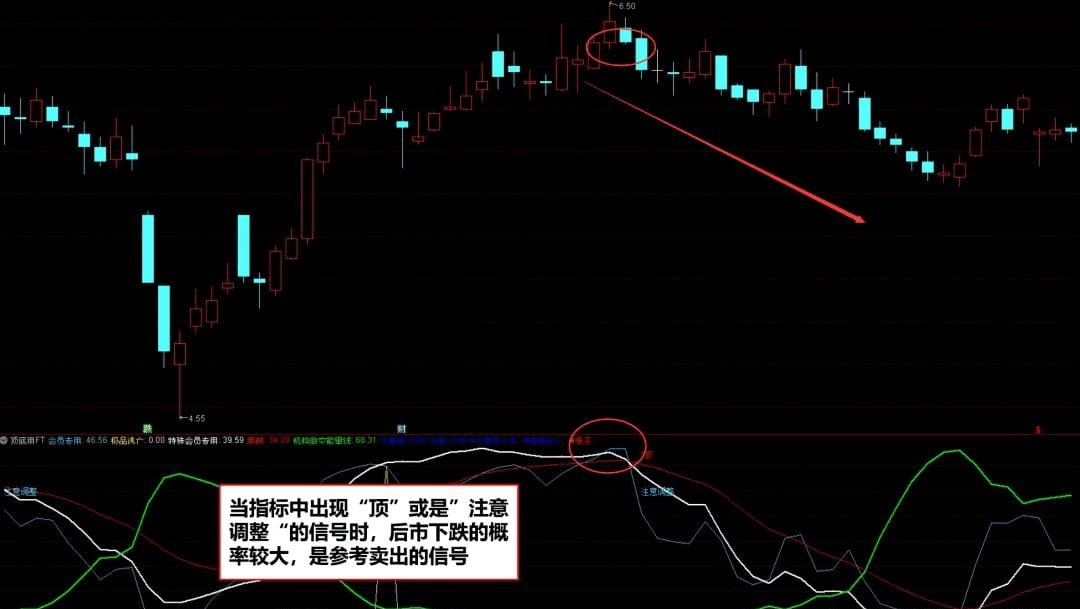
Specific Signal Explanation:
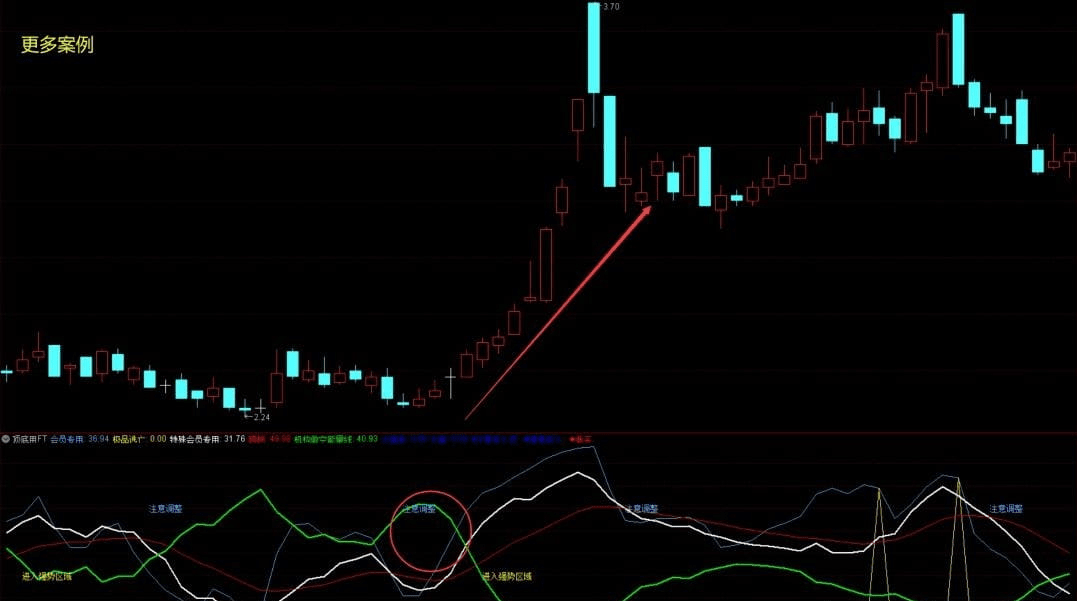
When the signal 'Entering the Rising Area' appears in the indicators, it indicates the start of a main rising trend, and the probability of future price increases is high, serving as a reference buy signal.
When the signal 'Top' or 'Note Adjustment' appears in the indicators, the probability of future price declines is high, serving as a reference sell signal.
VAR1:=REF(CLOSE,2);
Member Exclusive: SMA(MAX(CLOSE-VAR1,0),7,1)/SMA(ABS(CLOSE-VAR1),7,1)*100,COLORFFAA66;
VAR2:=REF(CLOSE,1);
VAR3:=SMA(MAX(CLOSE-VAR2,0),7,1)/SMA(ABS(CLOSE-VAR2),7,1)*100;
Ultimate Escape: IF(Member Exclusive< REF(Member Exclusive,1) AND Member Exclusive > 79,Member Exclusive,0);
DRAWTEXT(Ultimate Escape ,70 ,'★<-Ultimate Escape'),COLORYELLOW,LINETHICK1;
DRAWTEXT(88 > 0 AND REF(O,1)/REF(C,1) > 1.04 AND REF(L,1)<=688 AND O > REF(C,1) AND C=1.01,L-L*0.02,'★<--Ultimate Bottom Initial Appearance'),LINETHICK1;
DRAWTEXT(C-O >= 0 AND O/L > 1.05 AND L<=LLV(L,20),L,'★<--Ultimate Bottom'),COLORBLUE, LINETHICK1;
Q2:=(CLOSE-LLV(LOW, 18))/(HHV(HIGH, 18)-LLV(LOW, 18))*100;
Q3:=SMA(Q2, 9, 1);
Q4:=SMA(Q3, 3, 1);
Special Member Exclusive:3*Q3-2*Q4,COLORWHITE,LINETHICK2;
Q8:=HHVBARS(HIGH, 50);
Q10:=(CLOSE-REF(OPEN, Q8))/REF(OPEN, Q8)*100;
Crossing:EMA(Q3, 3),COLORRED;
DRAWTEXT(CROSS(Special Member Exclusive, 8) AND Q10<-13,20,'*Big Bottom Coming'),COLORYELLOW,LINETHICK5;
DRAWTEXT(CROSS(Special Member Exclusive, 93) AND Q10<-13,40,'*Big Bottom'),LINETHICK5;
DRAWTEXT(CROSS(Crossing, Special Member Exclusive) AND REF(Special Member Exclusive,1) > 80, REF(Special Member Exclusive,3), '*Top'),COLORRED,LINETHICK5;
VAR12:=(HHV(HIGH,36)-CLOSE)/(HHV(HIGH,36)-LLV(LOW,36))*100;
Institution Short Selling Energy Line: SMA(VAR12,3,1),COLORGREEN,LINETHICK2;
Big Bottom Coming: 0,POINTDOT;
Big Bottom: 0,POINTDOT;
DRAWTEXT(CROSS(Crossing,Institution Short Selling Energy Line) ,Big Bottom+40,'Entering Strong Area'),COLORYELLOW,LINETHICK1;
DRAWTEXT(CROSS(Special Member Exclusive,Crossing) ,Big Bottom+20,'Entering Rising Area'),LINETHICK1;
DRAWTEXT(CROSS(Crossing,Special Member Exclusive) ,Big Bottom+70,'Note Adjustment'),COLORFFAA66,LINETHICK1;
●Note Buy Point: DRAWTEXT(REF(CROSS(Institution Short Selling Energy Line, Crossing),25) AND Institution Short Selling Energy Line > 1.005*Crossing,Crossing,'●<-Note Buy Point'),COLORBLUE,LINETHICK1;
★Buy on Dips: DRAWTEXT(REF(CROSS(Crossing, Special Member Exclusive),82) AND Crossing > 1.3*Special Member Exclusive,Special Member Exclusive,'★<<-Buy on Dips'),LINETHICK1;
★Buy Low: DRAWTEXT(REF(CROSS(Special Member Exclusive,Crossing),1) AND Special Member Exclusive > 1.3*Crossing,Crossing,'★Buy Low'),COLORRED,LINETHICK1;