Whether you are trading spot or contracts, the most important thing now is to learn swing trading; do not get obsessed with holding onto a coin hoping to earn several times.
There are fewer and fewer such coins now. Among hundreds of coins on exchanges, at most, only one or two may rise 1-3 times.
Whether trading contracts or spot, it is now truly about taking a bite and running; achieving a 10%-30% profit is already quite good.
I know some friends in the circle who are holding onto spot; they are basically down 90%, and it would take a tenfold increase to break even. I can clearly say that this is fundamentally unlikely to recover.
In the future, the cryptocurrency market will also move closer to traditional financial markets, with decreasing volatility; as Tony said, there will be no more dividends.
Wealth comes from just two things: one is large capital, and the other is large volatility.
If you want to improve your swing trading strategy, you will find that technical analysis can provide a solid foundation for better trading decisions. Although there are various technical indicators and tools available in the market, focusing on a few key indicators often significantly enhances your timing judgment and risk management ability. You may have encountered various technical indicators, but knowing which ones to prioritize and how to combine them is often the dividing line between achieving sustainable profits and experiencing a series of losses.
Key Points Overview:
◔ Use the 20-day Exponential Moving Average (20 EMA) as the primary indicator for swing trading, as it provides strong signal strength and reliability for medium-term positions.
◔ Combine readings of RSI above/below 50 with MACD's golden cross or death cross to confirm trend direction and identify high-probability entry opportunities.
◔ Set stop-loss orders based on key support/resistance levels, keeping the risk of each trade within 1%-2% of the total trading capital.
◔ Look for breakout patterns confirmed by strong trading volume to identify swing trading opportunities with clear entry points.
◔ Gradually take profits at preset technical targets while moving the stop-loss to the breakeven point to protect realized profits and maintain trading discipline.
Utilize moving averages and momentum indicators
The Exponential Moving Average (EMA) is particularly useful for identifying price trends, as it reacts to recent price changes more quickly than the Simple Moving Average (SMA).
The Relative Strength Index (RSI) can help you identify whether a stock is in an overbought or oversold state, making it easier for you to grasp entry and exit timing.
When you combine these indicators with the Moving Average Convergence Divergence (MACD), the latter shows momentum changes through signal line crossings, allowing you to establish a more solid foundation for swing trading judgment.
Exponential Moving Average (EMA)
EMA is a commonly used technical indicator for swing traders; compared to its simple moving average counterpart, it can reflect price behavior more quickly. You will find that EMA strategies excel in determining trend direction and potential entry points. Focusing on EMA trends helps you capture market momentum changes faster than traditional indicators.
Here is a practical guide to common EMA settings and their applications:
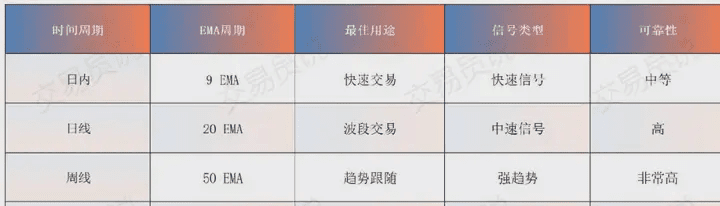
When using the EMA crossover strategy, pay special attention to moments when the faster EMA crosses above the slower EMA—these are often signals for potential trading opportunities. The slope of the EMA can also help you assess the strength of the trend; the steeper the angle, the stronger the trend. For ideal swing trading outcomes, it is advisable to start with a combination of the 20 EMA and 50 EMA.
Related articles: (The One-Minute Ultra-short Trading Strategy Kept Secret by Traders: EMA + RSI Dual Core Resonance to Accurately Target Buy and Sell Points (with Backtesting Report)), (Hurt by False Signals? 15 EMA + Structural Position Dual Insurance to Filter 90% of Invalid Trades)
Relative Strength Index (RSI)
Based on the momentum analysis provided by EMA, the Relative Strength Index (RSI) offers swing traders a tool for measuring market conditions and identifying potential reversals. You will find that RSI is particularly useful for identifying whether an asset is in an overbought or oversold state, aiding you in making more informed entry and exit decisions.
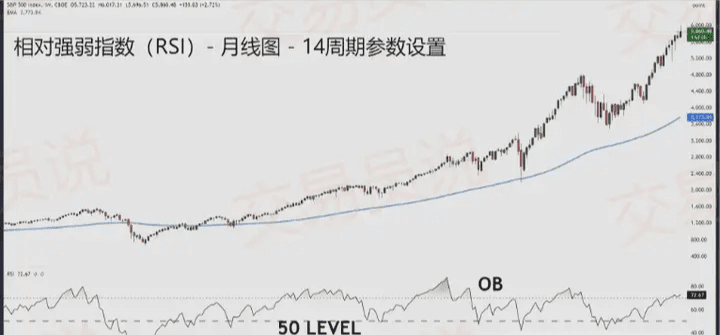
The calculation method for this momentum oscillation indicator compares the average gains and losses over a specific period (usually 14 days) to assess the strength of price momentum.
When analyzing RSI, focus on the traditional overbought (70) and oversold (30) levels. These numerical boundaries help you identify potential trend reversals but should not be relied upon in isolation. It is advisable to combine RSI divergence analysis: when prices move in one direction while RSI moves in the opposite direction, it often indicates an impending reversal.
You can also enhance your analysis by comparing RSI time frames across different periods (e.g., short vs. long periods) for trend confirmation.
To confirm RSI trends more effectively, it is also crucial to observe its behavior near the midpoint (50). When RSI remains above 50 during pullbacks, it generally indicates a bullish trend; conversely, if RSI stays below 50 for an extended period, it usually suggests a bearish market state.
Remember, the best use of RSI is to combine it with other technical indicators, as no single tool can independently function effectively in a trading strategy.
Related articles: (RSI Swing Trading Profit List: 14 Charts Teach You the Ultimate RSI Swing Trading Techniques), (The King of Oscillators RSI, Learn These Three Tips to Save Years of Wrong Turns!), (Explore Trading Indicators: Create a New High Win Rate RSI Indicator with Bollinger Bands - eRSI)
Moving Average Convergence Divergence (MACD)
Among all momentum indicators, MACD is a widely used tool that combines moving averages with momentum analysis to help identify trend direction and potential trend reversals.
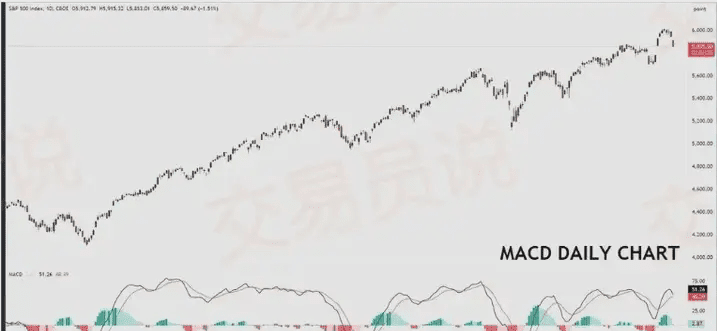
You will find that MACD is particularly useful for interpreting signal lines and identifying momentum changes, providing strong support for your trading decisions.
When analyzing charts, MACD helps you understand market momentum by showing the relationship between two moving averages. Using standard settings (12, 26, 9) allows for consistent analysis across different time frames and markets.
Here are the key methods for using MACD:
◔ Pay attention to MACD divergence strategies: when prices move in one direction while the indicator moves in the opposite direction, it often indicates a potential trend reversal.
◔ Utilize histogram analysis techniques: observe changes in the MACD histogram to assess momentum strength and potential trend changes.
◔ Pay attention to the crossing of the MACD line and the signal line: when the MACD line crosses above or below the signal line, it may indicate entry or exit signals.
◔ For trend tracking: By observing the MACD line's position relative to the zero axis, you can determine whether the current market is in an uptrend or downtrend.
◔ Combine MACD readings with other technical indicators: this can enhance signal reliability and form a more complete trading judgment system.
Related articles: (Finally, someone explained the "MACD trading indicator" clearly, as very few truly understand how to use it), (What happens when the "King of Short-term Indicators" CCI is combined with MACD?), (Simple and easy to understand, Trend Analysis - MACD Divergence Forex Trading Strategy)
Master the use of chart patterns and support/resistance levels
Learn to identify chart patterns, such as upward breakouts and downward breakdowns, which will help you seize the best trading entry and exit opportunities.
When prices have not yet retraced to previous swing highs or lows, the trading significance of these key price levels is significantly enhanced, and the first retracement to these levels usually offers strong trading reference value.
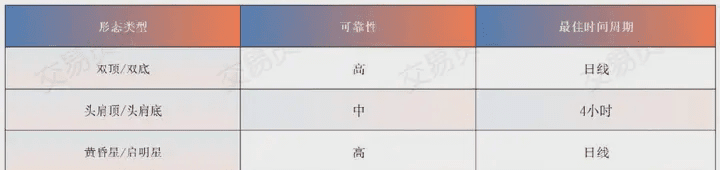
You should focus on some classic reversal patterns, as they often indicate that prices may soon change direction, including head and shoulders patterns (head and shoulders top/bottom), double tops or bottoms, etc.
Trading within trend channels helps you set clear profit targets and manage risks, as these patterns provide natural boundaries for price fluctuations.
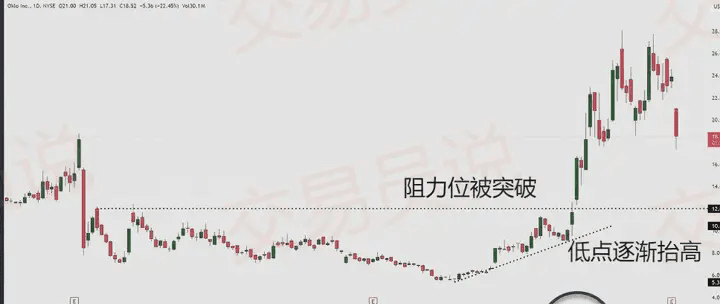
Breakouts and Breakdowns
Successful swing traders typically rely on three key price behaviors: upward breakouts from resistance, downward breakdowns from support, and the subsequent momentum trends.
When tracking bullish breakouts, look for prices to strongly break through resistance levels accompanied by increased volume. Conversely, bearish breakdowns refer to prices breaking through key support levels with increased selling pressure.
During consolidation phases, understanding range-bound oscillation patterns can also help you more accurately identify potential breakout or breakdown areas.
Key points to consider when trading breakouts/breakdowns:
◔ There should be a significant increase in trading volume during the early stages of a breakout to confirm its authenticity.
◔ Prices should maintain above or below the breakout/breakdown for at least two trading days to validate the continuity of the trend.
◔ Pay attention to retests of previous resistance or support levels; these pullbacks often provide entry opportunities.
◔ Beware of false breakouts, as they may reverse quickly, leaving traders trapped on the wrong side.
◔ Combine market sentiment and industry trend analysis to assist you in assessing the credibility of breakouts.
Please remember: Not every breakout or breakdown will result in profitable trades. You should wait for clear confirmation signals before entering and always use stop-loss orders to prevent losses from false breakouts.
The most reliable trading patterns often occur when multiple technical indicators align with the breakout direction (resonance/convergence).
Reversal Patterns
Technical reversal patterns are an effective way to identify potential trend changes before a complete trend shift occurs. Early identification of reversal signals in charts during swing trading can provide a significant advantage.
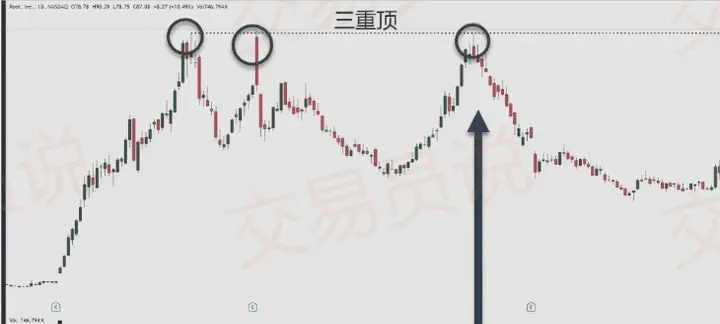
Please pay attention to some common candlestick reversal patterns, such as "Double Top", "Head and Shoulders Top", or "Evening Star", as these patterns are often used to confirm trend reversal opportunities.
Additionally, pay attention to divergence signals between price action and technical indicators, as they often reveal potential reversal areas. Combining multiple technical indicators can enhance analytical effectiveness and reduce false signals.
When identifying reversal patterns, do not rush to enter trades immediately; wait for confirmation through trading volume, momentum indicators, and price action. Pay particular attention to whether these patterns appear near key support/resistance levels, as these locations are more likely to trigger significant trends.
Successful trading is not just about identifying patterns, but also about how you manage risk during execution.
Related articles: (Easily Identify Reversal Signals and Double Your Profits! Top Reversal Patterns Every Trader Should Know), (Summary of 15 Years of Trader Experience: Focus on These Two Points to Increase the Win Rate of Reversal Patterns to 90%! )
Trend Channel
Compared to reversal patterns for judging trend changes, trend channels provide a robust framework for tracking price movements within a defined range. You will find that drawing parallel lines above and below the price can provide clear visual references for trading decisions.
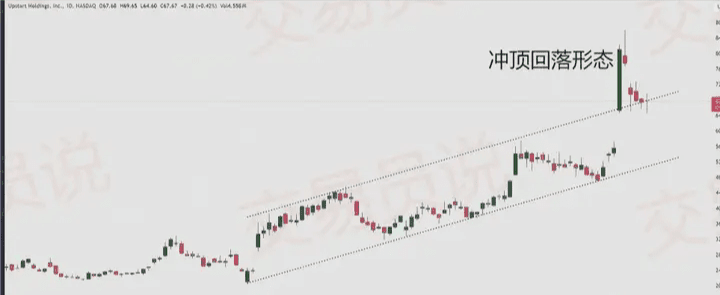
By connecting a series of "higher highs and higher lows" (uptrend) or "lower highs and lower lows" (downtrend), you can identify trend channels. Multi-timeframe analysis can enhance signal reliability, especially when evaluating channel structures, helping you identify the direction of the primary trend.
Related articles: (Trendline Channel Trading Strategy: Naked K Chart Explanation Helps You Capture Market Rhythm and Accurately Identify Buy and Sell Points), ("Collectible Dry Goods" Finally Someone Explained the "Price Channel" Indicator and Trading Strategy Clearly!)
Channel trading strategy notes:
◔ Prices typically oscillate between the upper and lower channel boundaries, creating predictable trading opportunities.
◔ When price breaks through channel boundaries accompanied by strong movement, it may indicate strong trend confirmation.
◔ The longer a channel holds, the more significant its support/resistance meaning becomes.
◔ The width of the channel can serve as a basis for determining position size and stop-loss levels.
◔ Observe how prices behave within the channel, as you can often find clues of momentum changes before a breakout.
When drawing trend channels, focus on the quality of the trend lines. Do not forcefully fit lines; the channel should be naturally formed by price movements.
Please remember that channels can be applied to any time frame, but longer time frame channels are usually more valuable for swing traders, and their signals are more reliable.
Implement risk management and position control
In swing trading, protecting your capital through effective risk management is as important as finding the right trading opportunities.
Establish clear risk assessment standards and cultivate a systematic emotional management mechanism amidst market fluctuations, which will help improve your overall trading performance.
You should start from the following aspects:
1. Set clear stop-loss orders to limit potential losses.
2. Use a reasonable position sizing control strategy to ensure that the risk of each trade does not exceed 1%-2% of the total account capital.
3. As trades develop favorably, gradually take profits to lock in some gains while allowing the remaining position the opportunity to capture larger movements.
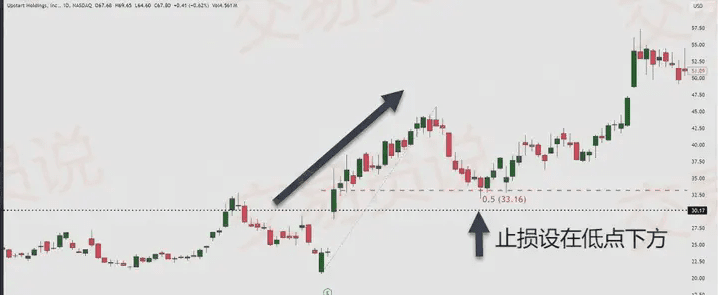
Set stop-loss orders
Setting reasonable stop-losses is your first line of defense against significant trading losses. Mastering various stop-loss strategies can more effectively protect your trading capital and maintain profit consistency.
Using automated stop-loss settings helps reduce emotional decision-making interference and ensures you consistently adhere to preset exit rules.
Here are the key points to consider when setting effective stop-loss orders:
◔ For long positions, set stop-losses below key support levels; for short positions, set them above key resistance levels.
◔ Use trailing stops to dynamically adjust stop-loss positions as prices move in your favor to lock in profits.
◔ Set psychological stop-loss levels based on your risk tolerance to ensure that even if the stop-loss is triggered, it remains within an acceptable range.
◔ Adjust stop-loss distances based on the volatility of the asset—higher volatility assets should have wider stop-losses, while lower volatility assets should be tighter.
◔ When setting stop-losses, be sure to consider the bid-ask spread to avoid exiting prematurely due to brief fluctuations.
Please remember: Your stop-loss should not be set too tight to trigger on normal fluctuations; nor should it be too wide to exceed your risk tolerance.
Use reasonable position size management
In successful swing trading, reasonable position control is as crucial as overcoming emotional trading. Before placing an order, you must assess your risk tolerance and clarify how much capital risk you are willing to take on each trade. This is the foundation of position sizing strategy.
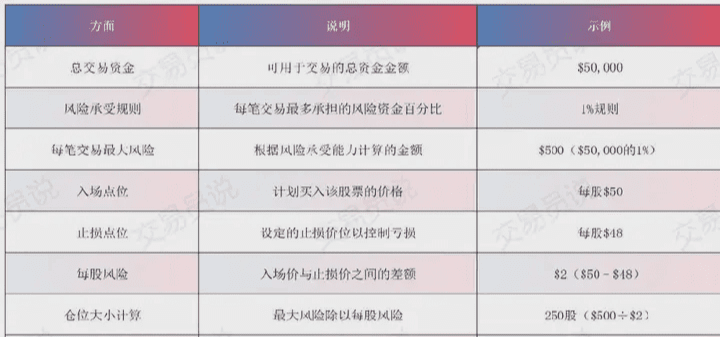
To implement effective position control, first determine your total risk exposure per trade. It is generally recommended that the risk of each trade should not exceed 1%-2% of your total trading capital. When calculating position size, consider the volatility of the price—assets with higher volatility typically require smaller position sizes to better control risk.
Your capital allocation strategy should reflect your risk tolerance and current market conditions. For example, if you have $50,000 in trading capital and follow a 1% risk rule, each trade should only risk up to $500.
To calculate your trading risk exposure, consider the distance between the entry price and the stop-loss price. For example, if you plan to buy a stock at $50 and set a stop-loss at $48, the risk per share is $2, allowing you to buy a maximum of 250 shares ($500 ÷ $2 = 250 shares).
Partial profit-taking
Based on the principles of position management, a partial profit-taking strategy helps you lock in profits while maintaining positions to respond to future market fluctuations. By gradually reducing positions, you can maintain trading discipline while minimizing emotional interference from volatility.
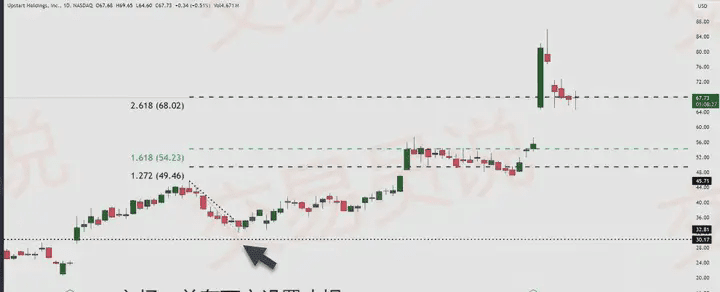
The first profit target is set at the resistance level, with the remaining portion taking profit at Fibonacci extension levels.
Your exit strategy should include multiple profit targets to capture upward price movement while gradually reducing risk exposure.
Here are the key steps to implement an effective partial profit-taking strategy:
◔ Before entering, set preset profit targets at key technical levels.
◔ Take profit at approximately 1/3 of the position at the first target level to lock in initial profits.
◔ Move the stop-loss to the breakeven point to protect realized profits.
◔ Record each exit decision for subsequent review, analysis, and strategy optimization.
◔ Adjust the proximity of target levels based on current market conditions and volatility.
The goal of partial profit-taking is not to maximize every time but to steadily accumulate profits and control risks.
Gradual position reduction can also help you avoid extreme decisions influenced by emotions, such as "all-in" or "all-out", allowing you to remain objective and follow your plan amidst volatile market conditions.
Please remember: Continuous small victories ultimately build long-term success in swing trading.
Frequently Asked Questions:
1. What is the average holding time for swing trading?
It is generally recommended to hold positions for 2-10 days, but the specific duration should depend on trend analysis, market volatility, and whether your entry timing and risk control strategies align.
2. What proportion of my portfolio should be allocated to swing trading?
It is generally recommended to allocate 10%-20% of your funds to swing trading, which helps maintain portfolio diversity and control emotions and risks. As you gain experience, you can gradually adjust fund allocation.
3. What time frames are most suitable for screening swing trading opportunities?
Daily and 4-hour charts are often the most effective. It is recommended to screen every night, using a multi-timeframe resonance confirmation method, and adjust strategies based on market volatility.
4. Should swing trading be engaged during earnings season or major economic events?
You should carefully assess volatility and ensure good risk control. Pay close attention to sector performance and major news impacts, as earnings reports or macro data releases often trigger unexpectedly large fluctuations.
5. What is the minimum account balance recommended for swing trading?
It is recommended that the account balance be at least $10,000, allowing for reasonable position sizing, diversified holdings, and the ability to withstand drawdowns, while also establishing a solid psychological foundation for trading.
Summary
By following these technical analysis recommendations, you will be able to make more rational and well-founded trading decisions. Remember that combining the 20-day EMA, RSI, and volume analysis can help you identify potential trading opportunities while protecting your capital through reasonable position sizing and stop-loss strategies.
Success in swing trading requires patience, discipline, and a meticulous trading plan. Continuing to practice these skills will gradually help you establish a more confident and stable trading approach.
The above is a summary of my practical experience and techniques from over ten years of trading; it may not apply to everyone and requires each individual to use these summaries in conjunction with their own practice. As a trader, the most terrifying thing is not having technical issues, but lacking awareness and falling into trading traps without realizing it! There is no invincible trading system, only invincible users of trading systems! This is the truth; trading systems ultimately come back to the individual!
One. Bear Market Layout. You need enough patience to plan at the bottom of the bear market, although it is challenging to truly buy at the lowest point. The signs for judging the bear market bottom are simple: when no one is paying attention to Bitcoin and the entire cryptocurrency market is in a lifeless state, you can buy in intermittently. This process may last a year or even longer.
2. Just buying mainstream BTC and ETH is undoubtedly the king of the crypto space; buying in a bear market is absolutely correct. Although the increase may not be exponential, holding until the bull market to sell and obtaining over 50% gains is very likely. For large capital, this is the first choice. Additionally, there are exchange platform coins like BNB, relatively strong foundational chains like SOL, AVAX, and good infrastructure coins like MATIC. However, heavy positions in strongly consensus coins like Dogecoin and SHIB are not recommended, as their utility is limited, relying mainly on a large number of buyers forming consensus. Altcoins should not be heavily weighted either, as their logic often involves cutting losses. Every bull market will produce many altcoins, and those that perform well in one round may become quiet in the next, replaced by new altcoins. Without internal channels and information, it is nearly impossible to buy altcoins before they explode. Usually, you only learn of an altcoin's existence after it has surged, at which point it is often too late to follow; even if you are lucky and it rises again, it will likely experience oscillations and declines afterward. Altcoins are highly volatile, making it difficult for the average person to hold onto them; often, they make a small profit only to incur a significant loss. Overall, they still end up losing money.
During a bull market, BTC will slowly rise, leading ETH to rise as well. At this time, some good mainstream coins will follow suit, while other coins will rise slowly, with only a few altcoins experiencing a surge. By mid-bull market, BTC and ETH will oscillate upwards, mainstream coins will gain momentum, and altcoins will begin to take off. In the late bull market, BTC will oscillate downwards, ETH may continue to rise, and mainstream coins will successively surge. The standout altcoins of this bull market could rise several times, or even dozens or hundreds of times. By the end of the bull market, BTC may experience a drop of several thousand or even ten thousand points, then slightly recover. The recovery after the first drop is quick, easily leading people to mistakenly believe it is just an adjustment. However, after two or three such drops, the bull market is declared over. If caught in this, do not harbor illusions; stop losses in time, otherwise, your capital will be dragged into an abyss.
In a bull market, do not gamble on luck.
In the later stages of a bull market, altcoins can be volatile, with many seeing rapid surges that may be tempting. However, do not hastily follow or impulsively heavily invest in certain promising altcoins that have not yet exploded; this mindset is akin to gambling and has nothing to do with investing.
Every bull market will see many altcoins that cut losses; they have plenty of hype, appear to have strong backgrounds, and surge rapidly. You must resist temptation, as when BTC crashes and the bear market arrives, these altcoins will plummet significantly, even approaching zero. If you cannot resist the temptation, you can only use a very small amount of capital to play; even if you make a small profit, do not get impulsive and heavily invest. Gambling cannot always rely on luck; it’s not about winning a hundred times, but about losing once and losing all your capital to start over. Do not fantasize that heavily investing in an altcoin will lead to wealth; this is akin to winning the lottery, a very low probability event. Playing with small funds can be seen as entertainment, but treating it as an investment is a grave mistake.
5. Be patient and less impulsive. After buying in a bear market, you must be patient and wait to sell in a bull market; do not be influenced by fluctuations during this period. After selling in a bull market, also be patient and wait for the bull market to collapse and enter a bear market, which may take one or two years. Do not impulsively bottom-fish at the mountain's waist or foot; wait patiently for the moment it falls into the valley. After selling for a profit in a bull market, do not be tempted to impulsively play with altcoins. If you really want to take a gamble, you should only use a maximum of 10% of your capital.
Six. The capital is most important. If you inadvertently operate chaotically and get trapped, you must do your best to preserve your capital. When the cryptocurrency market crashes, be willing to cut losses and stop losses promptly to preserve most of your capital, as this gives you hope for a comeback. Do not get trapped and accompany the cryptocurrency market in its collapse; often, selling your trapped coins before the crash can lead to at most a 50% capital loss. However, if you ignore the situation and let it fall, holding on until the cryptocurrency hits rock bottom, your remaining capital will have almost no chance of recovery.


