Entering the circle from 50,000 to 100,000 to 302,000, by the third year it reached 590,000, by August of the fourth year it reached 3.78 million, and in the fifth year over 7 million.
Until a few years ago, it was easy to withdraw tens of millions from the cryptocurrency market.
During this time, I fell to the bottom. At that moment, I reached around 4 million, and I thought I could be considered a big shot in the cryptocurrency circle, resolutely quitting my job to focus on trading, even borrowing money to trade. However, reality slapped me hard; the financial crisis not only took back all my profits but also left me deeply in debt, and I eventually had to sell my house. My husband almost left me too.
That period was my darkest moment. In just a few months, I fell from the peak to the bottom. But it also made me realize that the previous smooth sailing was not without a component of luck.
Thus, I feel that if I truly want to continue on the trading path, I need to study diligently. In addition to understanding the fundamentals, analysis of news and research on technical indicators should also be prioritized. If in-depth research and reasonable planning of how to manage one’s finances are not conducted, then funds will only be gradually depleted. Ultimately, as a retail trader without any foundation, one can only joyfully enter the market and leave in silence.
In the following three years, I severed all contact with classmates and friends, stayed home, and tirelessly backtested, often sleeping on the keyboard due to exhaustion. Finally, I achieved financial freedom through trading cryptocurrencies.
Insights on cryptocurrency trading: The importance of mindset, funding sources, and capital volume.
Never take investments too seriously. There are many meaningful things to do in life. Ask yourself, when you are trading and staring at market fluctuations, have you ever thought about whether you are neglecting your loved ones, slacking off on your job, or losing your temper because of price movements... Wealth is just a symbol, sometimes it becomes bigger, sometimes it becomes smaller. That's all. In the future, we will all grow old and die, and future generations may still be swayed by market changes...
Following the market trend is the most reliable beacon to success. During market downturns, do not rush to catch a falling knife; that is merely a mirage. It is during market recoveries and pullbacks that we find golden opportunities to buy low, which is much safer than blindly holding onto the bottom. When selecting digital currencies, we need to cultivate a discerning eye. Those coins that surge like meteors, whether mainstream or not, should be avoided cautiously. Because they rise too sharply, the pullback can be equally astonishing, and a slight misstep may ensnare you.
In the field of technical analysis, I particularly trust the MACD indicator++. When the DIF line and DEA line intertwine and successfully break through the 0 axis below, it is a good buying opportunity. Conversely, if they converge above the 0 axis and extend downward, it signals a reduction in positions.
As for averaging down, that is a thorny path that should not be easily ventured. Once losses occur, do not blindly average down, or you will only sink deeper and possibly lose everything. Remember to decisively cut losses during downturns, and only add to positions gradually during profitable times.
Trading volume is also an essential factor that cannot be ignored. When prices break through at low levels, if trading volume significantly increases, it often indicates that a major opportunity is on the way.
And most importantly, it is essential to follow the trend. By combining the movements of daily, 30-day, 84-day, and 120-day lines, when any line begins to show an upward turning point, you can clearly discern the market trend and make correct decisions. The path of digital currency investment is fraught with risks but also filled with endless opportunities. Only by mastering the essence of capital management, the skills of trend analysis, and the insight to select coins can you, like me, gradually rise from a small starting point to become a member of the middle class.
So, how do retail traders make money?
Many people may say that short-term trading relies on technology while long-term trading relies on logic. In essence, short-term trading depends on emotions, while long-term trading relies on value. Value itself also has emotions, just like Bitcoin can be speculated to 70,000 and then drop back to 15,000; it is not that Bitcoin's value has changed, but rather the market's sentiment has changed. Bitcoin remains Bitcoin.
Therefore, for long-term investment value, one must also understand market sentiment. As for short-term trading, the so-called candlestick techniques + the market itself are a reflection of market sentiment. How the main capital draws candlesticks completely depends on the overall market sentiment, whether there is capital following the trend, and whether there is market heat. It can be said that what you see and hear on the candlesticks are all things that capital wants you to see, and are not formed by natural trading. The ultimate reflection of sentiment is trading volume.
Therefore, any rise or fall in cryptocurrencies is ultimately reflected in trading volume. Without volume, prices can only decline. The first step for retail traders to combat emotions is to understand trading volume and only participate when there is volume. The principle is simple: volume indicates that capital is at work; lack of volume indicates that capital has temporarily abandoned the cryptocurrency.
Why do short-term traders often speculate on hot spots? Because money clustering is the only way to generate profit effects. Even in long-term bullish coins, value investment is also accompanied by volume; during a period of low volume and consolidation, continuous observation is still required. Retail traders, to combat emotions, can see that understanding trading volume alone does not solve the problem; they must have their own trading principles.
The second step for retail traders to combat emotions is to set clear buy and sell conditions. Many retail traders buy and sell arbitrarily, doing as they please.
Buying points typically occur when cryptocurrencies are surging; if you don't buy now, they will take off. Selling points typically occur when cryptocurrencies are plummeting; if you don't sell now, you will be deeply trapped. The emotional response of chasing highs and cutting losses is inherent, and it stems from the collapse of retail sentiment and emotions under severe market volatility. Retail traders need to combat emotions by stopping arbitrary buying and selling, defining clear buying and selling points, and establishing clear principles for when to buy and when to sell, deciding before holding any positions and not acting on impulse.
The third step to combat emotions is to understand patience and letting go. In the retail trading mindset, there is another aspect, which is a weakness of human nature: regret. You will regret why you didn't sell at the time, leading to a decline in price and a loss. You will regret why you didn't buy when the price soared, resulting in missing out. Retail traders need to learn to be patient, which is to endure floating losses.
As long as the investment logic does not change, any floating losses are something that must be accepted; this is one of the situations that will certainly occur on the investment road. No one can perfectly buy at the lowest point. Retail traders need to learn to let go; what is given up is the opportunity cost. As long as cryptocurrencies do not meet their investment logic, even if the price keeps rising, they cannot follow the trend to buy; they must understand how to let go. Let go of those rises that do not belong to their cognitive scope. Cold-blooded individuals are more likely to make money in cryptocurrency trading because the lack of emotions is the only way to survive in the market.
Persist in learning and improving your understanding. I have summarized 5 insights that are very valuable, hoping to inspire friends who come across this!!!!
1. In the early session, do not rush to stop losses after a major drop; it is usually an overreaction to overnight negative news, and you can wait for market recovery and reversal. A major rise at the end of the session should not be blindly chased; some main players like to test the market and induce bullish sentiment, which may lead to a low opening the next day for accumulation.
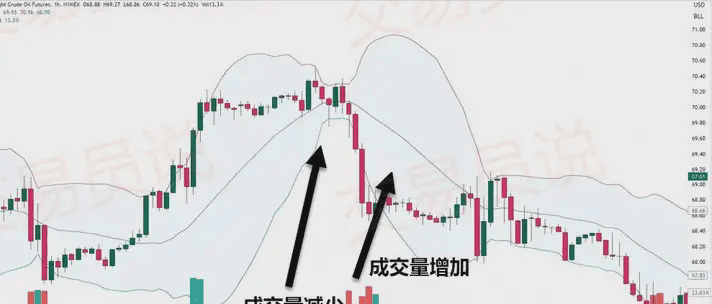
2. Use trading volume as a practical tool; volume can indicate future market direction. If a decrease in volume is accompanied by a price increase, it indicates strong control by the main capital; if volume decreases while prices fall, it suggests that panic selling has not yet occurred, and prices are likely to continue declining.
3. Learn to observe the top structure of sectors. Typically, sector movements are formed by five waves: the first wave draws in following trades, the second wave is a washout and adjustment, the third wave is the main upward wave, the fourth wave shows complex divergences, and the fifth wave is a rally to unload. In this process, the third wave has the largest increase, the first follows, and the fifth is the lowest. But market conditions are ever-changing, and there are often cases without the five-wave pattern; it cannot be memorized rigidly. After discovering that the leading sector has increased, if the subsequent rally does not continue the previous momentum, it is likely that a peak has been reached.
4. Each time during the rapid ascent at the top of Bitcoin, you will see some sector altcoins surge, triggering a reversal in Bitcoin. Just check if the performances of major leaders have stopped falling and started to rise again; then the index will likely follow suit.
5. Specialization and focus are essential for beginners, especially for new friends just entering the market. Studying one trading method and mastering its techniques will yield much more than trying to learn multiple skills simultaneously. Wanting too much can lead to loss, and being unskilled can easily result in being taught a lesson by the market. Do not switch modes arbitrarily; settle down to learn, and gradually you will find your way to stable profits. After that, you can learn more techniques to integrate them.
If you have been confused about the timing of entry and exit in intraday trading, Bollinger Bands may be able to help you. This dynamic indicator adjusts automatically based on market volatility, helping you capture signals before potential breakouts or reversals occur. Combining the visual signals of Bollinger Bands with volume analysis can fundamentally change your trading approach; however, mastering this multifunctional tool is far from simple. Understanding the nuances of bandwidth contraction, expansion, and trend identification will put you ahead of traders who rely solely on basic usage.
Key points summary:
◔ Basics of Bollinger Bands: Bollinger Bands consist of three lines: the middle band (20-day simple moving average) and the upper and lower bands (which are two standard deviations above and below the middle band, respectively). It automatically expands or contracts with market volatility, making it very practical in identifying potential breakouts and reversals.
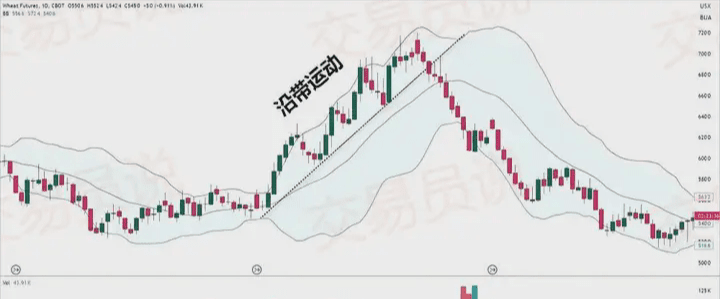
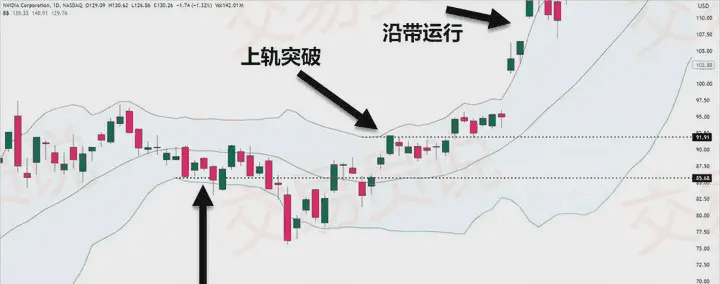
◔ Key strategies: Effective Bollinger Band strategies include: 'Bollinger Contraction' (narrowing bandwidth indicates a possible breakout), mean reversion trading (buying when price touches the lower band and selling when it touches the upper band), and trend following (in a strong trend, prices 'run along the bands'). Combining Bollinger Bands with indicators such as RSI or MACD can enhance signal accuracy.
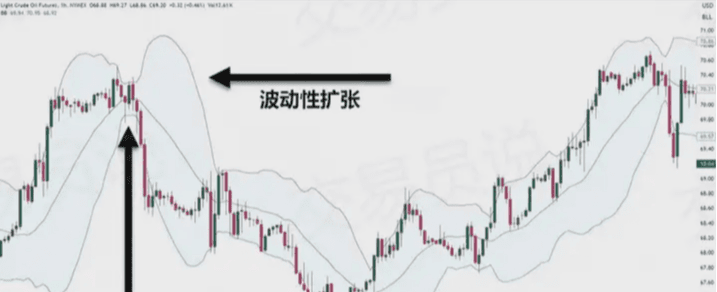
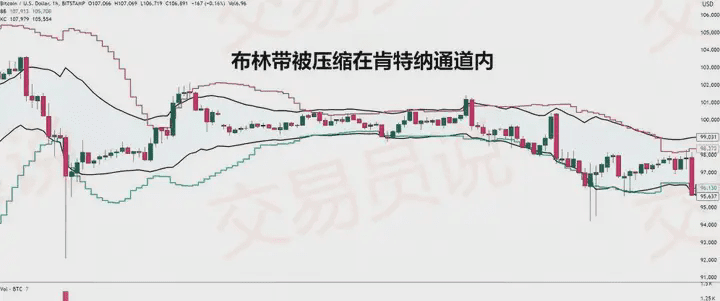
◔ Volatility insights: Bollinger Bands are a reliable indicator of market volatility. Widening bandwidth indicates an increase in volatility, while narrowing indicates a decrease. Bandwidth contraction typically signals that significant market movements are imminent, serving as a key signal for seeking trading opportunities.
◔ Customize settings according to style: The standard parameters are a 20-period SMA and 2 standard deviations, suitable for most situations. However, you can also adjust them based on your own trading style and market conditions. Shorter cycles are more suitable for intraday trading, while longer cycles are better for trending markets. Adjusting parameters based on volatility can optimize performance.
◔ Common mistakes: Avoid relying solely on Bollinger Bands signals; they should be validated with other indicators. Beware of false breakouts, and always use reasonable risk management strategies, such as stop-loss settings and position control, to minimize potential losses.
What are Bollinger Bands and their functions?
Bollinger Bands consist of three interrelated lines and are a powerful technical analysis tool created by John Bollinger in the 1980s. The basic structure of Bollinger Bands includes: one middle band (usually the 20-day simple moving average, adjustable as needed) and two outer bands, positioned at two standard deviations above and below the middle band.
When market volatility increases, the Bollinger Bands will expand; when volatility decreases, they will contract, forming a dynamic envelope around price movements.
In advanced Bollinger strategies, this behavior of expansion and contraction is often used to judge possible market reversals—have you considered how they may signal upcoming market changes? The 'contraction' of Bollinger Bands often occurs before a sharp market breakout and serves as a highly valuable 'predictive' signal.
The importance of Bollinger Bands signals will be reflected when you observe the interaction between price and the bands:
◔ When the price touches the upper band, it may indicate that the market is in an overbought state.
◔ When the price touches the lower band, it may indicate an oversold condition.
However, these signals can be affected by market conditions, so you need to consider the following factors comprehensively:
◔ Volume confirmation.
◔ Overall trend direction.
◔ Consistency of time periods.
◔ Price action patterns.
◔ Bandwidth changes.
These elements working together will help you more accurately identify potential trading opportunities.
When price forms a double top or double bottom pattern near the Bollinger Bands, using a mean reversion trading strategy is particularly effective.
Effectively using Bollinger Bands for trend analysis.
With a grasp of the fundamentals of Bollinger Bands, you will find it particularly valuable in analyzing market trends. When you apply Bollinger Band strategies, the focus is on observing how prices interact with the upper and lower bands to identify potential trend reversals or continuations.
To enhance the reliability of Bollinger Bands, pay attention to the following key signals:
◔ Price 'running along the bands' indicates a strong trend.
◔ Bollinger Bands contraction (narrowing) usually indicates that a significant breakout is imminent.
◔ Price crossing the middle band suggests a possible trend change.
◔ Bandwidth expansion indicates that volatility is rising.
You can optimize the timing of using Bollinger Bands by adjusting the parameters to better fit your trading style. Although the standard settings are 20-period SMA and 2 standard deviations, adjustments can be made according to different time periods and risk preferences. Trailing stops can lock in profits as the market moves favorably.
Understanding the psychological mechanisms behind Bollinger Bands is also important—when prices reach extreme levels, they typically retract towards the middle band. You will notice that the market operates within the Bollinger Bands approximately 90% of the time, making breakout signals especially significant.
You can also use Keltner Channels in conjunction with Bollinger Bands to confirm potential breakout signals and improve trading accuracy.
Related article reading: (Bollinger Bands vs Keltner Channels: Who is the trading winner with the ultimate indicator?)
Using Bollinger Bands to enhance intraday trading strategies.
To successfully use Bollinger Bands for intraday trading, you need to master several proven strategies that can enhance your timing and risk control abilities.
Combining multiple methods will help you make better trading decisions.
"Contraction strategy" is one of the most reliable Bollinger Bands patterns. When you observe the Bollinger Bands narrowing, be prepared for a possible breakout.
Wait for trading volume to increase to confirm breakout direction before entering trades. To reduce risk, stop-loss levels can be set outside the opposite Bollinger Band.
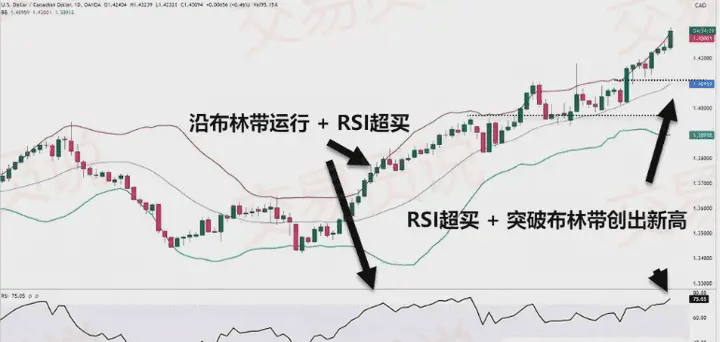
You can also use overbought signals: go short when prices touch the upper band; or go long when prices touch the lower band in an oversold state.
Want to improve signal accuracy? You can combine it with the Relative Strength Index (RSI) for auxiliary confirmation.
Related article reading: (Exploring trading indicators: Creating a new high win rate RSI indicator with Bollinger Bands—eRSI)
You can also use it in conjunction with MACD divergence signals to filter out low-probability trading opportunities and improve the reliability of the strategy.
In trend following, when you understand how prices 'run along the bands,' the results will be even better. In a strong trend, prices will closely follow the upper or lower bands.
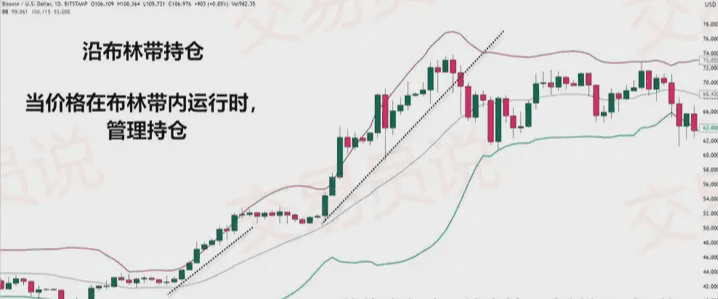
As long as this pattern continues, you can hold your position; once the price breaks below the middle band or trend line, you should consider exiting the trade.
Remember to verify trading signals across time periods; this can provide additional confirmation. For example, use hourly charts to determine trend direction and 5-minute charts to find precise entry points.
Finally, regularly backtesting and optimizing your Bollinger Band strategy can help you adapt to the ever-changing market environment.
Using Bollinger Bands to identify market volatility.
When you focus on the bandwidth of Bollinger Bands, understanding its dynamic performance becomes very intuitive. Bandwidth expansion means that market volatility is rising—price fluctuations become larger; while bandwidth contraction indicates a decrease in volatility, making it an ideal moment to identify potential breakout opportunities.
Your trading psychology plays a crucial role in interpreting these signals. By observing the relationship between price and Bollinger Bands, you will notice that when prices touch or exceed the upper and lower bands, it often suggests possible reversals.
Please keep the following key points in mind:
◔ Bandwidth widening = increased volatility.
◔ Narrowing bandwidth = weakening volatility.
◔ Bandwidth contraction usually indicates that significant market movements are about to occur.
◔ Price breaking out of the Bollinger Bands range usually indicates extreme conditions.
When analyzing market behavior, special attention should be paid to the middle band (20-day SMA).
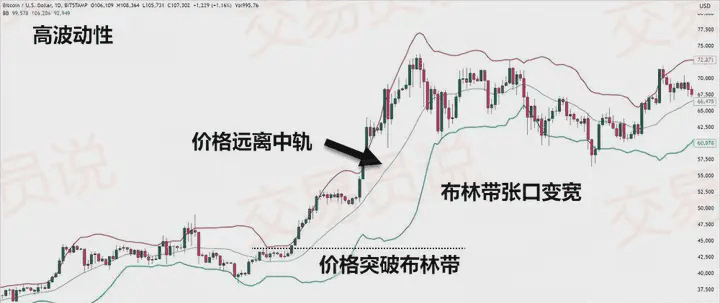
When the price continues to deviate from the middle band, it is very likely in a strong trend.
When the price briefly breaks a key support or resistance level and quickly reverses, this behavior is referred to as a 'false breakout test.'
Using Bollinger Bands in conjunction with candlestick patterns can provide reliable confirmation for trading signals.
Best setting recommendations for Bollinger Bands.
After you understand the principles of how Bollinger Bands reveal market volatility, the next step is to focus on optimizing parameter settings to achieve maximum trading effectiveness.
The standard configuration is: 20-period SMA + 2 standard deviations, which is suitable for most traders. However, you should personalize adjustments based on your trading strategy and market conditions.
The parameters of Bollinger Bands should be adjusted according to your trading cycle and asset characteristics: if you are an intraday trader, using shorter cycles (such as 10 or 14 periods of SMA) can yield more responsive signals. Just like how the 'quality index' reversal can be used to judge market exhaustion, adjusting the Bollinger Bands parameters also helps in identifying trend changes.
For medium to long-term holdings, you may consider extending the cycle to 50 or 100 to capture larger market trends. Additionally, pay attention to changes in market conditions:
When volatility increases, you can adjust the standard deviation to greater than 2 to widen the Bollinger Bands, accommodating larger price fluctuations; when the market is stable, you can decrease the standard deviation to narrow the Bollinger Bands to capture subtle trading opportunities.
Using Bollinger Bands to identify market reversal signals.
Using Bollinger Bands to identify market reversals requires careful observation of price interactions with the upper and lower bands. When analyzing the shape of Bollinger Bands, pay attention to instances where the price touches the upper band (overbought condition) or the lower band (oversold condition), as these often indicate potential reversals.
To improve your price action methods, pay attention to the following key signals:
◔ Price touching or exceeding the upper band (may suggest a downward reversal).
◔ Price touching or breaking below the lower band (may suggest an upward reversal).
◔ Bollinger Bands contraction indicates that severe volatility is about to occur.
◔ Price divergence from the RSI indicator can serve as an auxiliary confirmation of reversal signals.
But do not rely solely on the touch signals of Bollinger Bands. You also need to combine them with other technical indicators for confirmation.
For example: when the price touches the upper band and the RSI indicates overbought, the credibility of the reversal signal will be higher.
Be aware that especially in trending markets, prices may continue to run close to the Bollinger Bands without reversing immediately, which can easily lead to false signals or failed trades. Therefore, always consider the larger market context and use multiple indicators for validation.
Common mistakes to avoid when using Bollinger Bands.
In addition to understanding the reversal signals of Bollinger Bands, it is equally important to know which misconceptions to avoid, as this can help you reduce unnecessary losses.
Here are common mistakes:
◔ Entering trades solely based on Bollinger Bands signals without combining other trend confirmation indicators. Price touching the Bollinger Bands does not equate to a trading signal; it must be judged in conjunction with trends and volume.
◔ Being deceived by false breakouts. Many newcomers rush to enter the market when prices just break through the Bollinger Bands, only to be 'slapped in the face' by the reverse market. Don't forget, in a strong trend, prices may continue to operate outside the Bollinger Bands without immediately reversing.
◔ Ignoring volatility contraction signals. A significant narrowing of the Bollinger Bands usually indicates that a major movement is about to occur. If this is not recognized timely, high-probability trading opportunities may be missed.
◔ Not adjusting parameters based on market conditions. A 20-period moving average may not be suitable for your trading style or asset volatility characteristics.
◔ The lack of risk management is the biggest hidden danger. Regardless of what signal the Bollinger Bands show, stop-loss levels must be set, position sizes must be controlled, and ensure that risk for each trade is manageable.
Common questions:
1. Can Bollinger Bands be used in conjunction with other technical indicators?
Of course. Combining Bollinger Bands strategies with RSI, MACD, and volume indicators can significantly enhance the strength of entry signals, improve risk control capabilities, and help identify more reliable volatility breakout trading opportunities.
2. How should the settings of Bollinger Bands be adjusted in different market environments?
When market volatility changes significantly, the settings of Bollinger Bands should be adjusted accordingly. It is generally recommended to reassess parameters every 2 to 4 weeks based on market conditions.
3. Are Bollinger Bands equally effective for all financial products?
Bollinger Bands perform differently in various markets. They show more stable performance in forex and stock markets, but their effectiveness may be limited in commodity markets, depending on the volatility characteristics of that market.
4. What is the best time frame to use Bollinger Bands for intraday trading?
15-minute and 1-hour charts are commonly used choices for conducting intraday analysis with Bollinger Bands. Specific adjustments should be made based on market volatility characteristics and should match your trading execution rhythm and risk control plan.
5. In which market condition does the Bollinger Bands perform better, in a volatile market or a trending market?
Bollinger Bands can perform well in both types of markets. In a volatile market, Bollinger Bands can clearly define high and low points, making it one of the most powerful tools; in a trending market, adjustments to bandwidth are necessary to avoid false reversal signals, thereby improving strategy effectiveness.
All the above are summaries of my 10+ years of practice and technical experience in cryptocurrency trading, which may not apply to everyone. Each person needs to use and summarize based on their own practice. As a trader, the most frightening thing is not having technical issues, but rather lacking awareness, falling into these trading traps without realizing it!

