Based on the analysis of the 'three-line integration' indicator, there may be a period in the second half of 2025 when the blue and green lines rise simultaneously, bringing potential opportunities for players. These two periods are from the end of June to early August (first phase) and from mid-August to the end of September (second phase). If the red line follows historical patterns and rises concurrently, the market may welcome a wave of bullish trends. However, from a 'mystical' perspective, two variables are worth noting that may affect the actual trend.
Variable One: Pressure on the MVRV Indicator's Correction
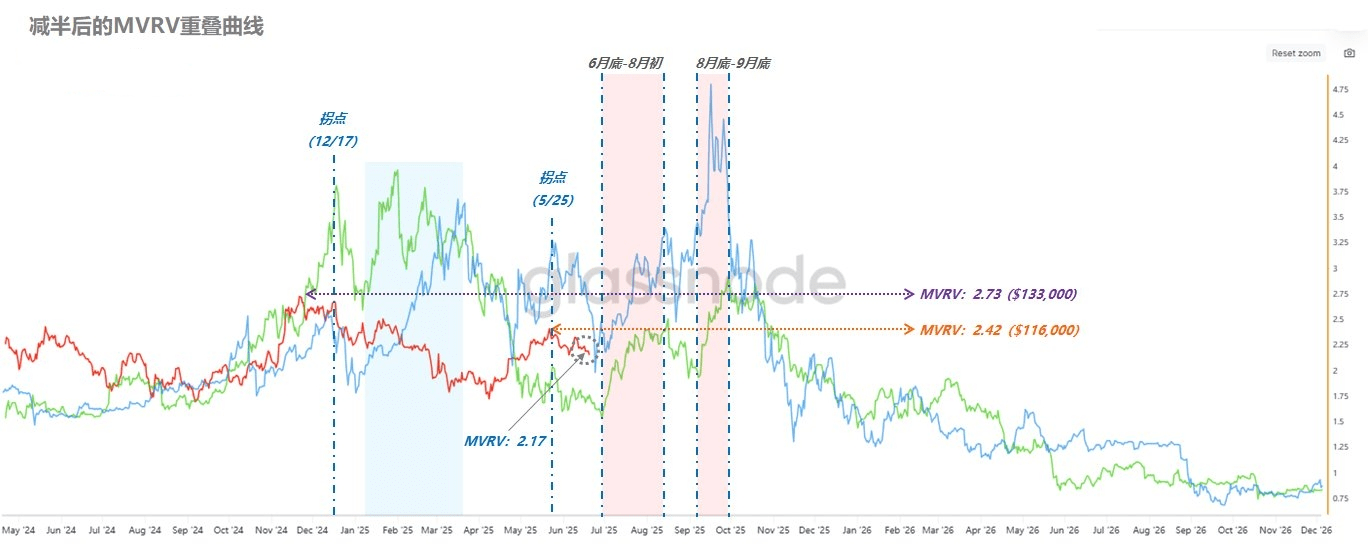
Since the indicator turned on May 25, the market has shown an overall oscillating downward trend, with the current MVRV value at 2.17. To achieve 'three-line integration' with the blue and green lines and initiate an upward trend by the end of June, the MVRV needs to adjust to below 2.0 before the end of June, corresponding to a Bitcoin price of approximately $95,000.
If this premise is not met, the strength of the rebound in the first phase may be limited, and the MVRV may only approach the previous high of 2.42 (refer to the orange dashed line in the figure), corresponding to a Bitcoin price of approximately $116,000. Players need to closely monitor the indicator dynamics in late June to assess the strength of the first phase's initiation.
Variable Two: Risk of the Red Line 'Decoupling'
Looking back at history, similar to the turning point on May 25, the red line completely deviated from the rhythm of the blue and green lines after the turning point on December 17 last year (from January to March 2025), entering an independent downtrend (refer to the blue shaded area in the figure). If this scenario repeats, the first phase may continue to oscillate downward, and the true 'three-line integration' may be delayed until the second phase (mid-August to the end of September).
At that time, the market may welcome stronger upward momentum, and the MVRV is expected to challenge the peak of this cycle at 2.73 (refer to the purple dashed line in the figure), corresponding to a Bitcoin price of approximately $133,000, becoming a potential high point opportunity in the second half of the year.
A piece of advice
'Mystical' predictions may be interesting, but the market is full of variables. The Bitcoin prices mentioned in the text are estimated based on the current RP value and need to be calibrated every two weeks to ensure prediction accuracy.