1. Key levels and trend judgment
1. Support level
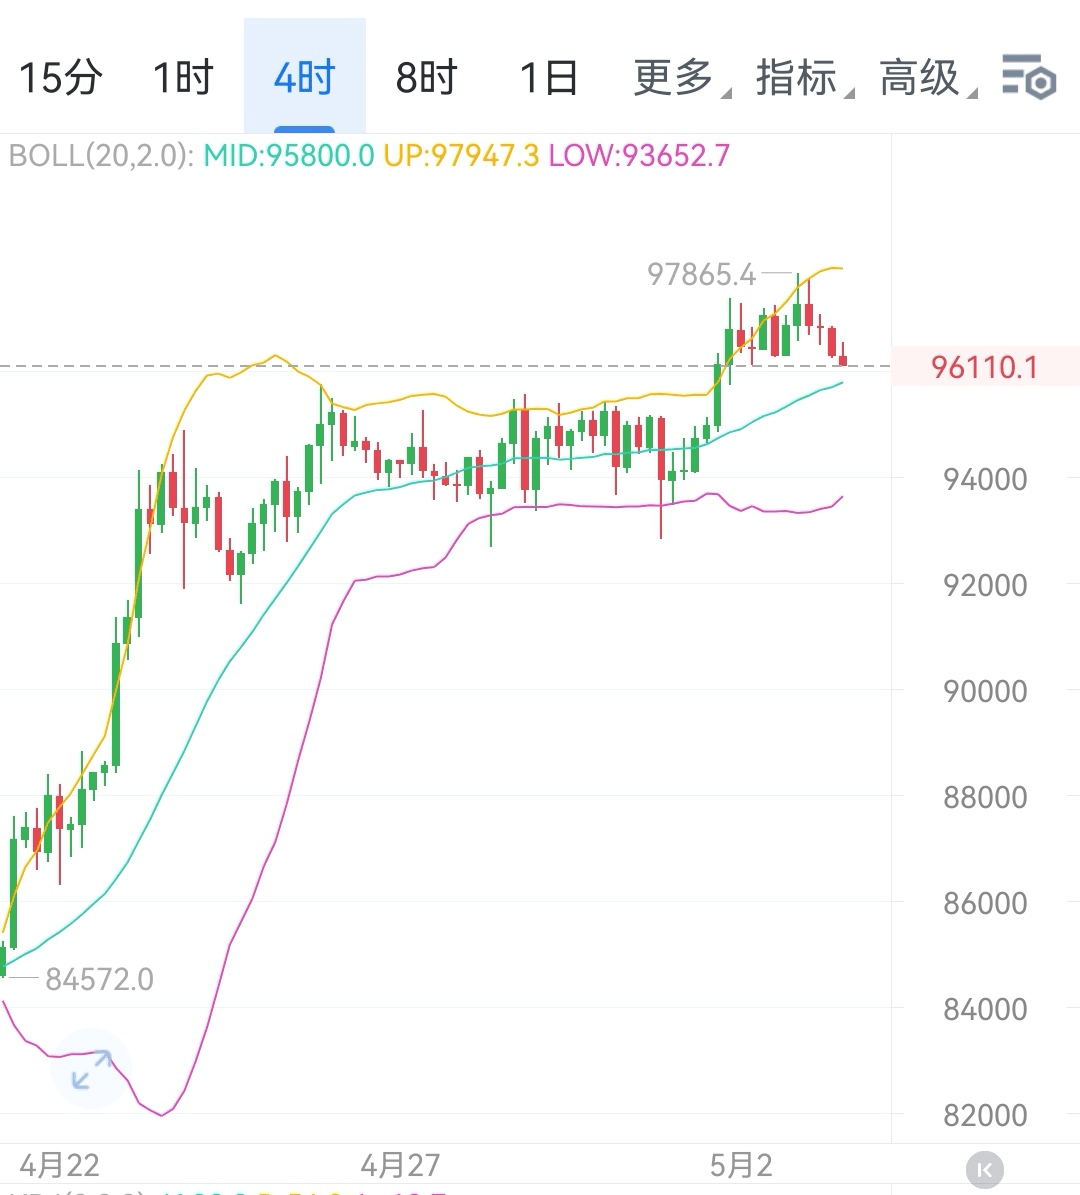
- First support level (strong support): 96300
- This is the bottom of the current sideways range. If the price tests this level and does not break below, it indicates that short-term bullish forces still dominate, and the market is likely to maintain a trend of oscillating upwards.
- Second support level (target after breaking):
- If the 4-hour closing price falls below 96300, the market may turn into a pullback, and support levels to look for below are:
- 95300 (short-term secondary support)
- 94110 (mid-term support)
- 92845 (strong support, can be seen as the limit for short-term pullback)
2. Resistance level
- First resistance level: 97390 (top of the sideways range)
- If the price breaks through this level, it indicates short-term strength and may further challenge higher levels.
- Second resistance level (target after breaking):
- After breaking 97390, the upper resistance levels are as follows:
- 98500
- 99400
- 100370 (short-term strong resistance, close to a round number)
2. Operational strategy suggestions
1. Bullish (as long as it does not break support)
- Condition: Price tests around 96300 without breaking down, and the 4-hour closing remains stable.
- Operation:
- Short-term can enter with light positions, targeting first at 97390, and continue to hold if it breaks, aiming for 98500-100370.
- Stop loss: below 96300 (for example, set at 96000).
2. Bearish (breaks support)
- Condition: The 4-hour closing falls below 96300, confirming the start of a pullback.
- Operation:
- Short-term reduction in positions or wait and see, to avoid pullback risk.
- If looking for a rebound, one may try to go long with light positions at the lower support levels (like 95300, 94110), setting the stop loss below the support levels (for example, 95000, 94000).
3. Risk warning
1. Cryptocurrency is highly volatile, and position management must be strictly controlled to avoid full position trading.
2. Pay attention to key time points: around the opening of the US stock market in the evening (around 21:30) and macroeconomic data (such as news related to Federal Reserve policies), which may trigger significant price fluctuations.
3. Stop loss and take profit must be set: regardless of bullish or bearish, it is essential to plan exit points in advance to avoid emotional trading.
4. Summary
- Core logic: 96300 serves as the dividing line for bullish and bearish; if it does not break, the market is biased towards strong oscillation, and if it breaks through resistance, look for higher; if it breaks down, turn to pullback and look for support levels.
- One-sentence strategy:
- Maintaining stability at 96300 can try to go long, targeting 97390 and above; if it breaks, then wait or look for lower support to seek a rebound, strictly control risk.$BTC #比特币走势