1. Core point analysis: The contention of bulls and bears at 600.5
1. Upper support level (bull-bear dividing line): 600.5
- Technical significance:
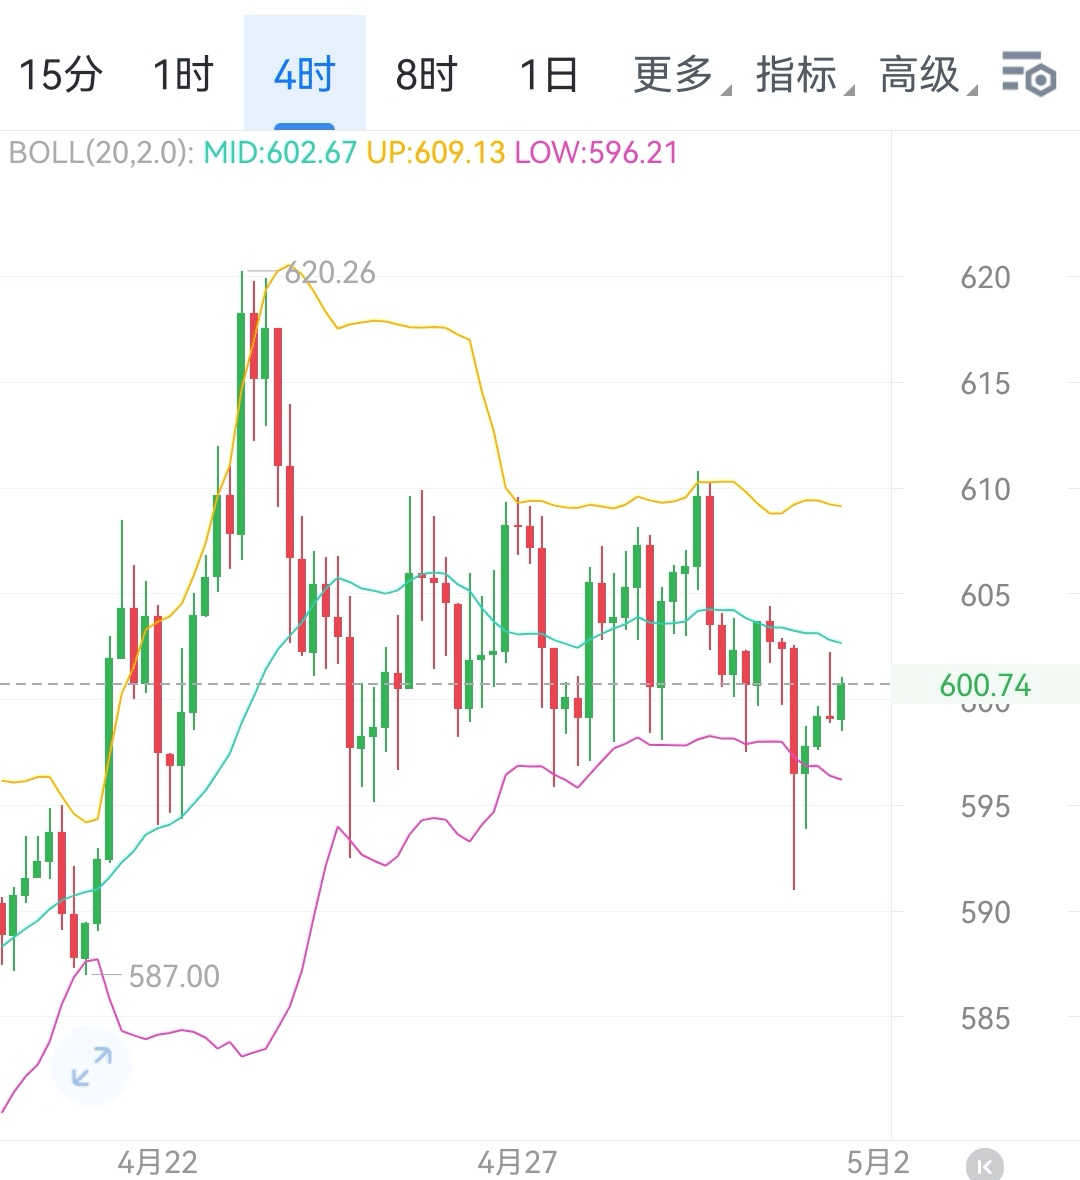
- At the 4-hour level, 600.5 is the support of the dense trading area after recent retracement and is also the critical point for short-term trend reversal.
- Stabilization signal: If the price continuously closes above 600.5 (e.g., 4-hour candles consistently show two bullish candles stabilizing), it indicates that bulls begin to dominate the rebound, can be seen as an entry signal.
- Break risk: If four consecutive 4-hour candles are below 600.5, it indicates weakness in rebound, bears may continue to suppress price, need to turn to wait-and-see or wait for lower support.
2. Upper pressure level (rebound target)
- First resistance level: 604.3
- Position characteristics: The high point of the previous retracement, the area where short-term trapped positions are concentrated; breaking through requires volume support (e.g., trading volume increases by 30% compared to the previous day).
- Operation reference: If this level is touched and shows stagnation patterns like 'shooting star', can take short-term profit; can chase after breaking, target 610.
- Second resistance level: 610
- Market psychology: Integer level + lower edge of previous oscillation center, dual resistance overlap; if broken, it may trigger follow-up buying.
- Third resistance level: 614
- Long-term resistance: Upper edge of oscillation from the beginning of the year to now; if broken, it will open mid-to-long term upward space; need to pay attention to BNB ecosystem benefits (such as new chain releases, burn data) driving.
3. Lower support level (retracement target)
- First lower support: 595.3
- Short-term support: After breaking 600.5, this position is the golden ratio 0.382 retracement level; if it quickly drops to stabilize (e.g., long lower shadow), can bet on an oversold rebound.
- Second lower support: 591.3
- Trend key: 4-hour level rising trend line support; if lost, may trigger mid-line retracement; need to be wary of breakout risks.
- Third lower support: 587.2
- Strong support zone: Corresponds to the low point in March + lower track of daily Bollinger Bands; if reached, can be seen as a long-term layout opportunity, need to judge in conjunction with market sentiment.
2. Operation strategy: Responding to different scenarios
Scenario One: Stabilize at 600.5, initiate a rebound
- Entry timing:
- Price re-tests the range of 600.5-601.5 and stabilizes, with MACD golden cross + moderate increase in volume.
- Aggressive strategy: Light long position, stop loss below 600.5 (e.g., 599.8), target 604.3→610.
- Conservative strategy: Wait for breakthrough of 604.3, then re-test to confirm support (603-604) before entering, stop loss at 601, target 614.
- Profit-taking logic:
- Encountering resistance near 604.3: reduce position by 50%, remaining position aims for 610;
- Breakthrough 610: Hold until 614, if stagnates, take all profits.
Scenario Two: If it cannot rise above 600.5, continue retracement
- Watch signal: Price continues to be suppressed below 600.5, and the rebound height does not exceed 603, showing characteristics of 'gradual decline + low volume'.
- Layout timing:
- Test 595.3: Light position to try long, stop loss at 593, target 600.5;
- Break below 595.3 and test 591.3: If a bottom divergence occurs (e.g., new price low but RSI not at new low), enter mid-line long position, stop loss at 589, target 605+.
- Risk control: Each time a support level is broken, do not bottom fish before stabilization to avoid 'catching a falling knife'.
3. Risk warning and capital management
1. Position principle:
- Single trade position ≤ 3% (aggressive strategy), conservative strategy ≤ 2%, avoid excessive exposure risk in a single currency.
2. Stop loss discipline:
- Long position stop loss should be set 3-5 points below the support level (e.g., for a 600.5 long position, stop loss at 599.5), exit decisively if broken.
3. Emotion management:
- Do not chase rapid rises after breaking through (e.g., direct rise from 604.3 to 610), wait for a re-test to confirm;
- Do not panic sell during a sharp drop below support (e.g., instantaneous drop below 595.3), wait for a rebound to reduce position.
Summary: Key focus on the defense of 600.5
Today's core contradiction in BNB's movement lies in whether 600.5 can effectively stabilize:
- Bullish dominance: If stabilized, it opens the rebound path of '600.5→604.3→610→614', can rely on support to buy at low.
- Bearish pressure: If it cannot rise above, it will test 595.3→591.3→587.2, need to patiently wait for stabilization signal.
- Operation mnemonic:
- Stabilize and do not chase high; re-tests are opportunities;
- Do not be careless if breaking, wait for signals to descend.
Market variables: Pay attention to the US stock market opening sentiment at 8 PM tonight, Binance official Twitter dynamics (such as whether to announce new quarterly burn data), which may trigger short-term volatility intensification.$BNB #BNB走势