1. Core Support Level Analysis
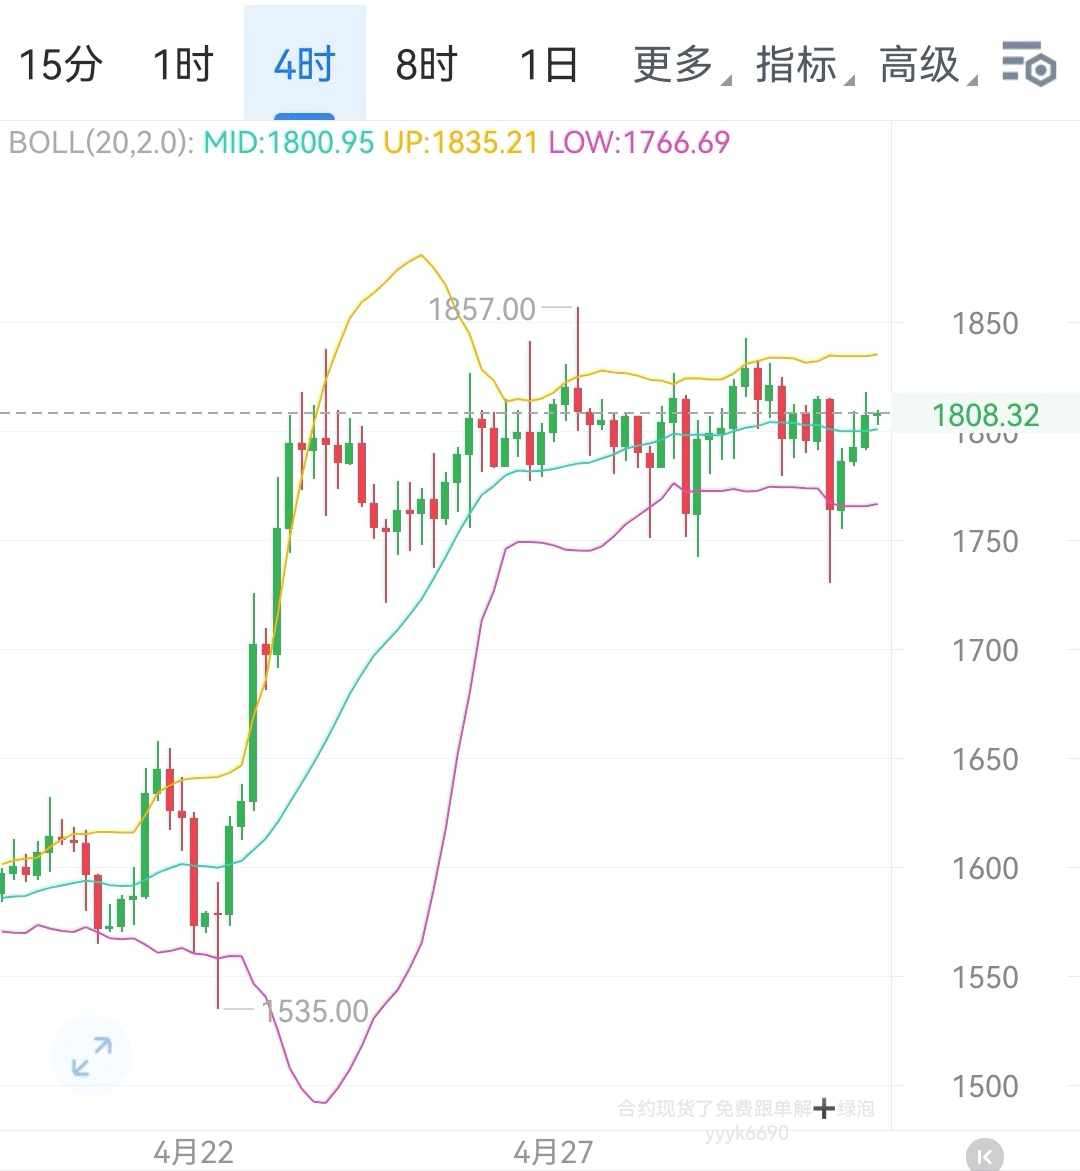
1. Upper Support Level: 1800 (Short-term Bull-Bear Divide)
- Importance: This level serves as the core support for the short-term trend on the 4-hour chart. If the price continues to hold above this point, it indicates that bullish forces dominate the market, and the trend is likely to continue upwards.
- Market Meaning:
- Not Broken: Considered as a solid line of defense for bulls; positions can be attempted based on this support, targeting the upper resistance level.
- Broken: Short-term bullish momentum may wane, and the market could turn toward a pullback; caution is needed regarding downward risks, with attention to the strength of support at lower levels.
2. Upper Resistance Levels (Targets to Break Through)
1. First Resistance Level: 1830
- Significance of Position: The recent upward movement formed a short-term resistance; a breakthrough may open further upward space, testing higher levels.
- Trading Reference: If the price reaches this level and shows signs of stagnation (such as a long upper shadow or increased trading volume), consider taking short-term profits or reducing positions; if a strong breakout occurs, continue holding long positions, aiming for higher targets.
2. Second Resistance Level: 1855
- Historical Reference: This position serves as the upper edge of the previous oscillation range, presenting strong psychological resistance. After a breakthrough, the market may accelerate upward, testing the annual high area.
3. Third Resistance Level: 1880
- Long-term Target: If market sentiment continues to heat up and trading volume supports it, the price is expected to test this level. Attention should be paid to macro market capital flows and ETH ecosystem dynamics (such as upgrade progress, DeFi data).
3. Lower Support Levels (Potential Pullback Layout Area)
1. First Lower Support Level: 1762
- Initial Acceptance Area: If the price breaks below the upper support level of 1800, it may quickly test this position in the short term, marking the first point of contention between bulls and bears.
- Trading Strategy: If a signal of stopping the decline occurs (such as a bullish candlestick rebound or shrinking trading volume), it can be seen as a short-term buying opportunity, with the target revisiting the situation of breaking the 1800 resistance level.
2. Second Lower Support Level: 1730
- Mid-term Key Support: This position serves as support for the rising trend line on the 4-hour chart. If the price falls to this level, observe whether bulls can organize an effective counterattack; stabilization here can be seen as a mid-term layout opportunity.
3. Third Lower Support Level: 1690
- Strong Support Bottom Line: If the market continues to weaken, this area serves as support from a previous dense trading zone, with a low probability of breaking below. If it reaches this point, it can be seen as a mid- to long-term accumulation opportunity for bulls, but market fundamentals (such as ETH staking rate, Layer 2 development) should be considered for a comprehensive judgment.
4. Trading Strategies and Position Management
1. Pending Summary: Current market status assessment
- Oscillating Bias: The current price is above the upper support level of 1800, and the short-term trend is intact, but caution is needed for the risk of a pullback in the densely packed resistance area above.
- Risk Warning: Cryptocurrency is highly volatile, and strict stop-loss settings are necessary (such as exiting if breaking below the upper support level) to avoid emotional trading.
2. Reference for Entry Positions
- Aggressive Long Position: If the price stabilizes around 1800, consider a light long position, with a stop loss set below 1780, targeting 1830 and 1855 sequentially.
- Conservative Long Position: If the price breaks above the 1830 resistance level, wait for a pullback to confirm effective support before entering, with a stop loss set at 1810, targeting 1880.
- Pullback Layout: If the price breaks below 1800, wait for stabilization signals at the lower support levels of 1762 or 1730 (such as a double bottom pattern or MACD divergence) before considering gradual accumulation.
5. Key Points for Risk Control
1. Position Management: The position of a single trade should not exceed 5% of total capital to avoid full position trading.
2. Take Profit and Stop Loss: Set reasonable take-profit targets based on resistance and support levels, and be decisive with stop losses to avoid expanding losses.
3. Summary: Focus on the 4-hour candlestick patterns, changes in trading volume, and market news (such as Federal Reserve policies, ETH-related news) to adjust strategies flexibly.$ETH #以太坊走势