When analyzing $BTC , most traders look at price charts. But beyond the price itself, on-chain metrics can provide powerful insights into what investors are actually doing. One of the most valuable tools in this regard is the Realized Profit graph.
🔎 What is Realized Profit?
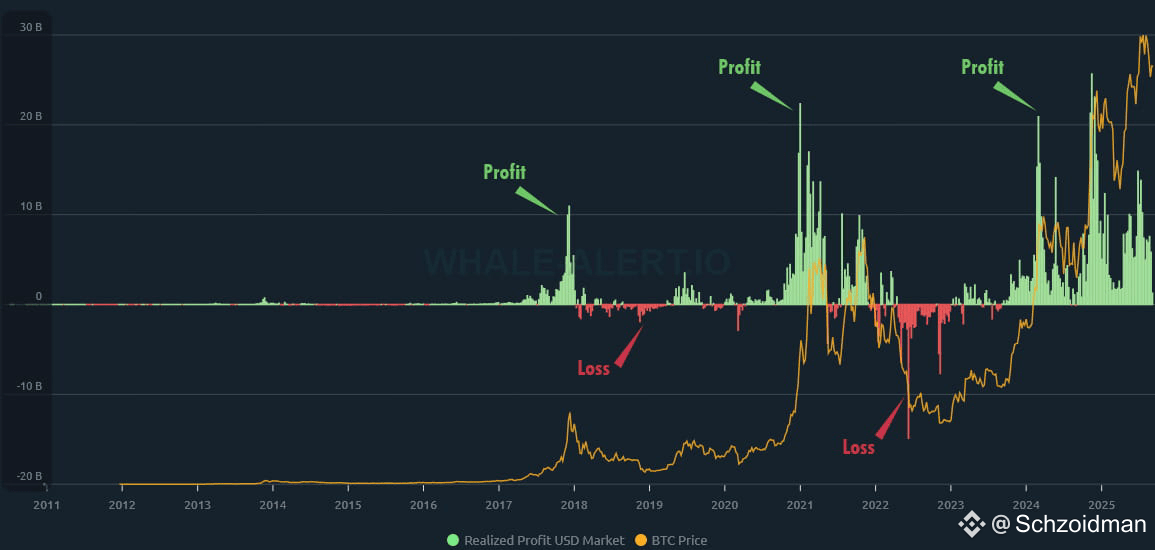
The Realized Profit metric shows how much profit or loss was actually locked in by Bitcoin investors over a given period.
Profits occur when coins are sold at a higher price than they were acquired.
Losses occur when coins are sold below their acquisition price.
This makes it an excellent indicator of market sentiment.
📈 Bull vs. Bear Signals
Extended periods of realized profit → Investors are cashing out gains consistently. This usually corresponds to bull market phases where optimism is high.
Extended periods of realized loss → Investors are panic selling at a loss. This is a hallmark of a bear market, reflecting fear and capitulation.
⚠️ Predicting Market Moves
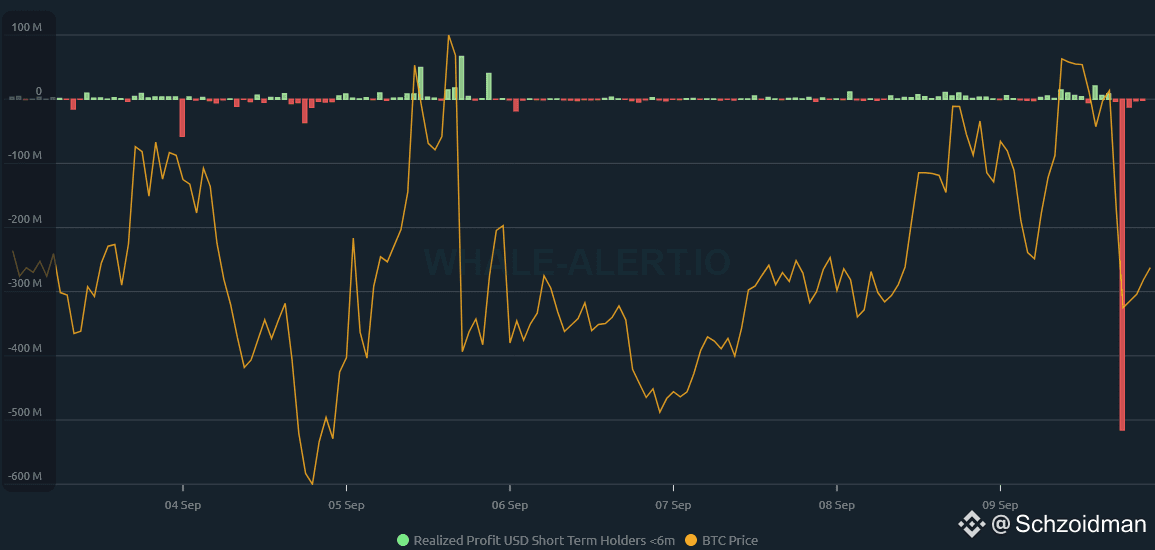
One of the most interesting uses of this metric is spotting unusual profit-taking or loss-taking events.
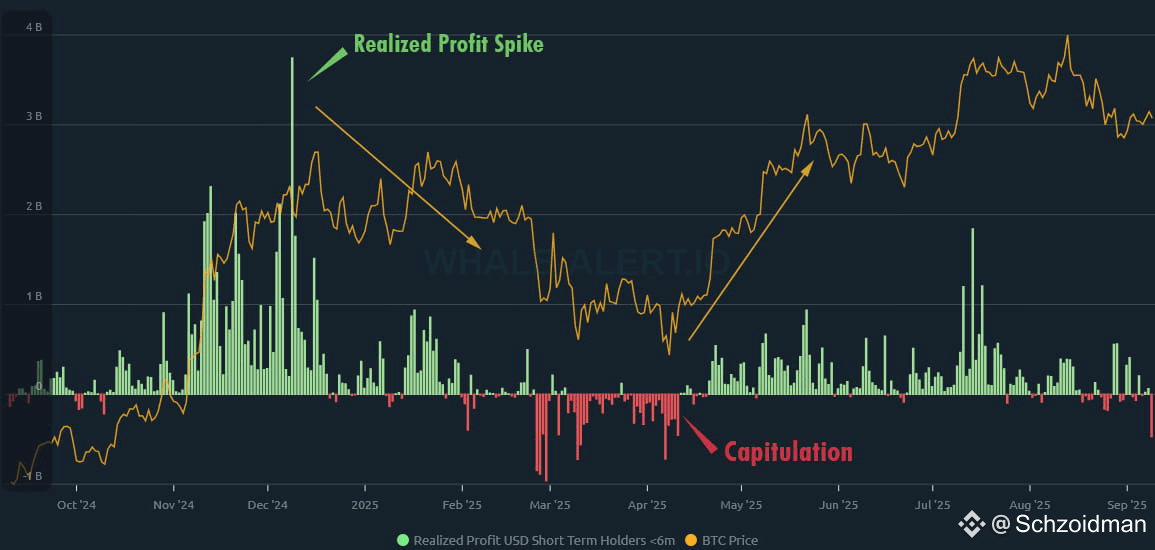
Sudden spikes in realized profit can hint at a potential price correction, as many investors lock in gains.
Surges in realized losses can suggest capitulation, often marking a local bottom.
👥 Different Perspectives
The Realized Profit graph can be analyzed for:
All Market Participants – overall sentiment.
Short-Term Holders (STH) – those holding BTC for less than 6 months; more reactive, often drive volatility.
Long-Term Holders (LTH) – those holding BTC for over 6 months; generally more resilient, their behavior signals deeper conviction.
🧩 Why It Matters
By combining price action with realized profit data, traders can better understand who is selling, when, and at what profit/loss. This helps anticipate market shifts more accurately than price alone.
In short: Realized Profit turns invisible emotions—fear and greed—into measurable data.
