🚀 SUI/USDT Technical Analysis – 4H Chart (Trader’s Eye View) 🚀
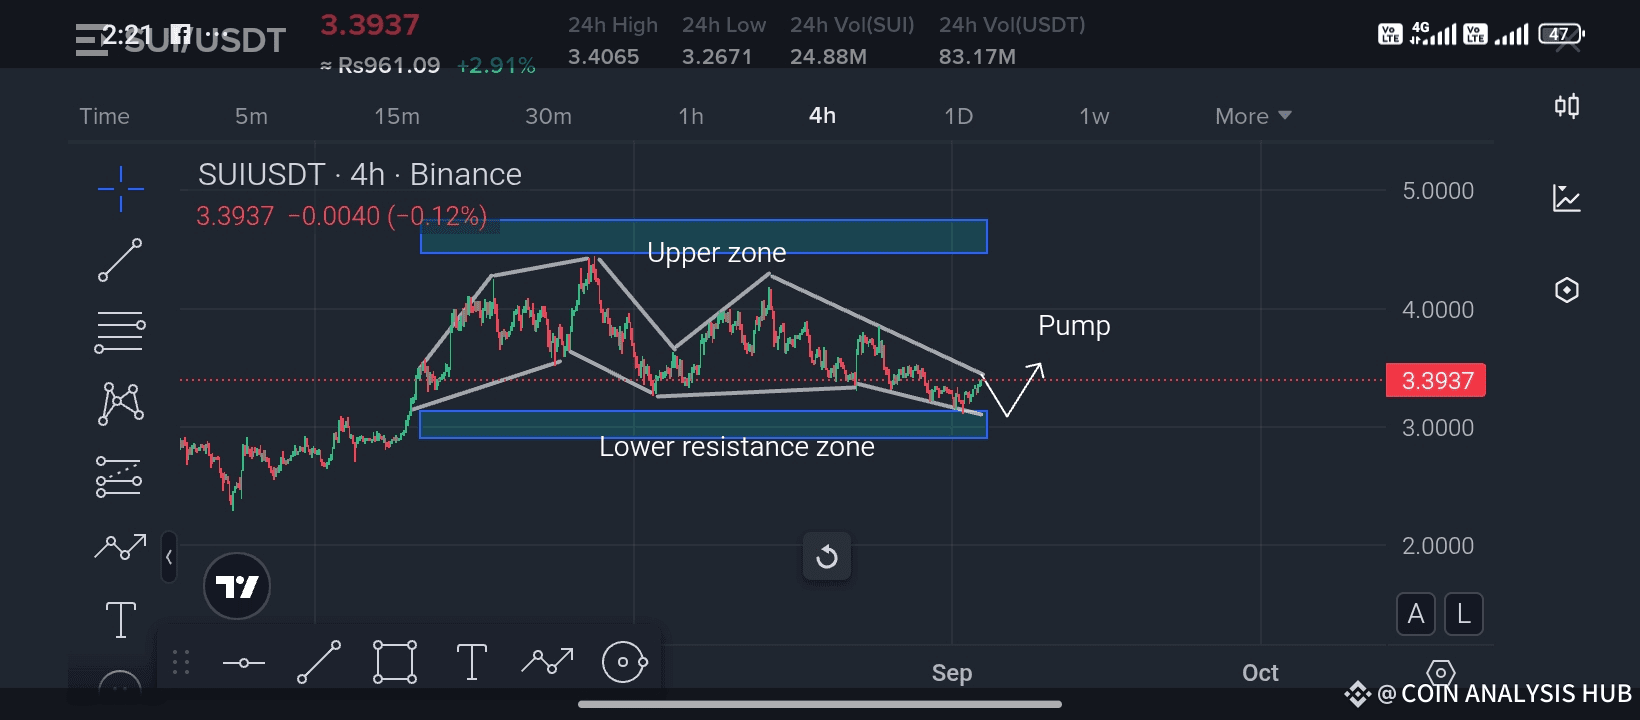
Currently, SUI is trading around 3.39 USDT, showing consolidation after a strong retracement phase. The chart structure highlights a falling wedge pattern forming near the lower support zone, which is typically considered a bullish reversal signal in technical analysis.
🔹 Upper Zone (Resistance Area):
Price has tested this area multiple times in the past, facing consistent rejection. This indicates strong selling pressure around that zone.
🔹 Lower Resistance Zone (Now Acting as Strong Support):
This level has held firm against multiple sell-offs, suggesting buyers are stepping in aggressively here.
🔹 Current Situation:
We are witnessing price compression with lower highs but steady support around the base. If this support continues to hold, the probability of a pump toward the upper zone increases significantly. A breakout from the wedge could trigger momentum-driven moves.
📊 What to Watch:
1. Break above short-term descending trendline = early bullish confirmation.
2. Volume spike = strong confirmation of a pump.
3. Risk management = Always set stop-loss just below the support zone.
💡 Trader’s Tip:
Patience is key. Don’t chase the pump; instead, look for confirmation signals. Traders who plan entries near support zones with tight risk management often gain the best reward-to-risk setups.
🔥 If you find this analysis helpful, don’t forget to LIKE, COMMENT, and SHARE so more traders can benefit. Your support motivates me to bring more real-time technical breakdowns like this. Let’s grow together! 📈✨
#ListedCompaniesAltcoinTreasury
Best of luck 🤞 🍀 🤞