🚀 Trader’s Eye Technical Analysis on SOL/USDT (4H Chart) 🚀
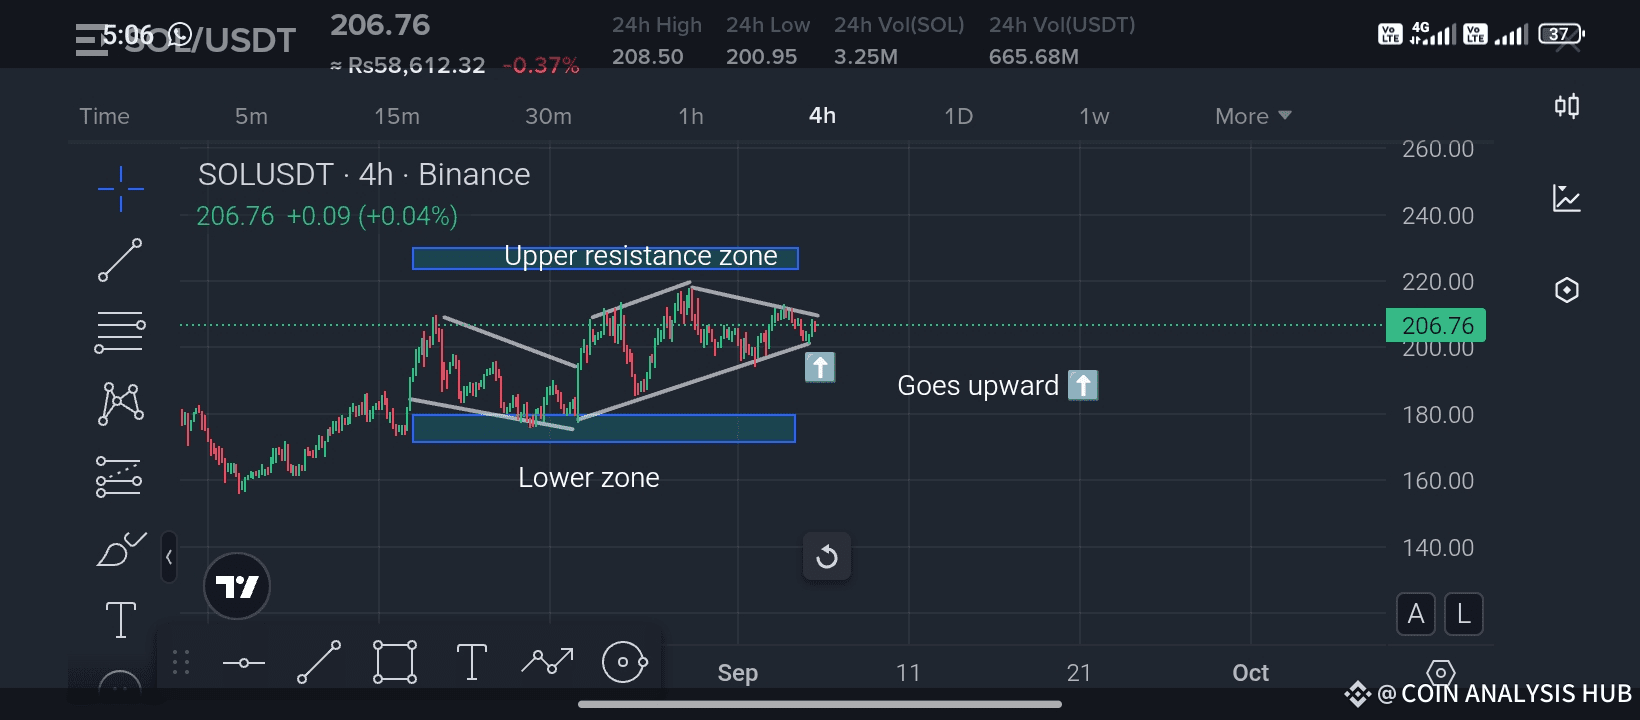
Currently, SOL is trading around $206.76 after holding strong within a symmetrical wedge formation. This setup often signals that a major breakout is near. Let’s break it down step by step for a clear trader’s perspective:
🔹 Upper Resistance Zone: Around $215–220, SOL has faced repeated rejections. This is the key level to watch for a bullish breakout confirmation.
🔹 Lower Zone / Demand Area: Around $190–195, buyers have consistently stepped in to protect this support. As long as this zone holds, the bullish structure remains intact.
🔹 Pattern Formation: The price is coiling within a wedge, which suggests price compression and reduced volatility. Historically, this often leads to explosive moves once a breakout happens.
🔹 Indicators & Momentum: Volume is relatively low, but a surge in buying volume near resistance could be the trigger for SOL to aim for $230+ targets in the short term.
📈 Trading Outlook:
If SOL breaks above the upper resistance zone, the next targets could be $225 – $235.
If it fails and rejects, a retest of the $195 lower zone is possible, where new buyers may enter.
⚡ Trader’s Tip:
Patience is key in wedge formations. Always wait for a breakout confirmation with strong volume before entering a position. Breakouts without volume can often be fakeouts.
💡 If you enjoyed this analysis and found it helpful, don’t forget to:
👉 Like this post ❤️
👉 Share it with fellow traders 🔄
👉 Follow for more real-time trader’s eye analysis 👀
Your support helps this channel grow and motivates me to bring even sharper insights daily. 🚀🔥
---#USNonFarmPayrollReport #MarketPullback
#ListedCompaniesAltcoinTreasury
Best of luck 🤞 🍀 🤞
