📊 Trader’s Eye Technical Analysis – EIGEN/USDT (4H Chart) 📊
Currently, EIGEN/USDT is trading around 1.348 USDT on Binance, and the price structure is giving us some important technical clues.
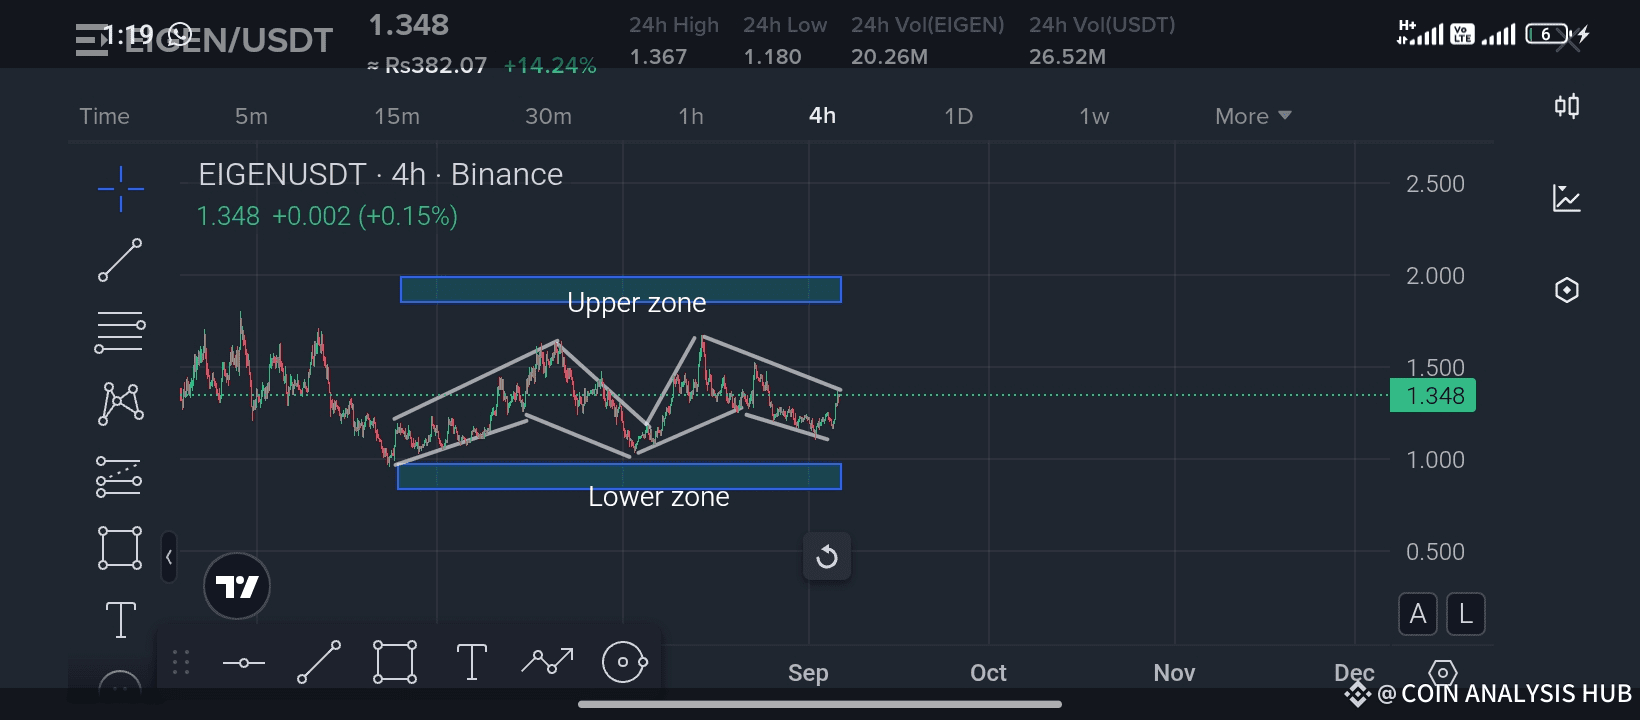
🔹 Chart Overview:
Price action has been moving between two clear zones:
✅ Upper Zone (around 1.45 – 1.55) – acting as strong resistance.
✅ Lower Zone (around 1.15 – 1.20) – acting as strong support.
The market recently respected both zones and is now consolidating inside a descending channel, signaling pressure but also possible breakout scenarios.
🔹 Key Observations:
1. Price tested the upper resistance zone multiple times but failed to break higher – showing strong sellers around that area.
2. The lower zone support has held very well, preventing further downside, which indicates accumulation at lower levels.
3. Currently, the price is sitting near the mid-range of the channel (around 1.34). This is a neutral zone, meaning traders should watch closely for breakout direction.
🔹 What’s Next?
A break above the channel could trigger momentum toward the upper zone near 1.50 – a bullish signal.
A rejection or breakdown could send the price back to test the lower zone near 1.20 – a bearish continuation.
🔹 Trader’s Tip:
For swing traders, the safest play is to wait for a clear breakout of the channel before entering.
Risk management is key here: setting stop-losses below the support zone or above resistance can protect capital.
📌 Final Thoughts:
EIGEN is trading in a tight range between strong zones. Smart traders should stay patient, track breakout confirmations, and avoid chasing uncertain moves.
👉 If you found this analysis useful, don’t forget to LIKE ❤️, SHARE 🔁, and FOLLOW ✅ my channel for more trader’s eye catching technical updates. Your support motivates me to bring even deeper analysis every day! 🚀
#ListedCompaniesAltcoinTreasury
Best of luck 🍀 🤞 🍀 🤞
