
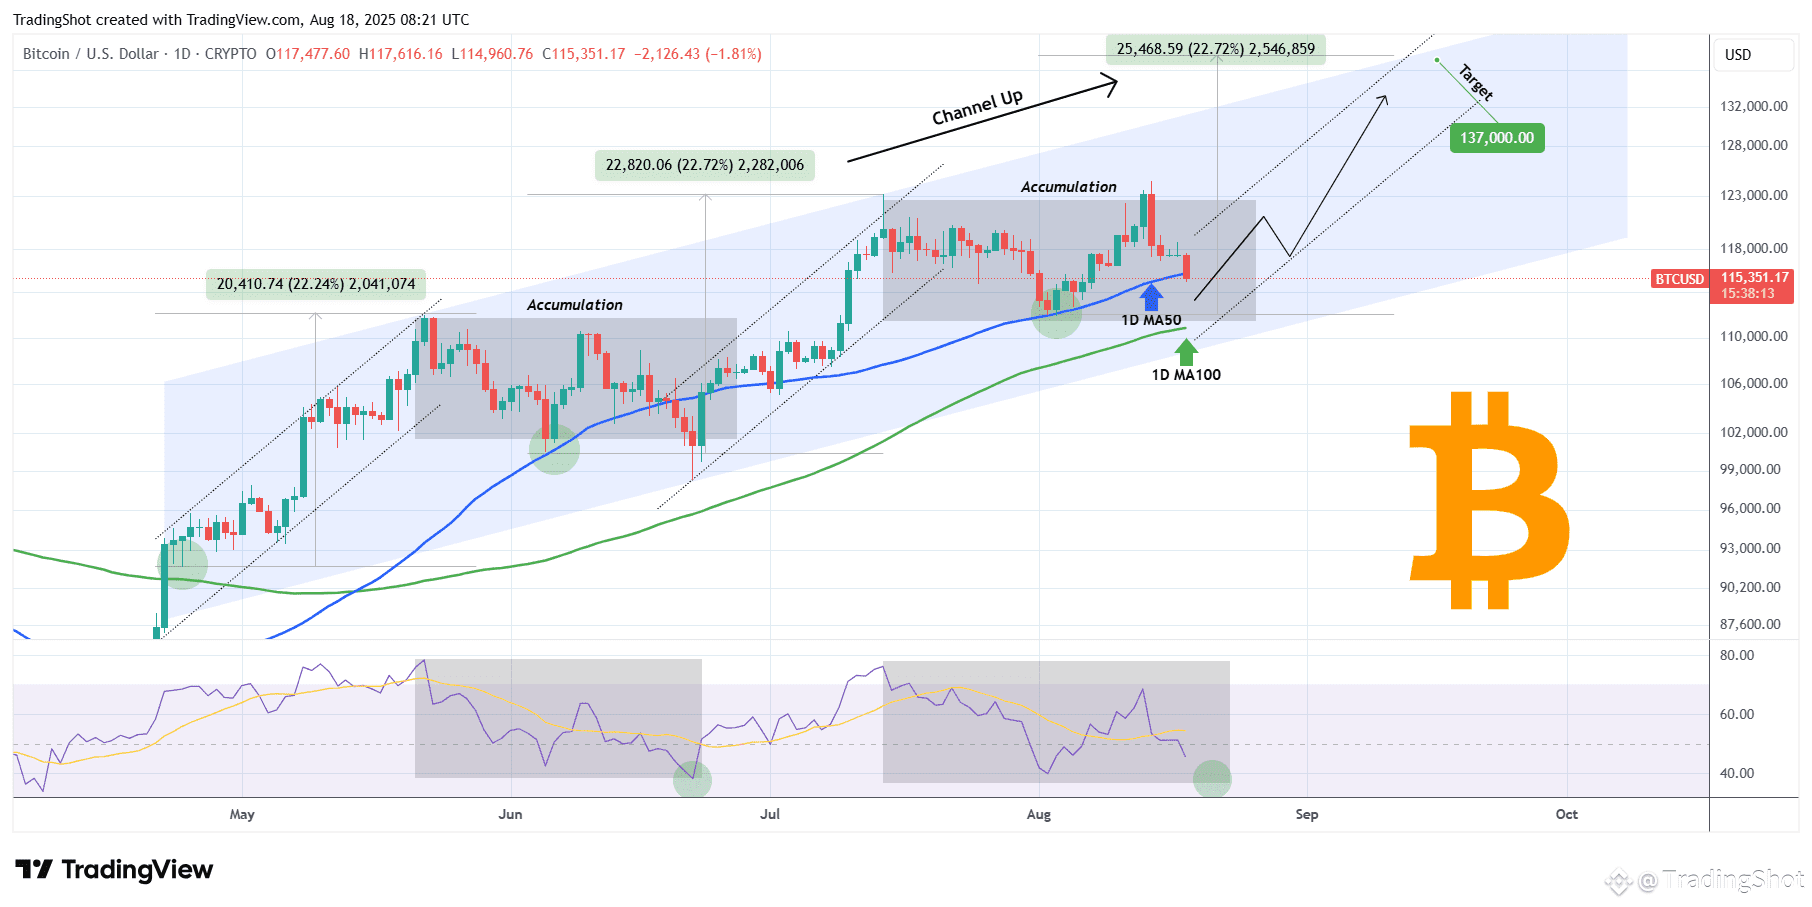
Bitcoin (BTCUSD) broke today below its 1D MA50 (blue trend-line) for the first time since July 02, having previously rebounded on it (August 02) on a perfect technical bounce that delivered a new All Time High (ATH).
Naturally, the 1D MA50 is the first medium-term line of Support and last time it broke convincingly, the price found a bottom (June 22) closer to the 1D MA100 (green trend-line). That was during BTC's previous Accumulation Phase of the 4-month Channel Up.
If that pattern is repeated, then Bitcoin's next Support could be within 112000 - 111000. On top of that, it would be useful to keep an eye on the 1D RSI, which is printing a pattern similar to he previous Accumulation Phase that bottomed on the 39.00 level.
As far as the next High is concerned, if it repeats the +22.72% rise that the previous Bullish Legs delivered from the 1D MA50 contact, then we're potentially looking at $137000 as the pattern's next Higher High.
Please LIKE 👍, FOLLOW ✅, SHARE 🙌 and COMMENT ✍ if you enjoy this idea!
