Coin Name : $BTC
Short Alert !!!
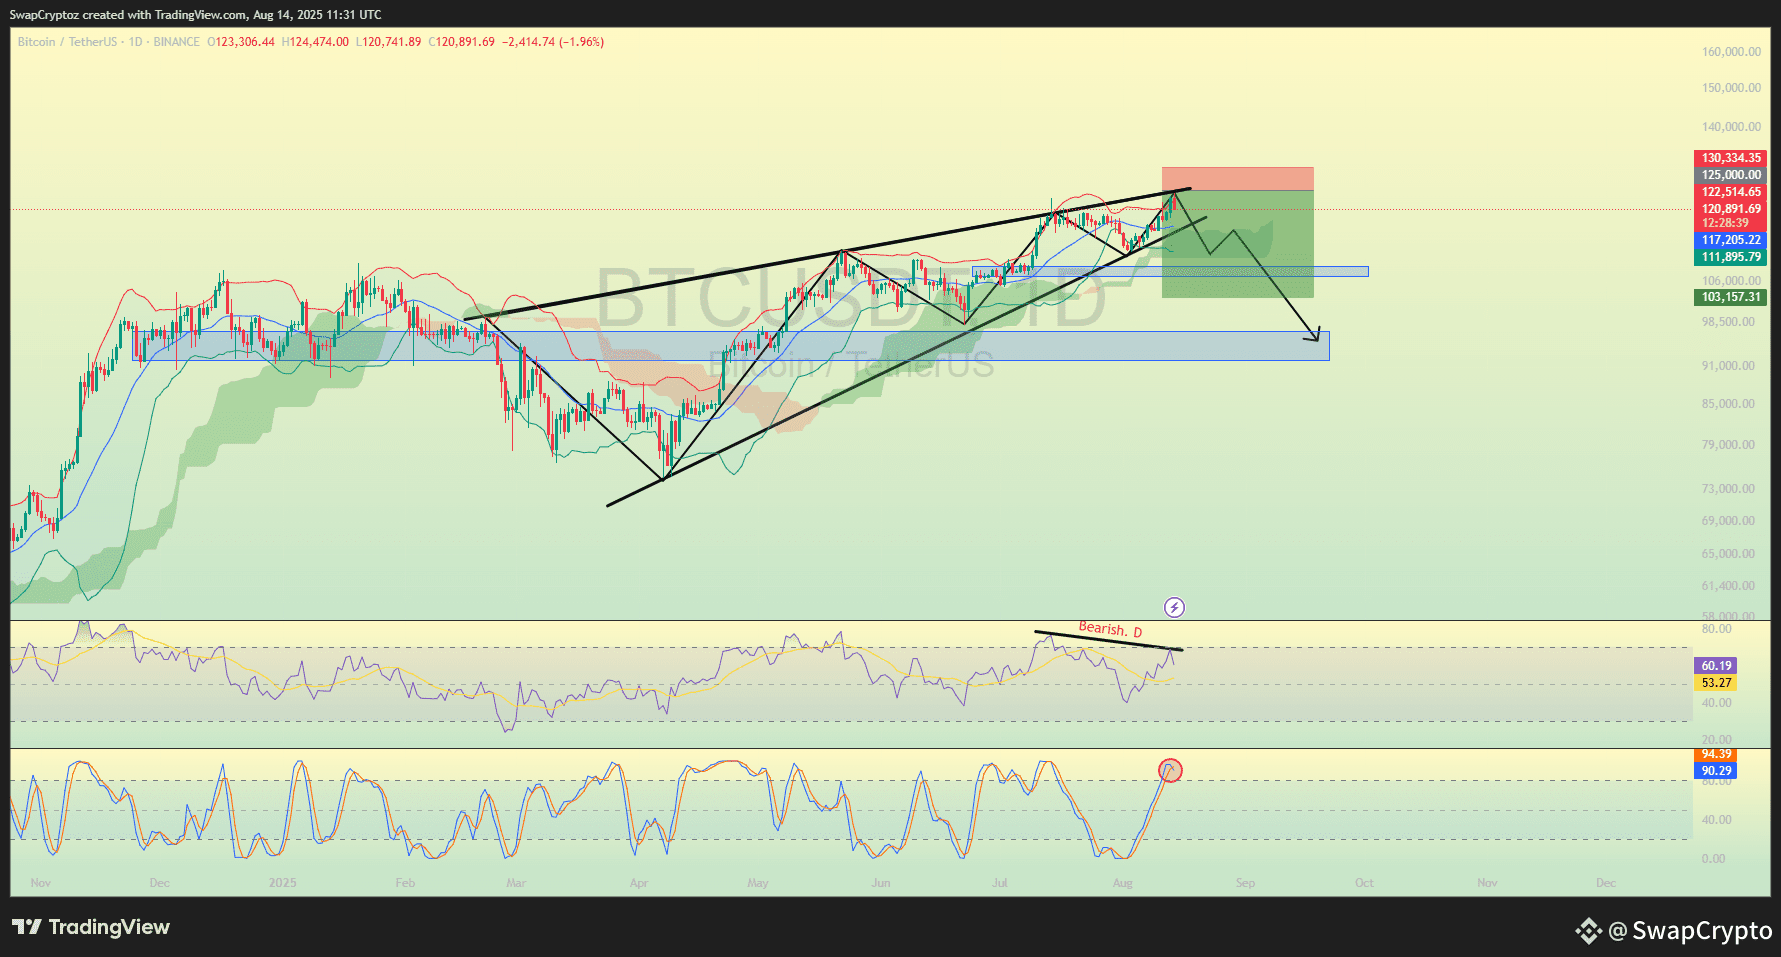
BTC is showing a rising wedge pattern with bearish divergence on RSI and overbought Stoch RSI, hinting at a possible breakdown toward lower support zones.
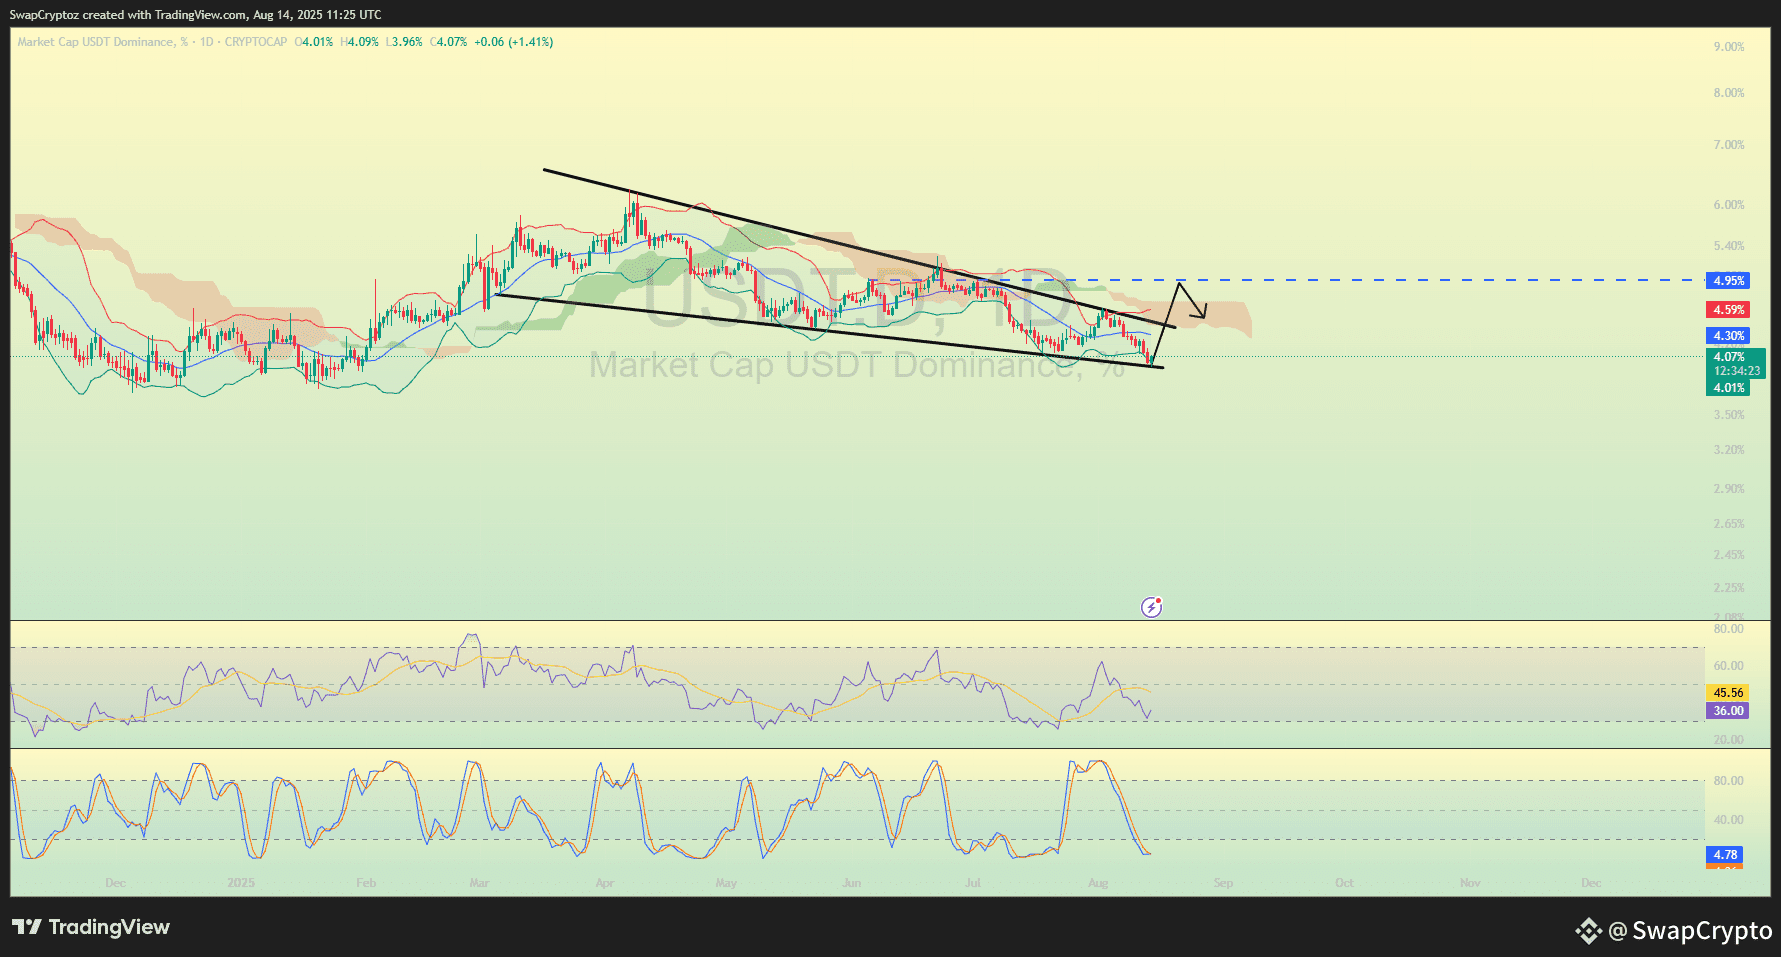
USDT dominance suggests a short-term bounce toward ~4.95%, which often means traders are moving into stablecoins.
If that plays out, BTC could indeed face short-term bearish pressure.
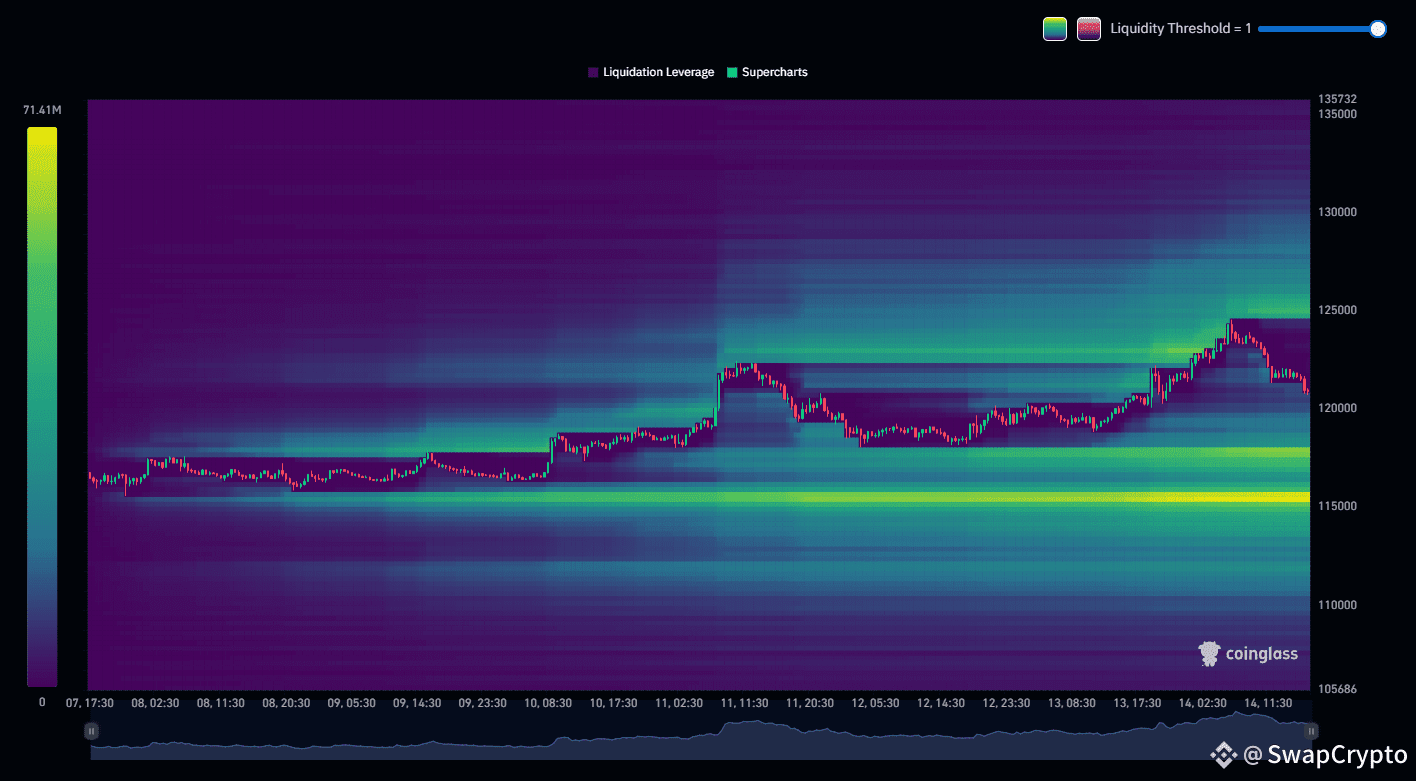
the heatmap clearly shows strong liquidity clusters around the 125K zone, which often act as magnets for price.
If BTC pushes up to sweep that liquidity, a sharp reversal could follow as market makers trigger stop hunts before driving price down.
Your "liquidity grab then dump" scenario fits the order flow behavior we’ve been seeing lately.
ENTRY PRICE : 125000.00
TP 1 : 113283.61
TP 2 : 107340.98
SL : 130443.46
For more details, click on my profile and check my BIO .
This signal is for spot trading only. If you're interested in future signals, join my Binance Live .
Simply click on my profile to join!
#swapcryptoz #BTC #BTC☀️ #btcuusdt