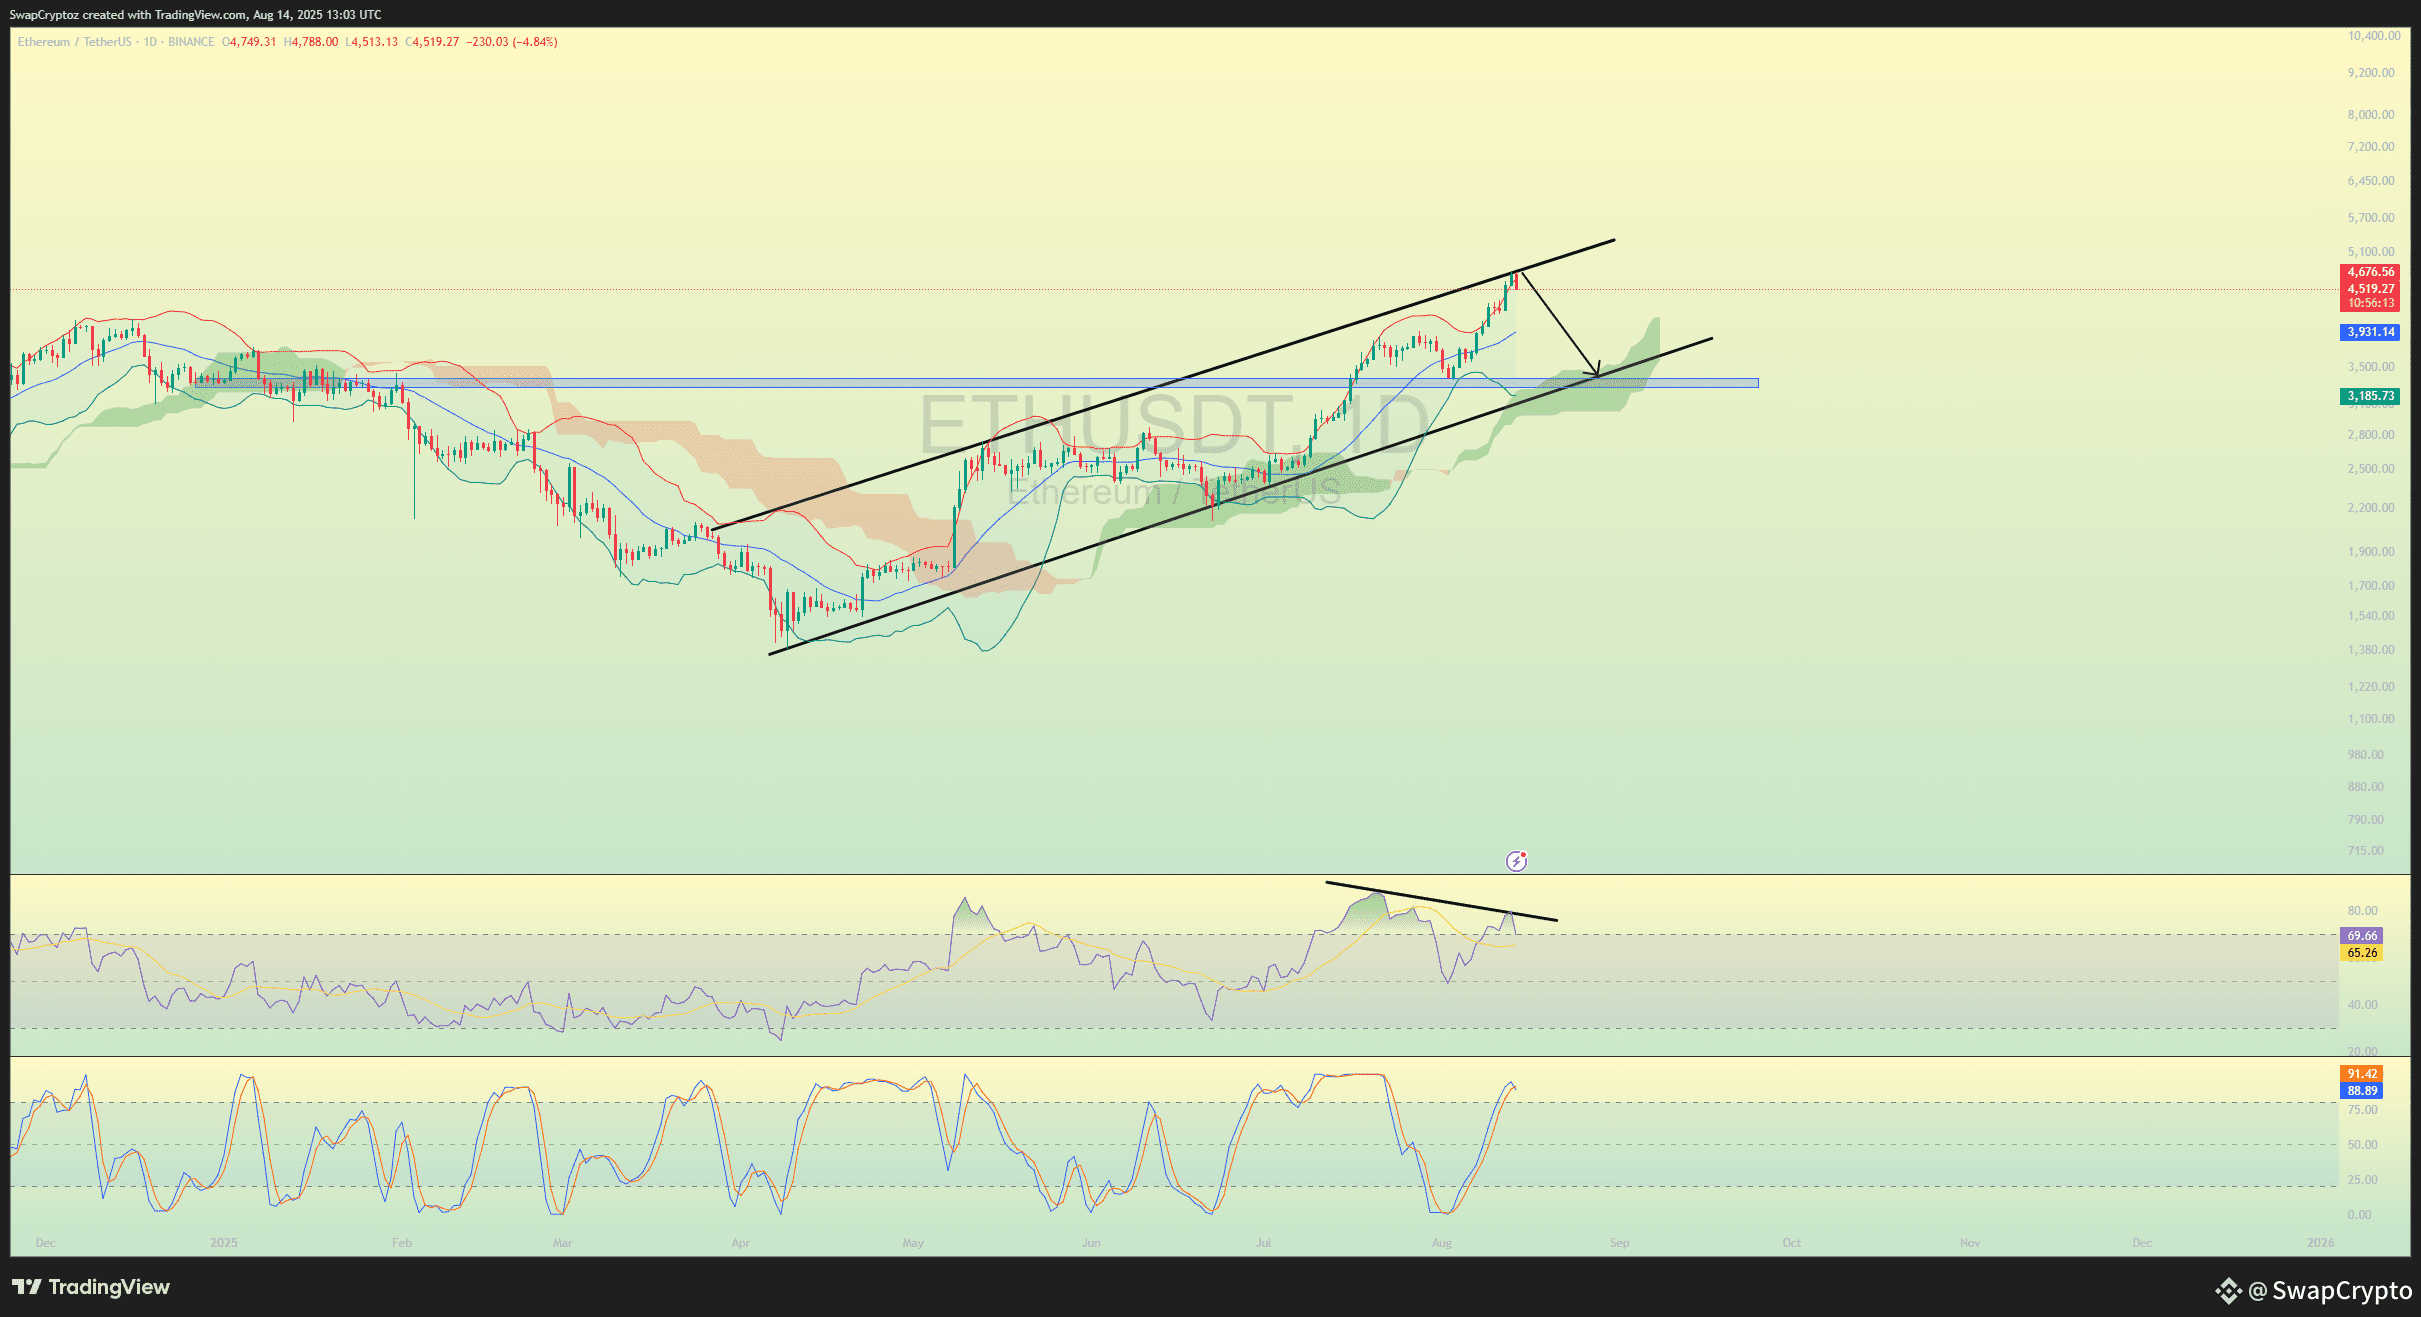
This chart of ETH shows the price is moving in an upward channel, but there's a bearish divergence on the RSI indicator at the bottom. This means while the price is making higher highs, the momentum is weakening, suggesting a potential pullback to the bottom of the channel.
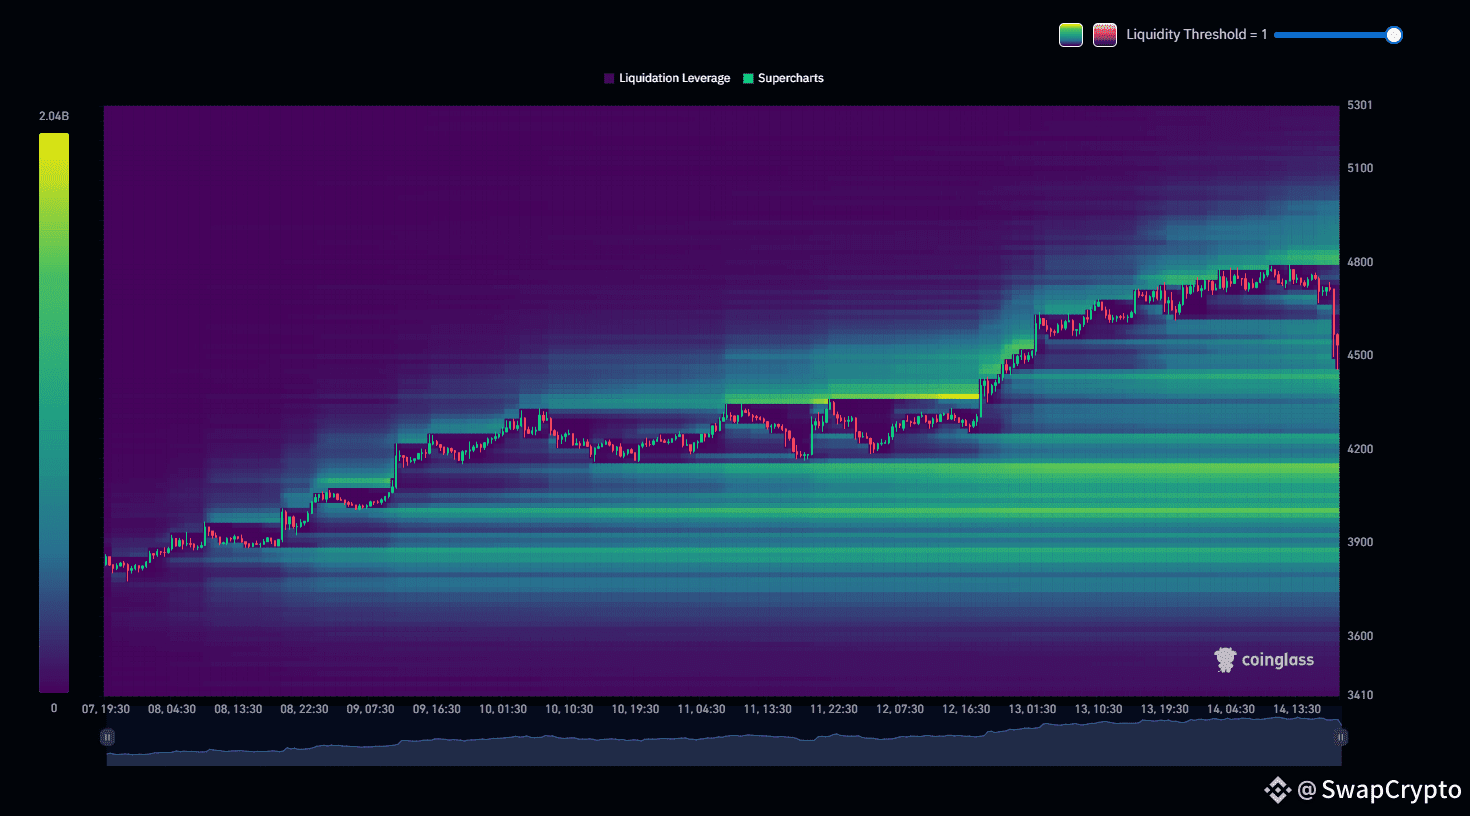
This liquidation heatmap for ETH shows a major cluster of liquidation orders (bets on the price going down) below the current price. This acts like a magnet, suggesting the price might be pulled down to trigger these liquidations before potentially moving back up.
ENTRY PRICE : 4662.45
TP 1 : 4196.64
TP 2 : 3667.18
SL : 5112.26
For more details, click on my profile and check my BIO .
This signal is for spot trading only. If you're interested in future signals, join my Binance Live .
Simply click on my profile to join!
