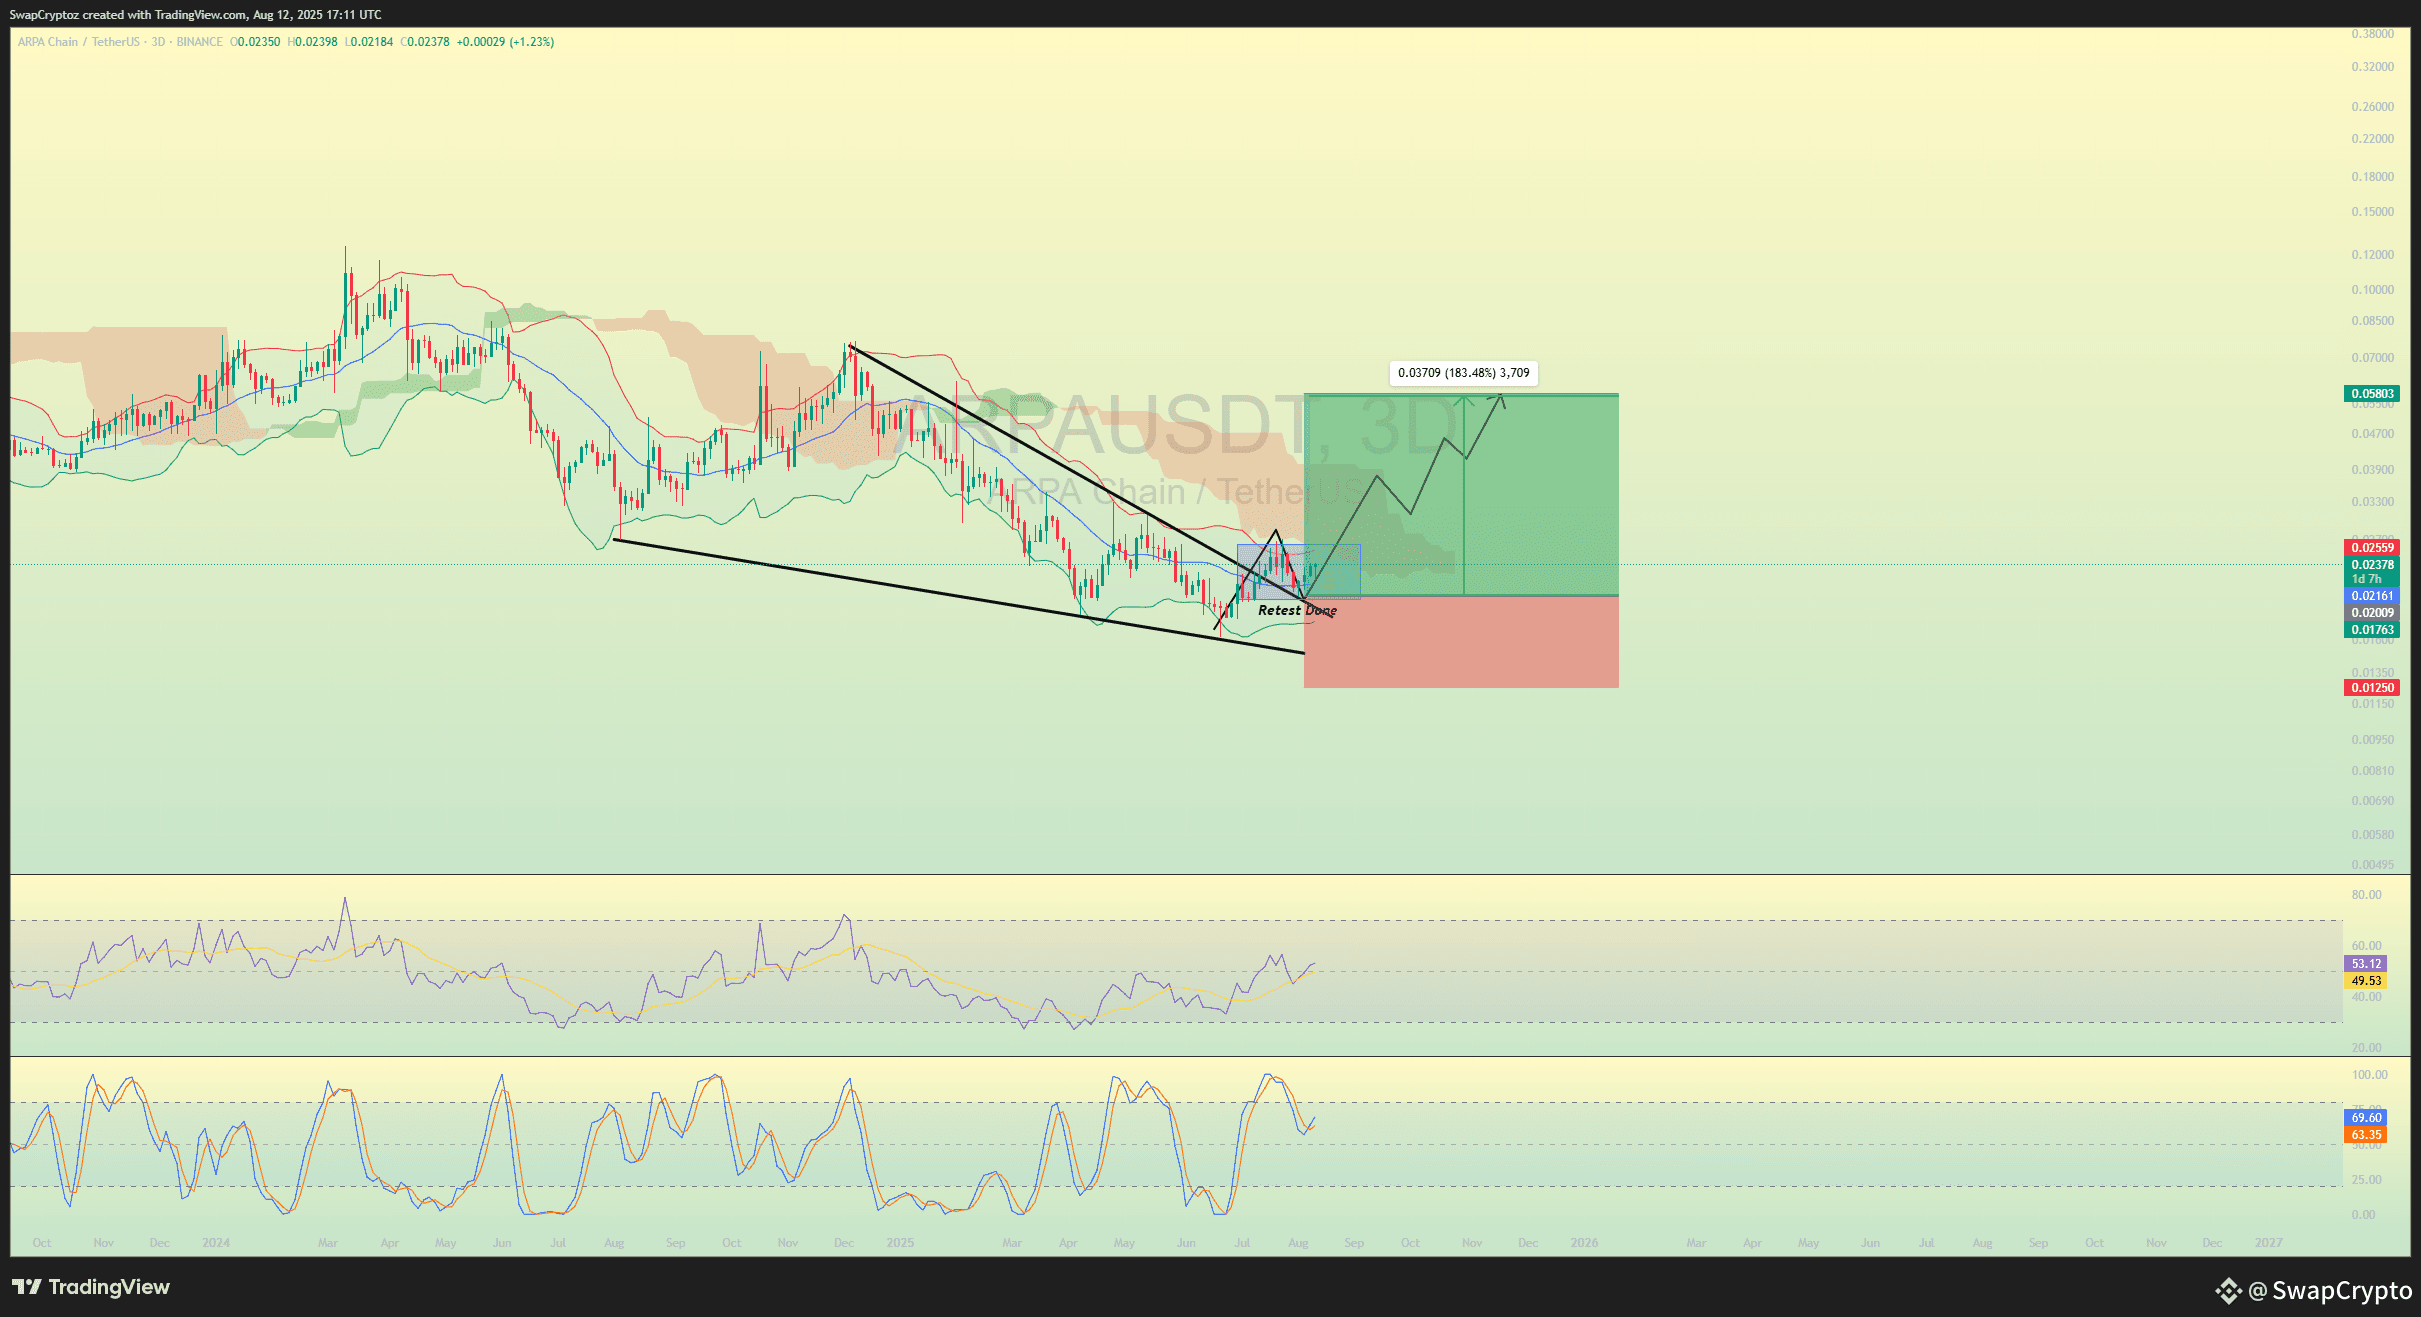
This chart shows the ARPA/USDT pair has broken out of a falling wedge pattern, which is a bullish sign. The price has retested the top of the wedge and is now expected to move upward. The green box shows the potential profit target, and the red box indicates the stop-loss level to manage risk.
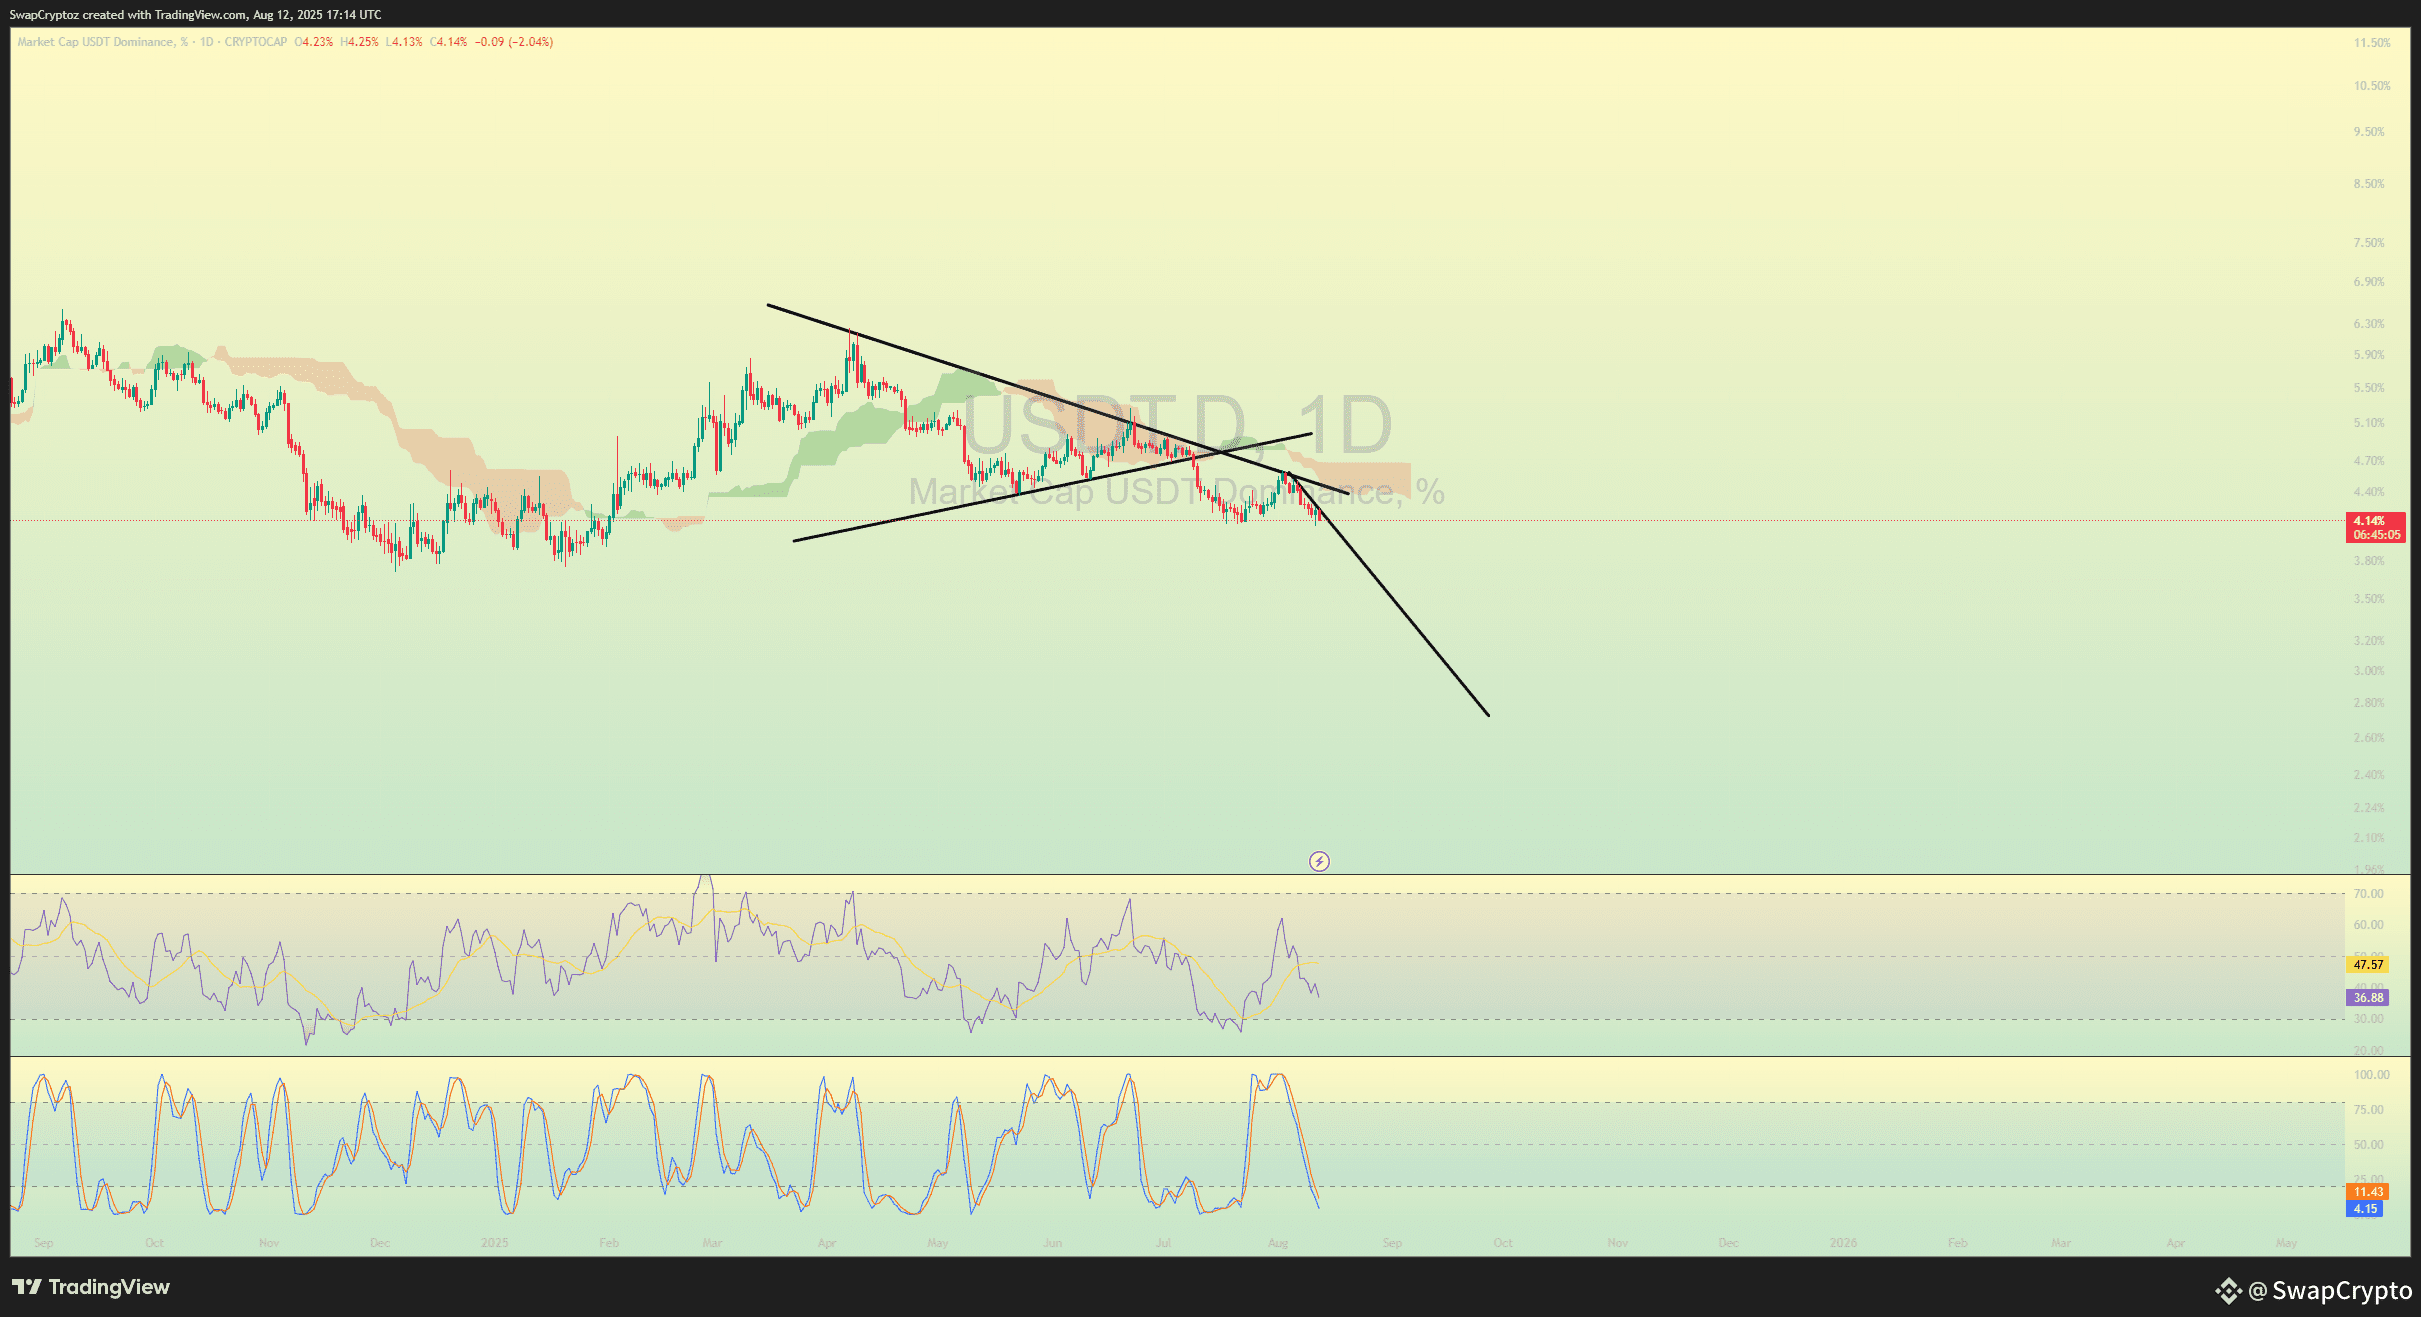
This chart shows USDT dominance is in a downtrend, which is a good sign for the crypto market because it suggests money is moving into other cryptocurrencies.
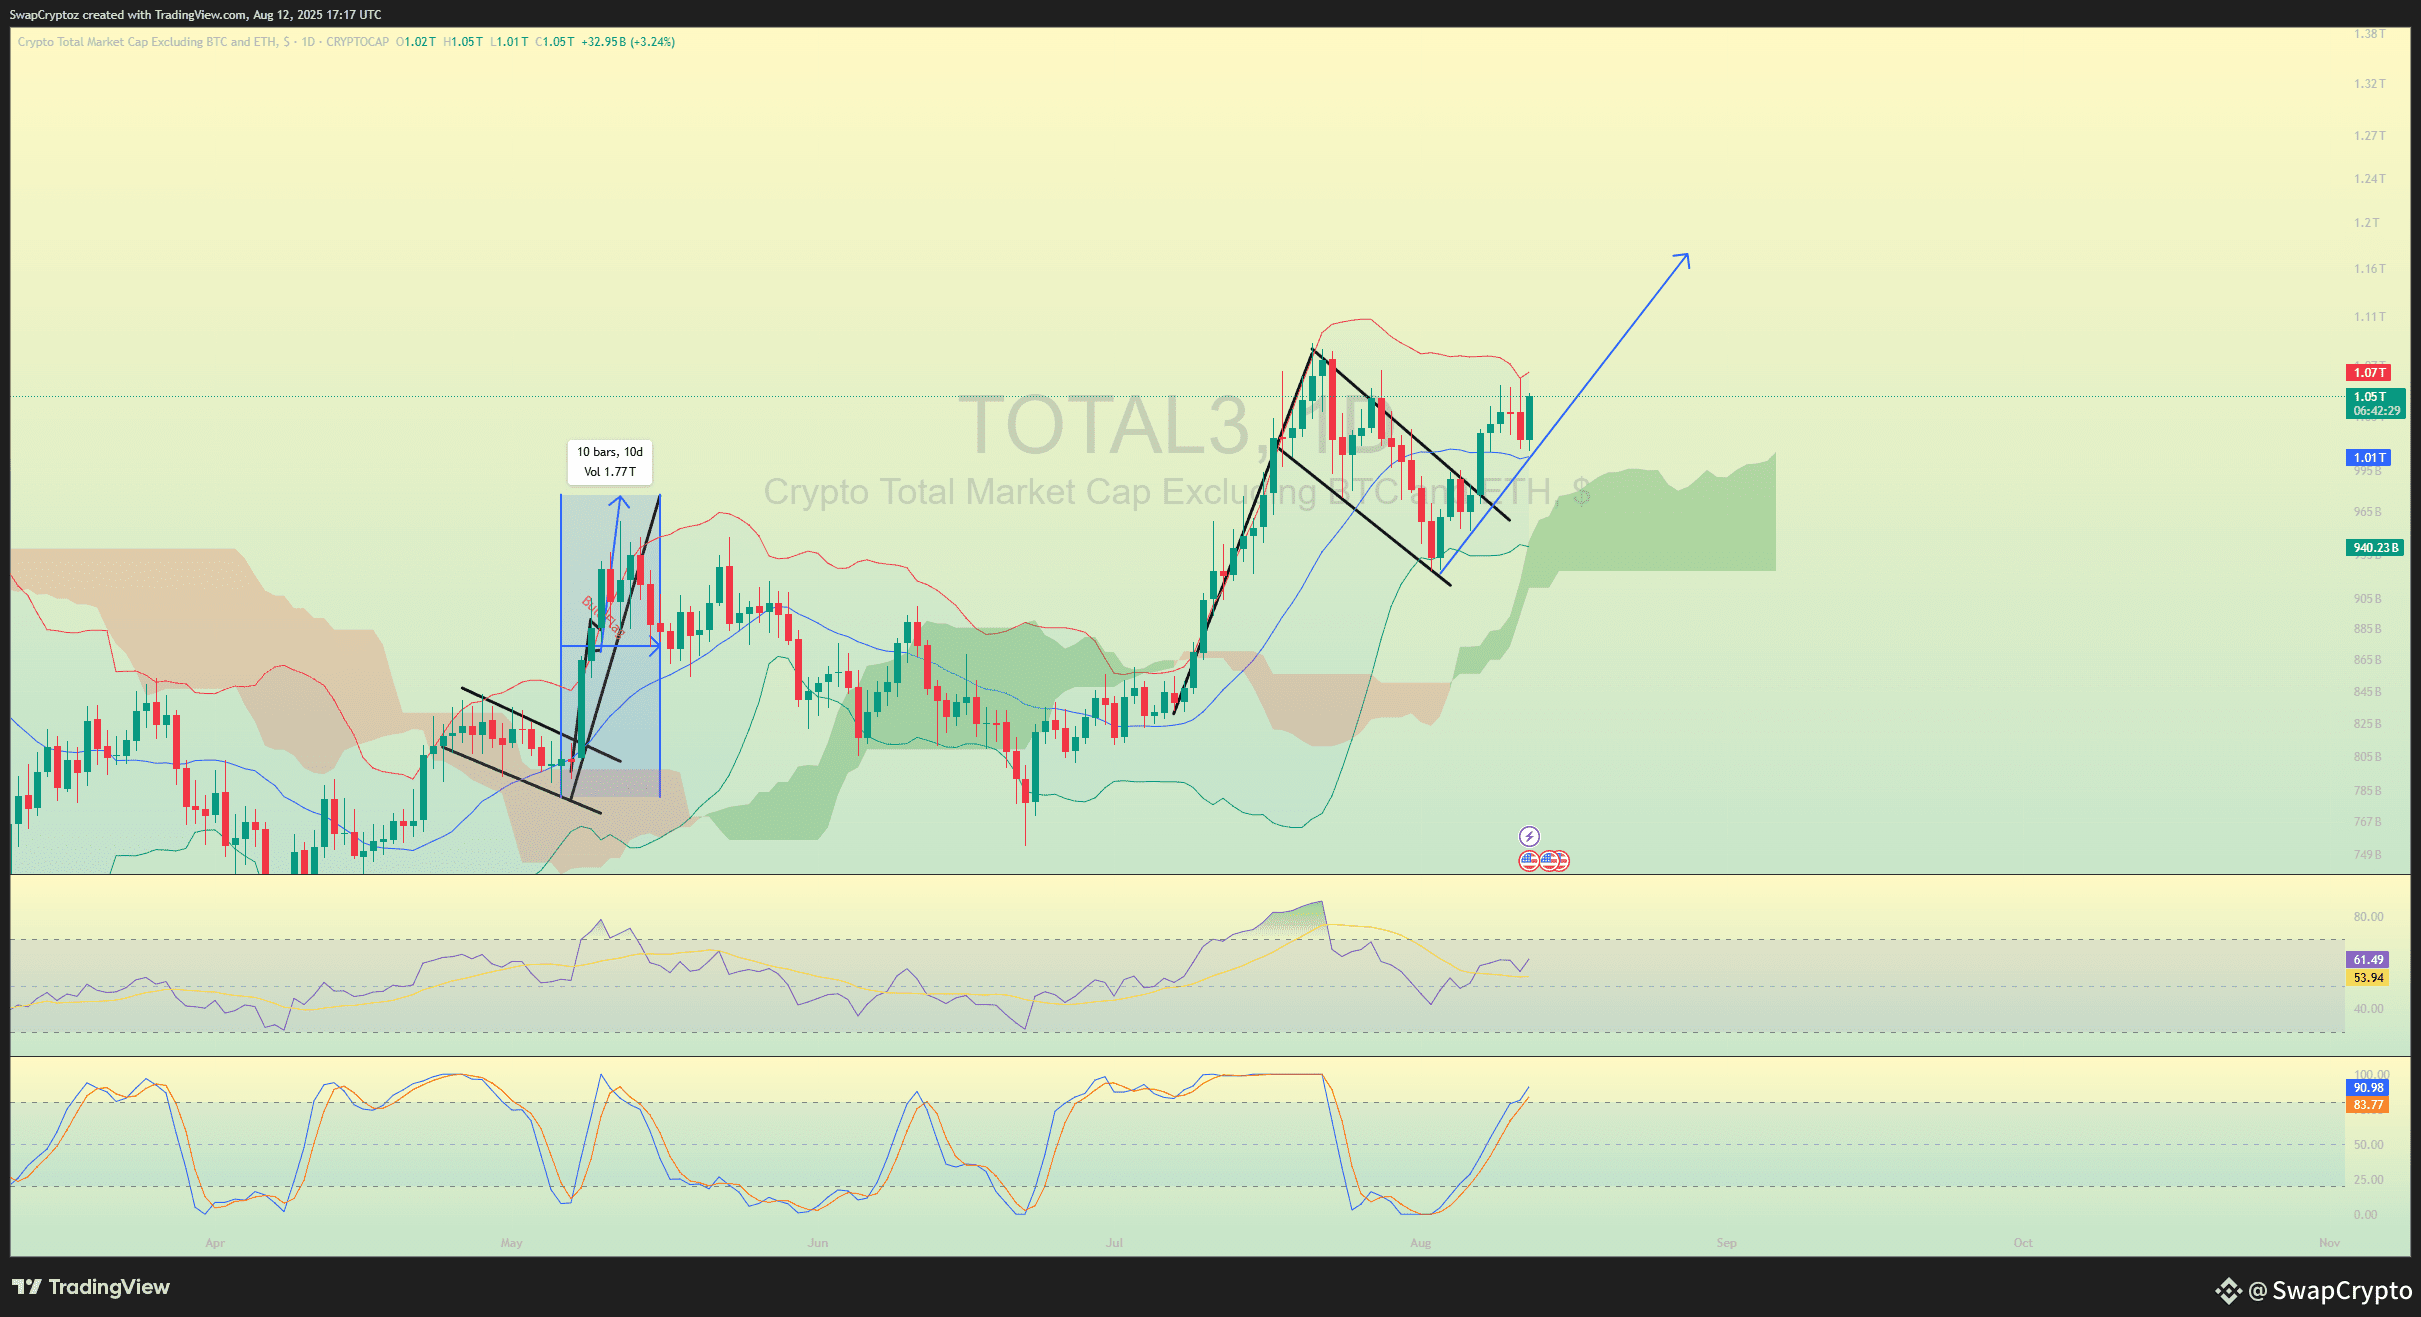
This chart of the total crypto market cap shows a bullish flag pattern, suggesting the market is likely to break out and continue its upward trend. So I think ARPA coin also Bullish .
ENTRY PRICE : 0.02034
TP 1 : 0.03768
TP 2 : 0.04917
SL : 0.01245
For more details, click on my profile and check my BIO .
This signal is for spot trading only. If you're interested in future signals, join my Binance Live .
Simply click on my profile to join.
#ARPA #ARPAUSDT🚀🚀🚀 #arpausdt