Bitcoin trading volume has surged significantly, dragging down other markets

The Bitcoin market has faced tremendous selling pressure, as a 400% surge in volume is typically a sign of structural weakness and a precursor to market volatility. Over the past few weeks, Bitcoin has formed a strong bullish structure, breaking out of a long-term consolidation area and trending upwards towards a target of $122,000.
However, this wave of increase was suddenly reversed as it approached a local high, followed by significant selling. Bitcoin's current trading price is around $115,700, down over 5% from recent highs. It has broken below the rising support trend line, facing greater downside risk. Although the price remains above the 50-day moving average ($114,945), the significant increase in volume during this drop strongly indicates market dispersion rather than strong market activity.
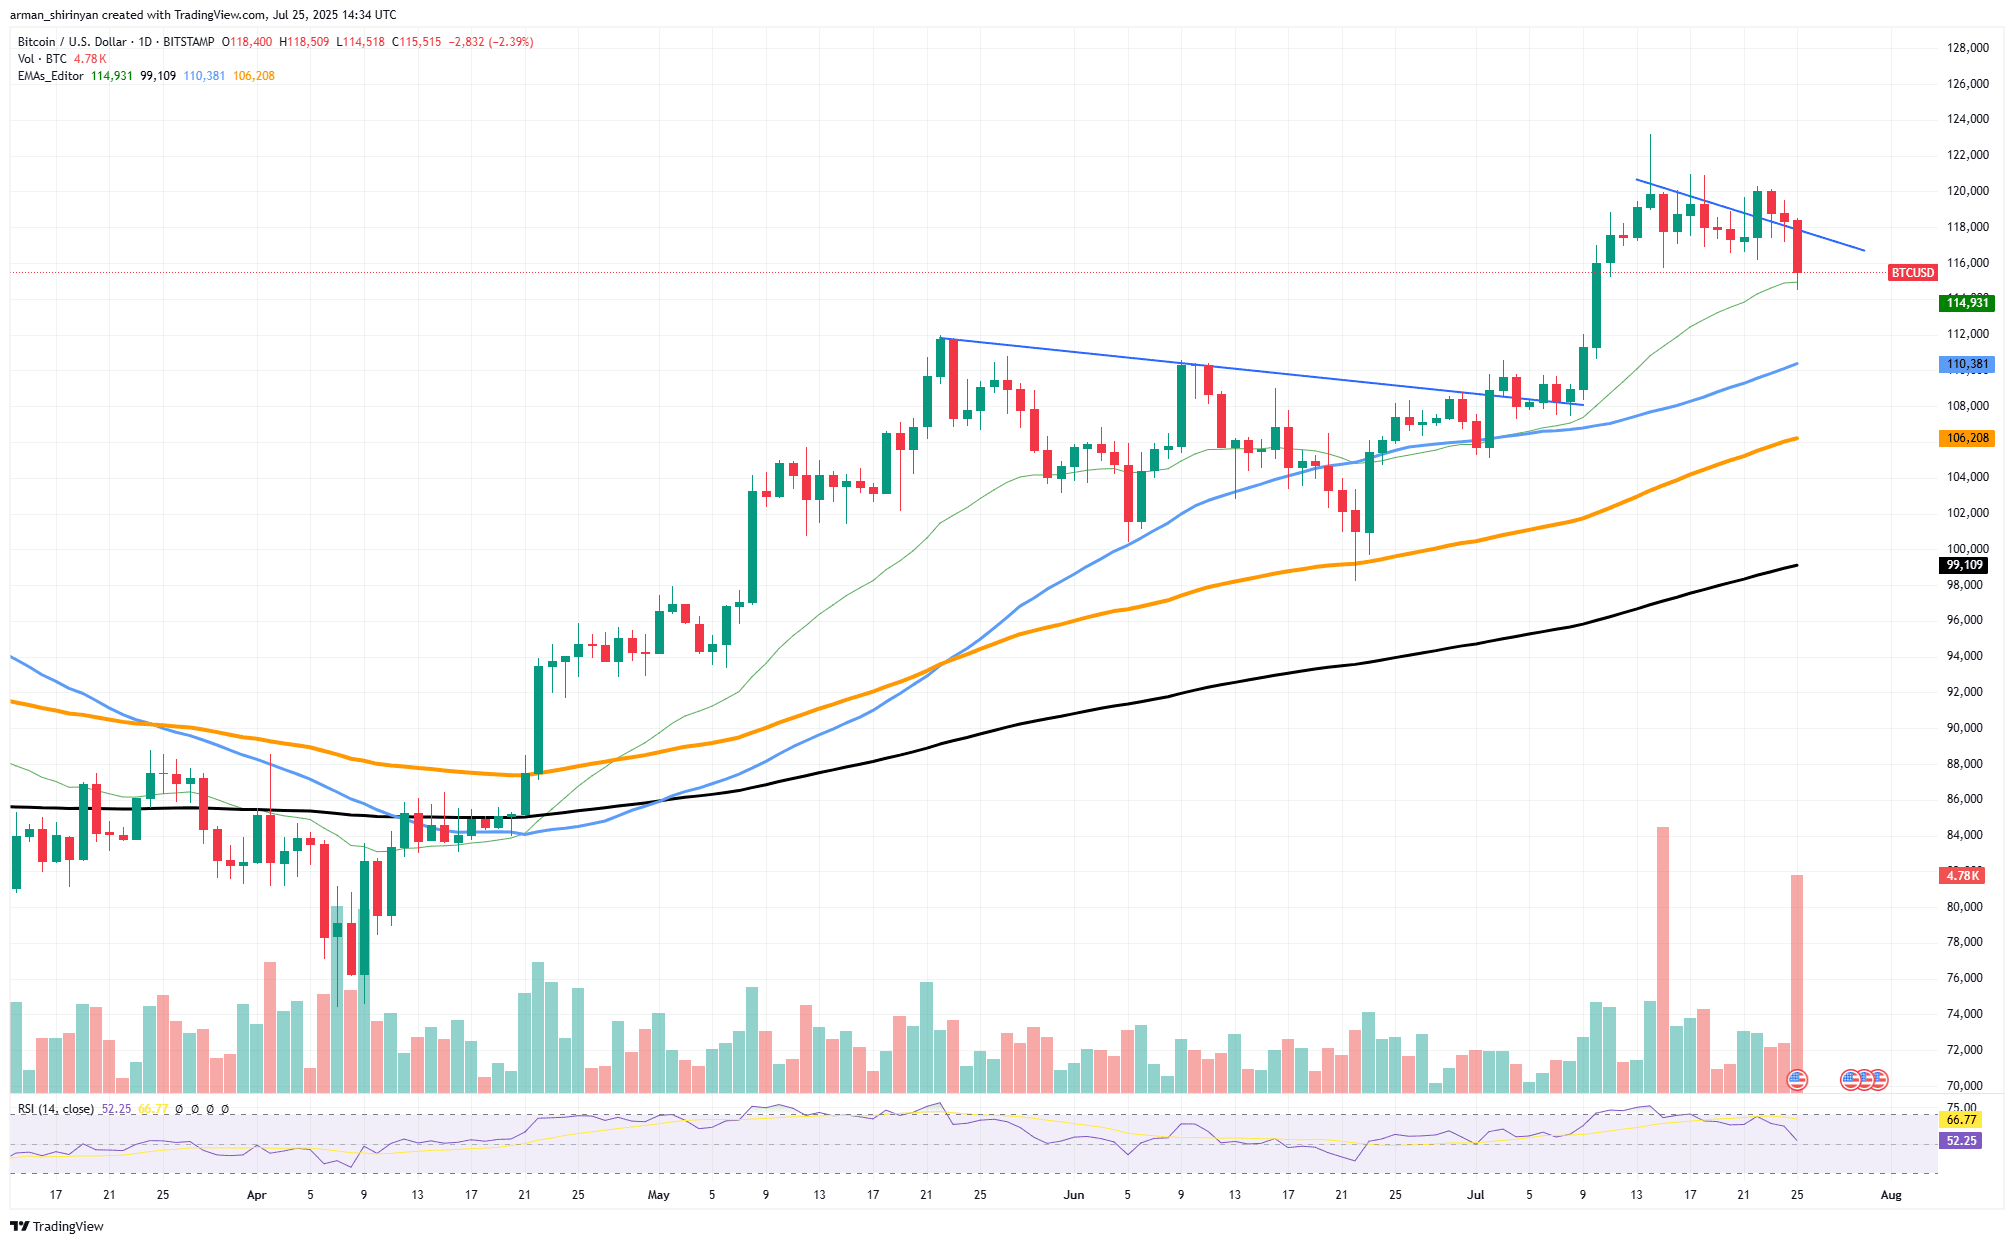
The Relative Strength Index (RSI) is neutral but has dropped to 52.80, indicating that momentum is waning. Despite the impressive surge in volume, it raises concerns when it occurs alongside weak rather than strong prices. In a rising trend, increasing volume suggests strong investor confidence. A breakthrough in volume during a pullback usually signals forced liquidations or panic selling.
Structurally, Bitcoin still has the potential to drop to the 100-day moving average ($110,385) or even the 200-day moving average ($106,211) without shaking the overall bull market. However, this latest trend raises questions about the sustainability of the short-term bullish outlook. Currently, Bitcoin remains in turmoil, oscillating between short-term uncertainty and long-term optimism.
It is advisable to proceed cautiously until buyers clearly re-enter and Bitcoin returns to an upward trend line. This downturn is caused by a 400% surge in volume rather than a breakthrough. Unless the volume slows or reverses with a price rebound, Bitcoin may experience more pain before the next round of increase.
XRP is under pressure
XRP is currently experiencing its first significant pullback after a strong parabolic move that once surged above $3.60. With consecutive bearish candlesticks, the price has retreated to around $3.10. However, compared to the impulsive panic selling commonly seen in altcoin cycles, this pullback resembles a healthy cooling-off period rather than a crash.
According to the daily chart, XRP remains above its 21-day moving average ($2.91), which has provided reliable short-term support during market uptrends. More importantly, the overall structure remains bullish. The recent surge occurred on high volume, indicating that the market is accumulating funds rather than speculative bubbles.
Additionally, despite the declining volume, it has not completely disappeared, indicating that buyers have not given up. The RSI has reset momentum without breaking the trend, currently at 59, having moved out of the overbought territory. After this reset, the market has a chance to stabilize before the next round of increase. The range between $2.90 and $3.00 is a key level to watch in the future.
If XRP continues to consolidate above this support level, it may form a new breakout base. Falling below the 50-day moving average of $2.49 would signal a more significant pullback for XRP to the previous range. Currently, the pullback remains controlled and orderly. Such moderate pullbacks usually lead to price corrections.
As long as sellers completely empty out and buyers regain confidence, XRP seems poised for another surge, thanks to recent trading volume, moving average support levels, and favorable RSI trends. If important support levels hold, a bullish reversal could occur before August, but sideways consolidation is expected in the short term.
Ethereum maintains its dominance
Ethereum's resistance to market attraction persists. ETH surged to the $3,800 mark, with its nearly vertical trend solidifying its dominance in the cryptocurrency space, while Bitcoin and other major altcoins show signs of weakness or have entered a correction phase. The context is as noteworthy as the price performance.
Despite an overall pullback in the cryptocurrency market, low-volume fluctuations, and consolidation, Ethereum has decisively broken through resistance levels. The daily chart shows that Ethereum has strongly broken out of range-bound movements seen for several months, surpassing the $3,200-$3,300 range, followed by stable bullish candlesticks and increasing volume. With the price surge, the Relative Strength Index (RSI) also broke out of the overbought zone, currently close to 77, indicating a strengthening market rather than weakness—especially underpinned by strong volume support.
The moving averages remain entirely optimistic. The 21-day moving average is at a comfortable level of $3,210, potentially forming a short-term support level. The 50-day and 100-day moving averages are around $2,800 and $2,680, respectively, providing a deeper safety net below this average. As long as the price remains within these two ranges, the upward trend will continue.
If this divergence from the market continues, Ethereum may reclaim its dominant position in price and market share. The next market to watch is the ETH/BTC pair; any significant fluctuations in this pair will confirm a larger capital shift towards Ethereum.
I need fans, you need references. Guessing is not as good as paying attention.


