The market may see a long-awaited recovery, but at the same time, the situation is not that good.

In recent weeks, XRP's price action has been volatile, soaring from below $2.30 to above $3.50. A double top pattern (a common bearish chart pattern) may form, but the recent trend of this asset may overshadow this new technical risk. Based on the current price structure, XRP experienced a significant drop after breaking around $3.50 and is currently rebounding.
The continued activity of bulls is reflected in the encouraging rebound above $3.20. The key is that if the price rebounds to the $3.50 area and fails to maintain the breakout, it could form a second peak, i.e., the second top of the double top, which may signal a short-term or medium-term reversal.
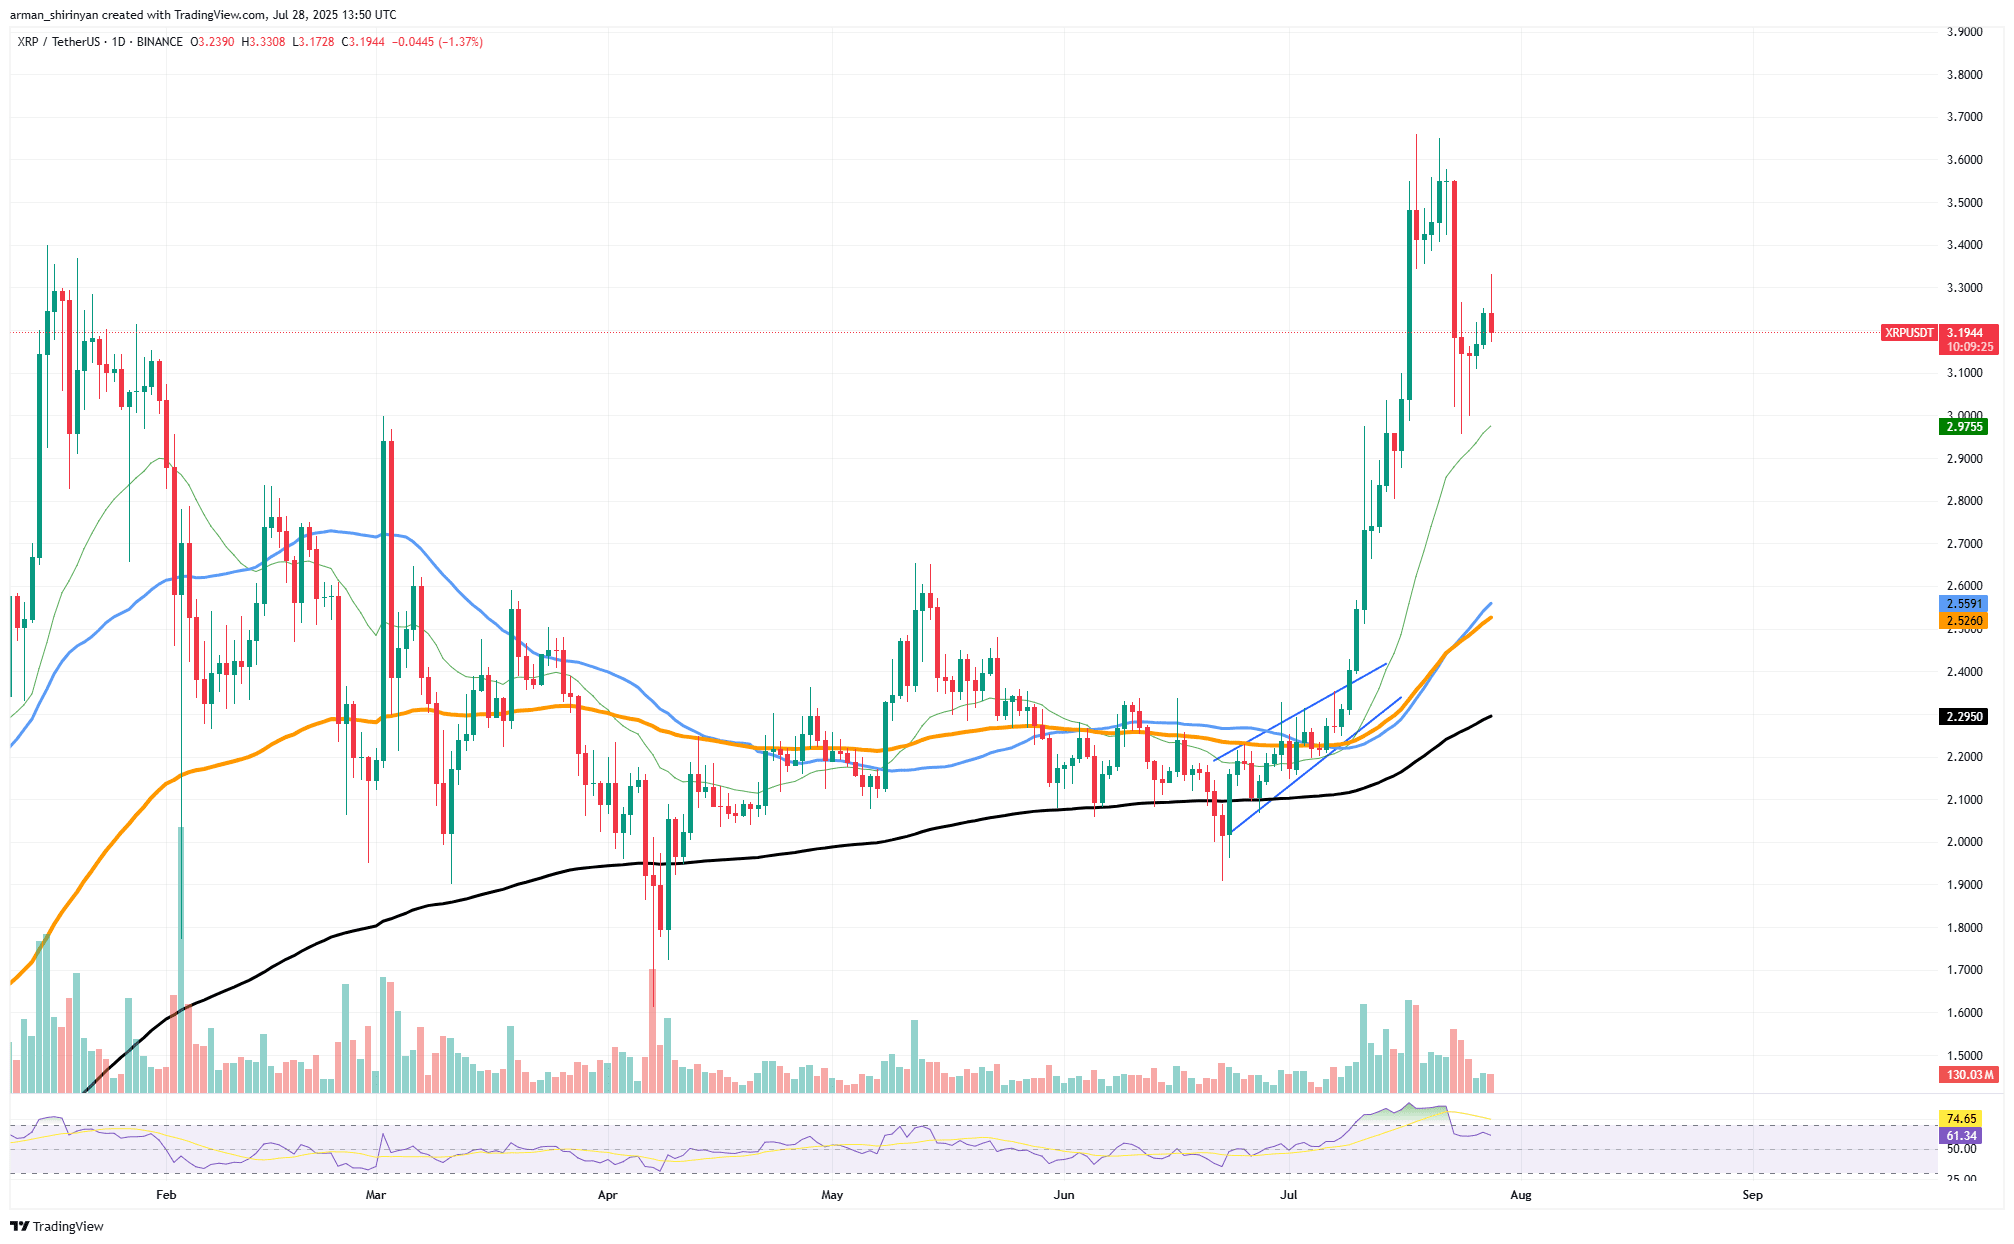
The Relative Strength Index (RSI) is approaching 75 again, which heightens market concerns. A strong RSI can indicate bullish momentum, but if it tests the highs again without a new breakout, it increases the likelihood of market fatigue. Trading volume is another important factor.
Although buying support is strong during the rise to $3.50, the recent increase in trading volume has slightly declined, which may indicate that investor interest is waning. If XRP does rise to $3.50 and stagnates or reverses at that level, traders should closely monitor the formation of lower highs and signs of distribution.
If it is confirmed that it breaks below the neckline between $3.00 and $3.10, it will confirm a double top, which could push XRP back to the support level of $2.60, close to the 50-day EMA, or even lower.
Ethereum continues to rise.
Ethereum does not seem to be slowing down. Since breaking out of a months-long consolidation range in early July, this second-largest cryptocurrency by market cap has been in a sustained bullish momentum. Currently, the price of ETH is $3,888, which has risen over 40% in recent weeks, with bulls continuing to dominate.
The breakout is perfect: Ethereum has immediately broken the previous resistance level of $2,900 with significant volume. The 50-day moving average and its position currently form a strong support area. Ethereum has reclaimed the 200-day moving average and strongly broken through the $3,300-$3,500 range, confirming a trend reversal and attracting aggressive buyers, further enhancing the upward momentum.
The real key is that there has been no significant pullback. Each consolidation has been brief and shallow, indicating strong demand. The RSI has reached the overbought zone of 82, but historically, during strong upward trends like this one, ETH can maintain its position for a considerable period before a significant pullback occurs.
Psychological resistance is approaching $4,000, which many traders may see as a short-term target. If Ethereum's price clearly breaks this resistance level, it could trigger FOMO-driven capital inflows, further pushing Ethereum's price up to around $4,400, which was the last local peak observed at the end of 2021.
Focus on the $3,300-$3,500 range, which serves as direct support for downward movement. Buyers may intervene at these levels, which also coincide with important moving averages if ETH declines. Unless there is a macro-level catalyst, Ethereum's upward momentum seems likely to continue. Strong momentum, factors encouraging trading volume, and an undeniable bullish market structure have emerged. So far, there are no warning signals — only a steady upward trend from reputable cryptocurrency assets.
Main target for Bitcoin.
Bitcoin has officially established $120,000 as a clear resistance level. After weeks of sustained increases and multiple retests, this digital gold still hovers around this technical and psychological ceiling, forming what seems to be a standard horizontal resistance zone.
In recent weeks, price movements have shown both fatigue and bullish intent. Despite Bitcoin's multiple intraday breaks above $120,000, it has failed to decisively close above that level, indicating significant selling pressure or profit-taking activities. The trading volume during these attempts was relatively low, which increases the likelihood that bulls may exhaust their momentum without a consolidation.
The current consolidation trend slightly below the resistance level is not necessarily bearish. Indicators like RSI are currently at a neutral level of 61, and the market may reset these indicators due to a healthy pause following a strong upward trend. Upward momentum still exists, with moving averages (especially the 50-day and 100-day EMA) continuing to rise, providing strong support at $115,000 and $111,000, respectively.
On the other hand, if the market fails to break through, it may further retrace to the support level of $111,000 to $108,000. Overall, Bitcoin's structural outlook is bullish. However, to maintain the upward momentum, stronger support is needed — especially with volume support, convincingly breaking through $120,000.


