The market will once again oscillate near local resistance levels, attempting to return to a bull market mode.

The price movement of Shiba Inu is consolidating above $0.0000134, indicating a critical moment. After a significant rise earlier this month, SHIB attempted to return to the $0.000015 area but faced strong resistance again near the 200-day moving average, leading to a local pullback.
SHIB is currently struggling to stabilize above the orange 100-day moving average, which constitutes soft support. The decline in volume indicates a lack of confidence among buyers, with momentum clearly weakening. The Relative Strength Index (RSI) has yet to show a clear trend direction, remaining neutral between 48 and 50. Investors are highly attentive to this, as it is a typical decision point for SHIB.
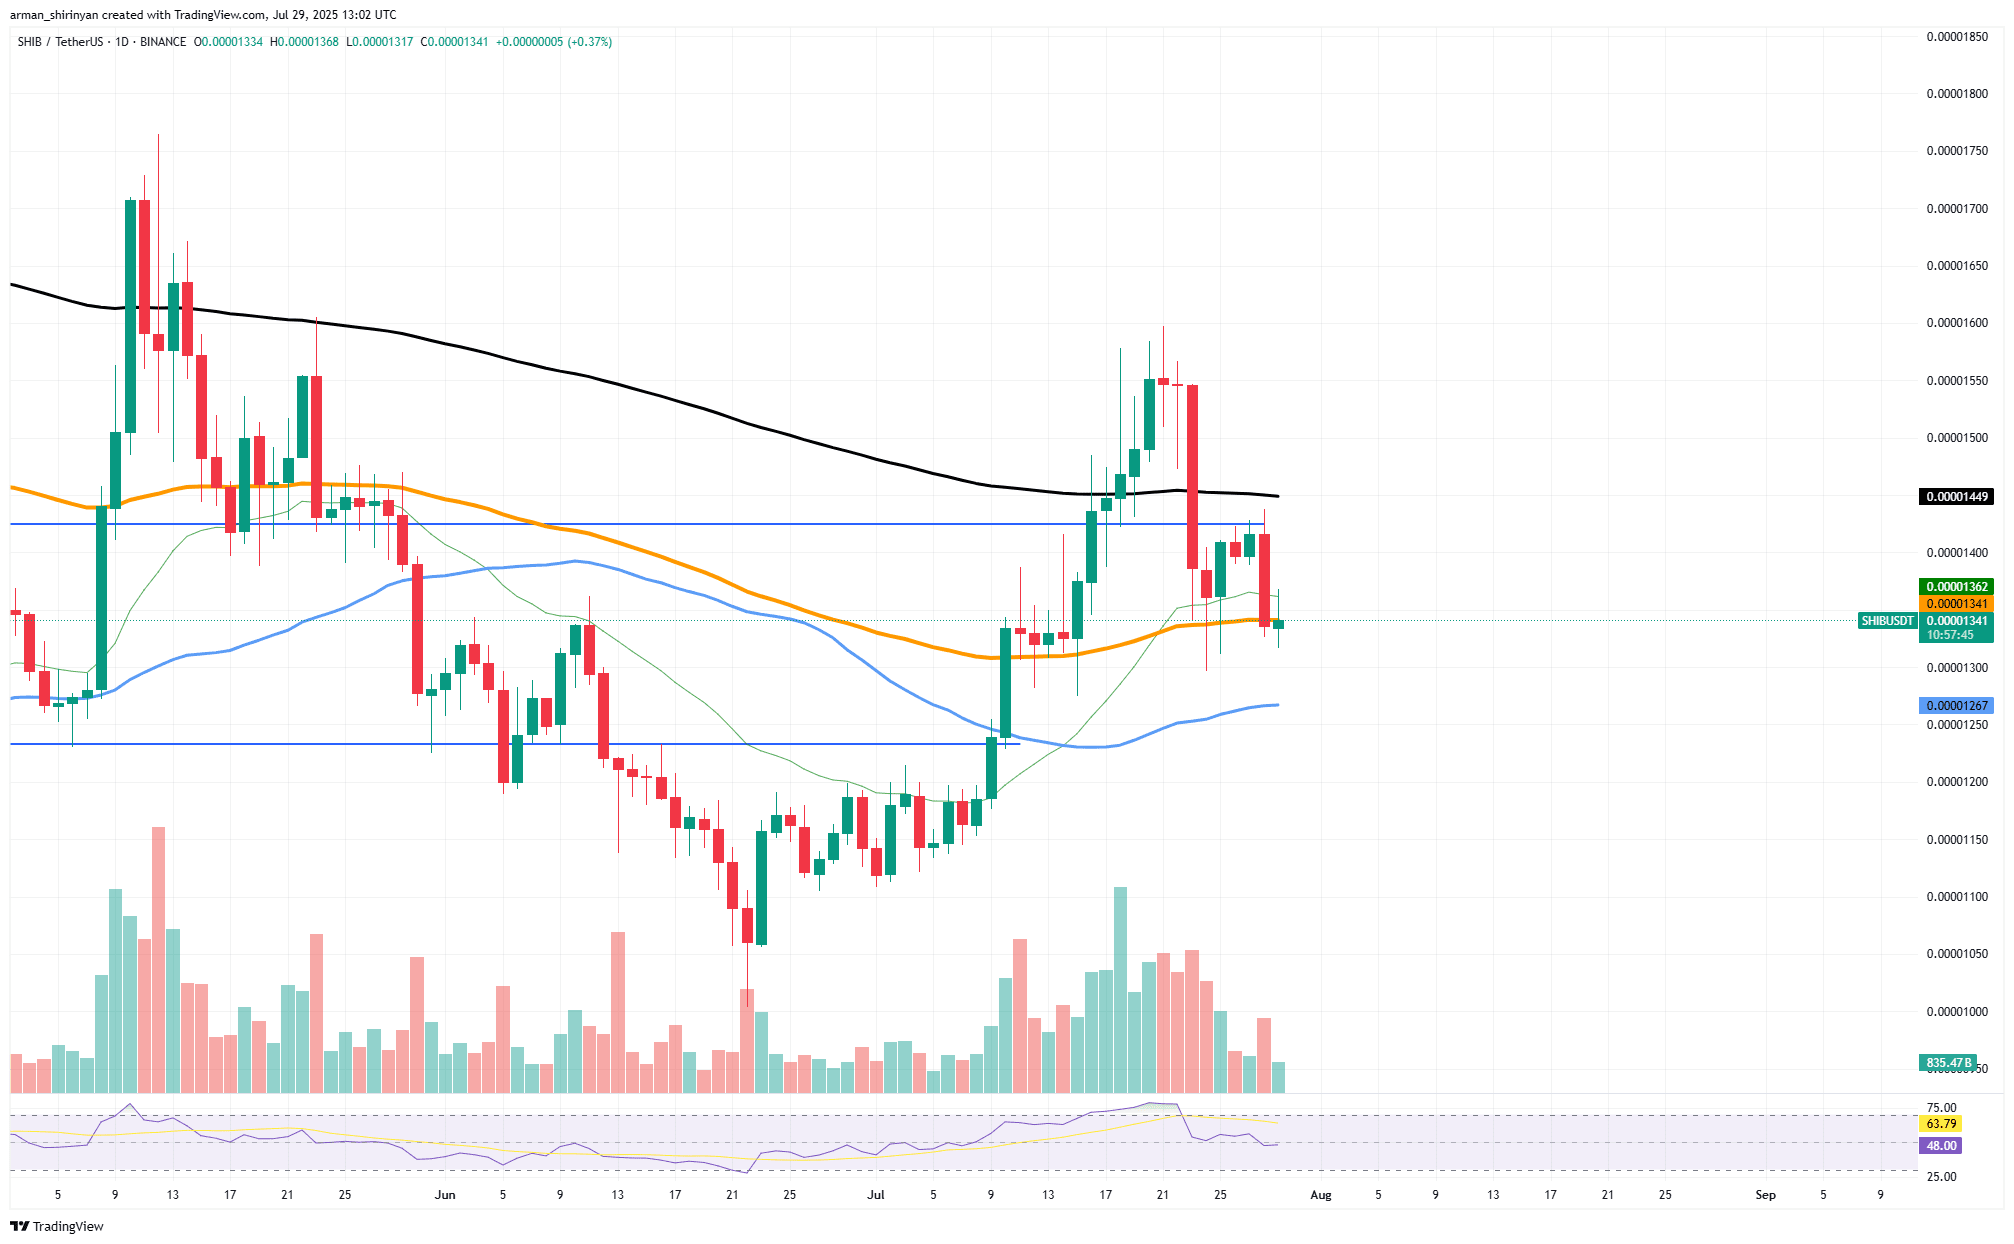
If bulls fail to leverage volume to push the price above the resistance level of $0.00001449, the asset may drop to $0.00001267, and could even fall to the psychological support level of $0.000012. The breakout attempt in July will be effectively offset by this deeper pullback.
SHIB is currently caught between horizontal support/resistance zones and major moving averages, with evident indecision in the market. Retail investors and whales are waiting for a catalyst that could sway either side, whether it be macro factors or on-chain factors.
A slight push for Solana
As the price breaks through multiple resistance zones and approaches the psychological level of $200, Solana has been in a strong uptrend since early July. Based on its short-term bullish structure, the asset is currently trading at around $184 and showing signs of consolidating above $175.
More intriguingly, a technical formation that could constitute a golden cross is approaching. This pattern is typically seen as a bullish signal when the 50-day moving average (orange line) crosses above the 200-day moving average (black line). For SOL, this cross may occur in the next trading days, regardless of whether the price continues to rise or remains unchanged.
The unsettling reality is that this golden cross is currently almost worthless. Although this pattern typically indicates long-term bullish momentum, it has formed after a significant rally. The price of SOL surged from below $140 to nearly $210 in just a few weeks.
At this point, those betting on the golden cross are simply late to the party, as trend-following traders have already profited from it. As a lagging indicator, it is more of a confirmation of the past rather than a catalyst in the current specific situation.
Trading volume has begun to decline, indicating that momentum is weakening, and the RSI has retreated from overbought levels. The next significant support level is in the $162-$164 range, where all key EMAs converge, and a break below the uptrend line and failure to hold above $175 could lead to a more severe correction.
Bitcoin may explode
Every candle closing within this range will further push the rebound higher, while Bitcoin's movement is becoming increasingly tight. Bitcoin has been consolidating below the key resistance level of $120,000, having approached this resistance multiple times without breaking through, and is currently trading at around $119,000.
However, this is a classic example of volatility squeeze. This structure is a classic example of a continuation pattern. In early July, Bitcoin broke out of a descending triangle and began to rise slowly, but momentum has since slowed. Low trading volume, volatility compression, and the shrinking daily candlestick charts are all signs of an impending breakout. The RSI remains above 60, indicating that bulls are still in control.
This pattern is more explosive due to the multi-layered support forming below. The 20-day moving average is positioned favorably at $116,000, and the 50-day moving average is not far off. With these stacked moving averages providing strong support for Bitcoin, the likelihood of a significant drop is low unless a black swan event occurs. Additionally, macro factors include a historically bullish fourth-quarter pattern, declining exchange balances, and ETF inflows.
We could see Bitcoin rise significantly to the $125,000 to $130,000 range if momentum continues, especially if Bitcoin convincingly breaks above $120,000, particularly with a substantial increase in the daily closing price. However, there is one issue: the longer Bitcoin stays flat, the more severe the increase will be. This is a scenario that cannot be determined by when and where, rather than a 'possible' scenario. With the return of volatility, Bitcoin is about to make a decision. The trend suggests that the path of least resistance remains upward.


