One, on-chain data: Whale selling pressure eases but has not turned around
Large holdings movement
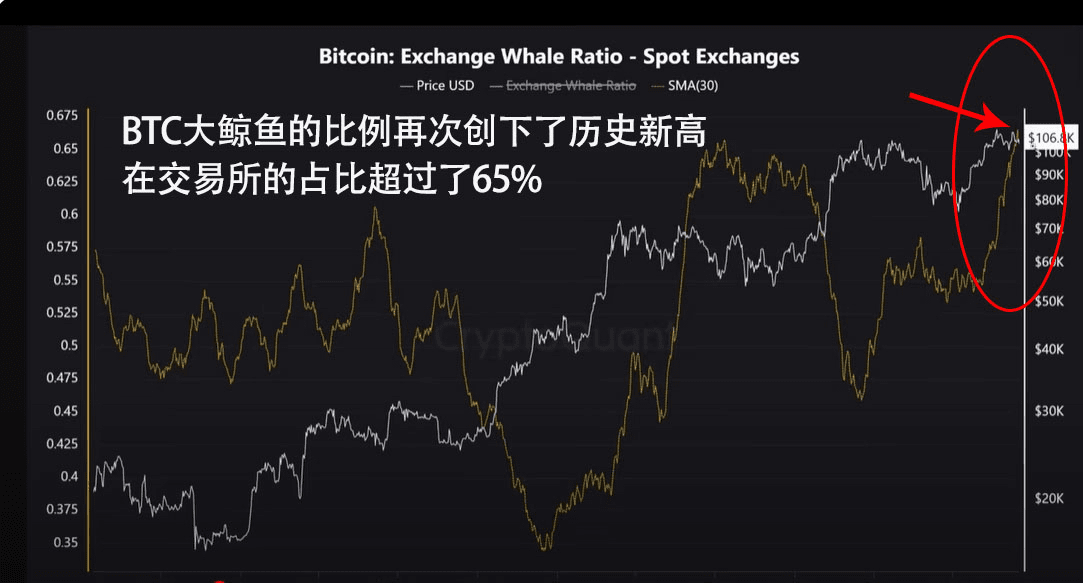
$100k+ whale address daily sell-off volume decreased by 30% compared to the previous day but is still in a net selling state (cumulative reduction over the past two weeks accounts for 2.1% of the holding amount).
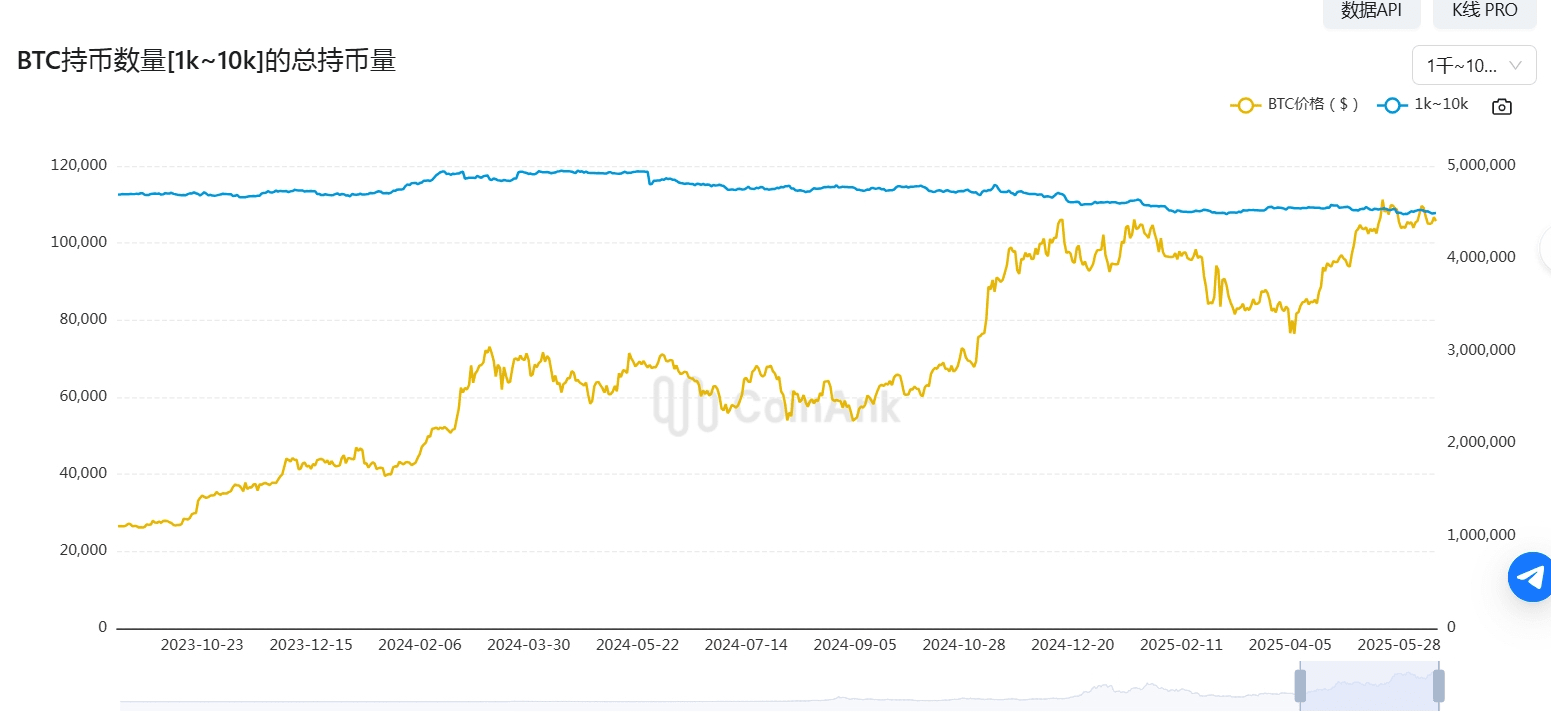
Medium holders (100–1,000 BTC) continue to accumulate, with a 10% increase in wallet numbers over the past week, offsetting part of the whale selling pressure.
Exchange liquidity
Binance has a net outflow of 4,500 BTC in a single day, but stablecoin net inflow exceeds $400 million, showing market reluctance to sell and potential buying momentum.
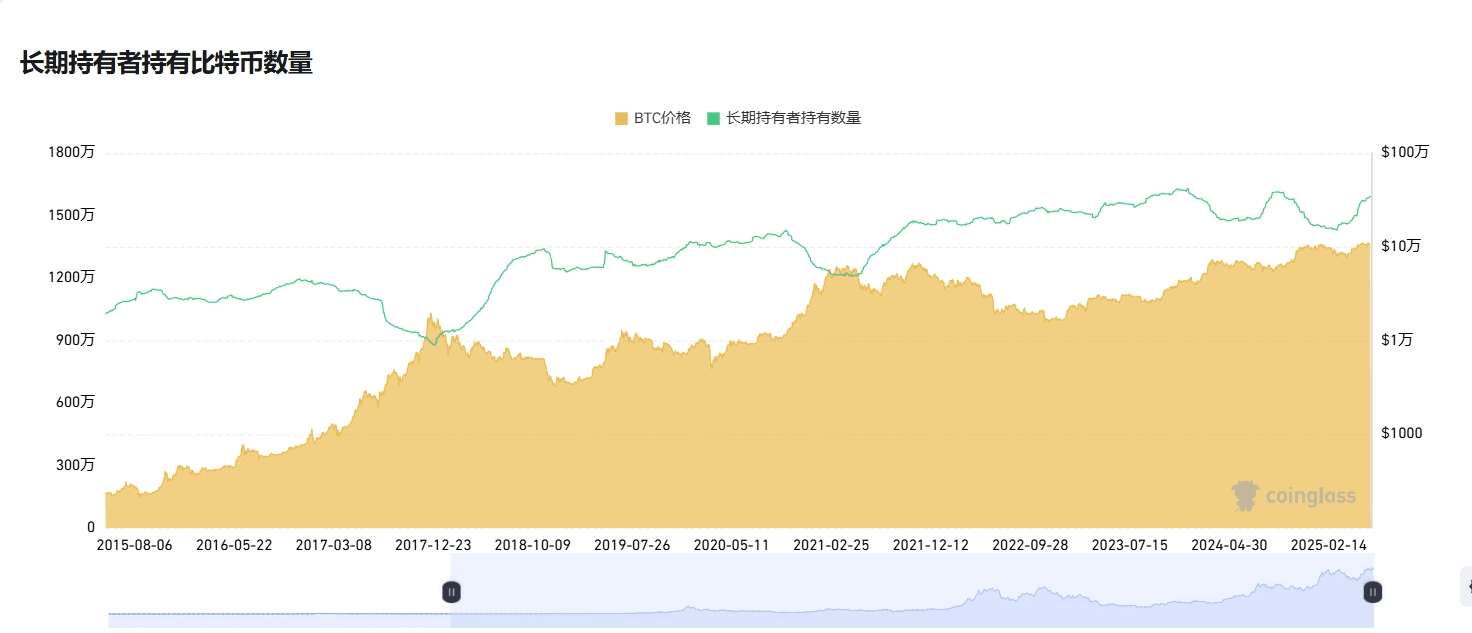
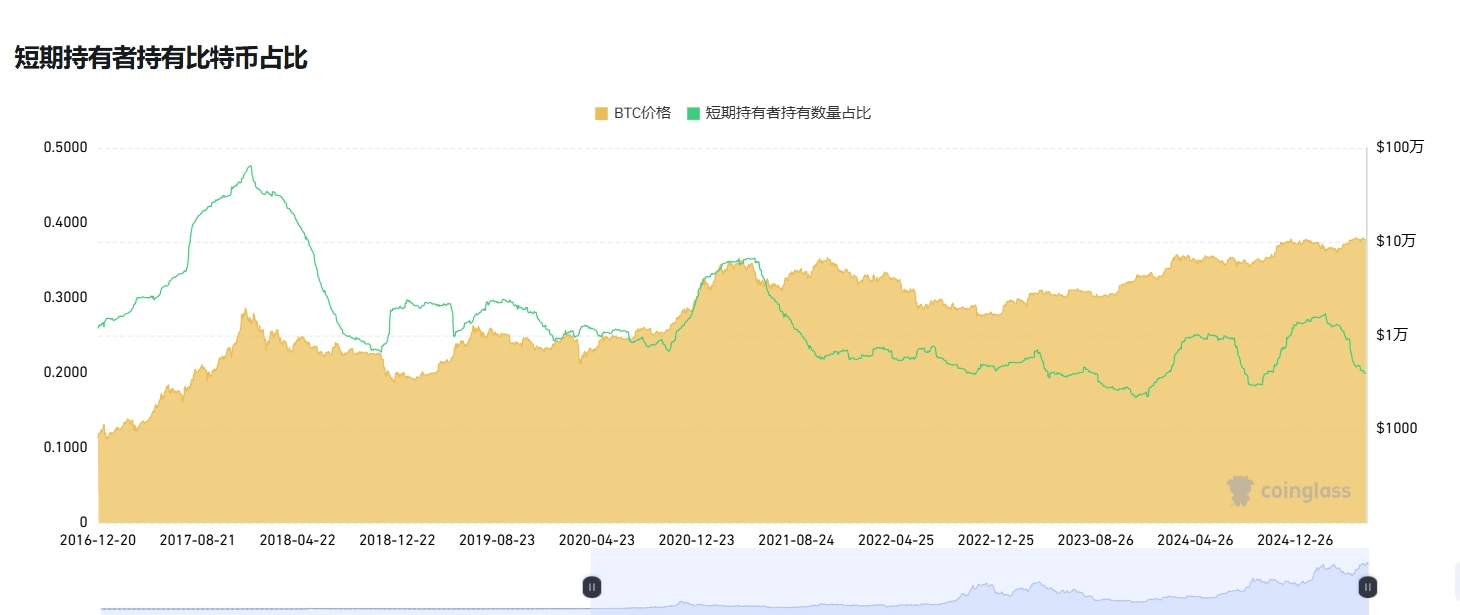
Short-term holders' holding situation
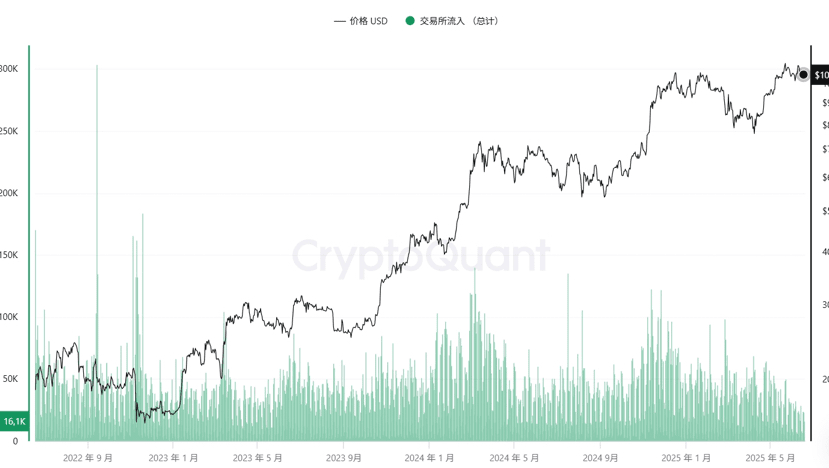
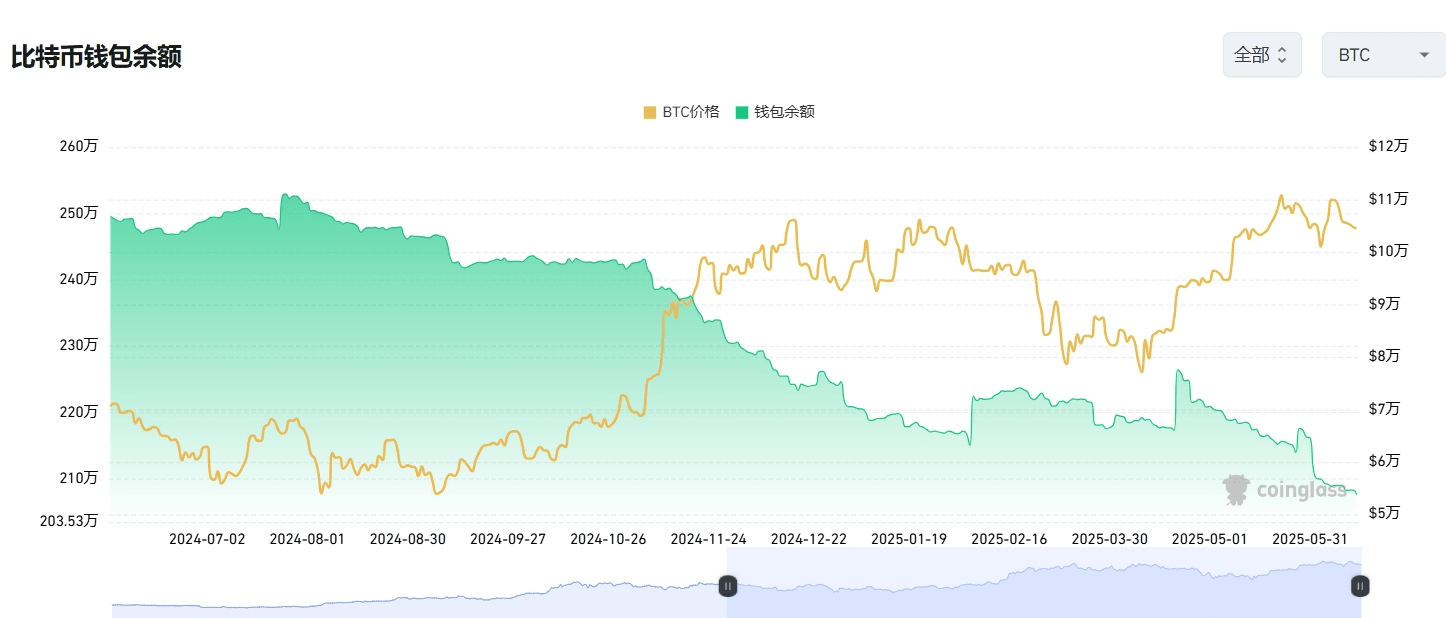
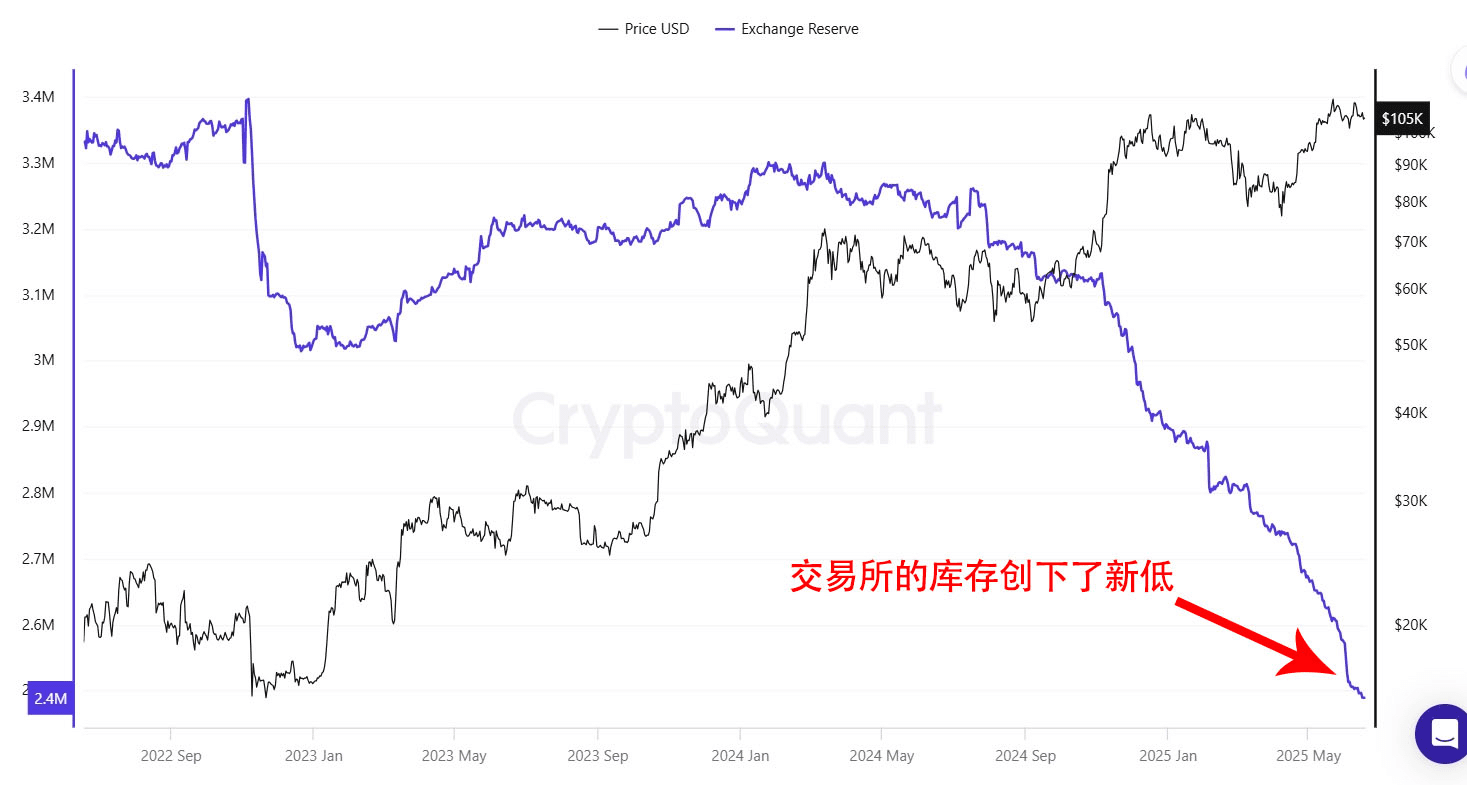
The inflow of exchanges shows a significant downward trend
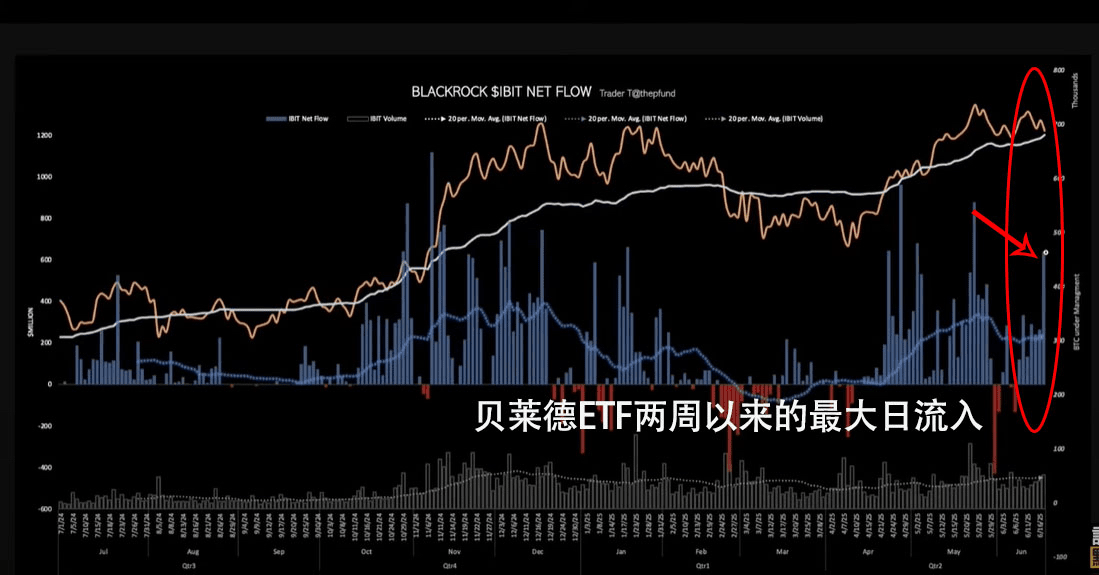
Two, capital flow: Institution-led ETF accumulation
Bitcoin ETF +$216.5 IBIT dominates $182M (monthly peak), total holdings exceed 732,000 BTC
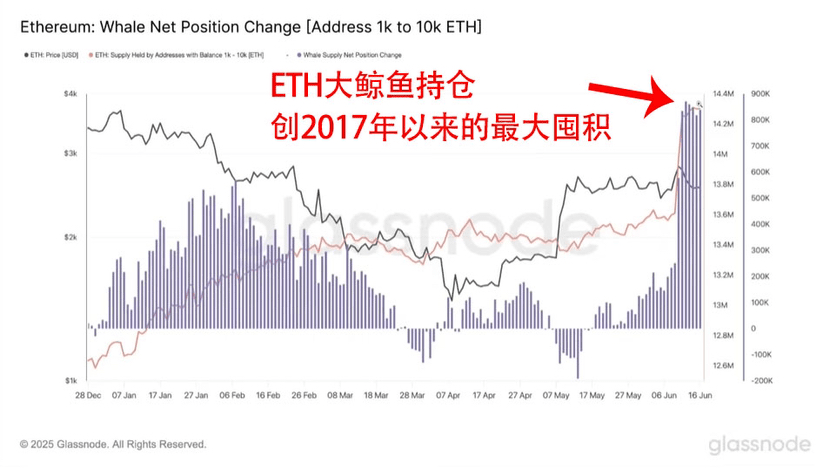
Ethereum ETF +$11.1 staking amount hits a new high (35 million ETH), cumulative addresses hold 22.8 million ETH unmovable
 Stablecoin dynamics: Tether issues 1 billion USDT, providing ammunition for potential buying.
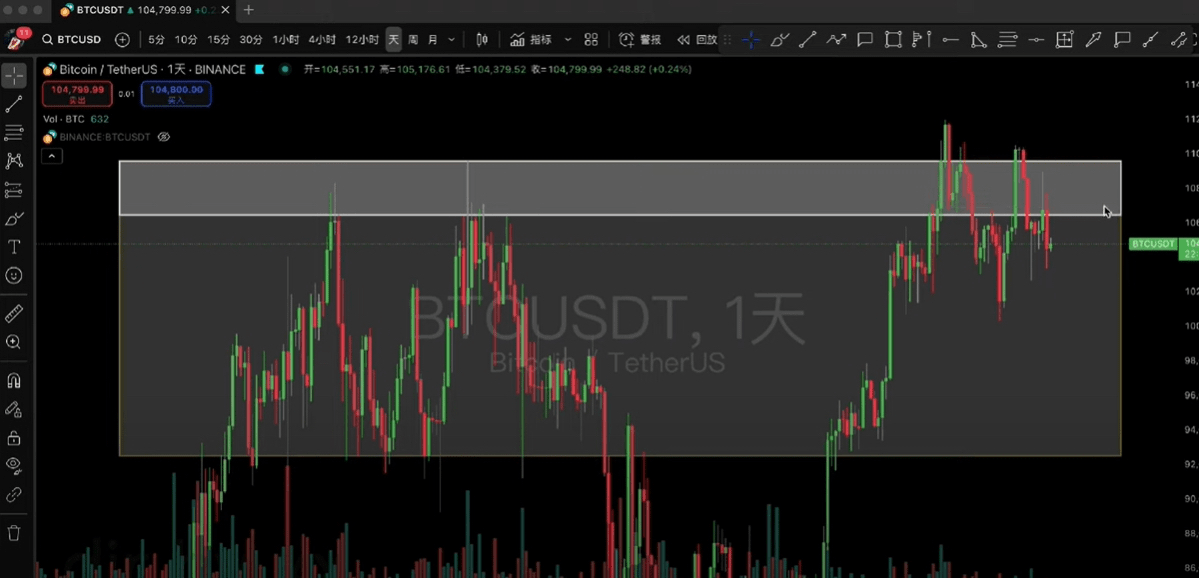
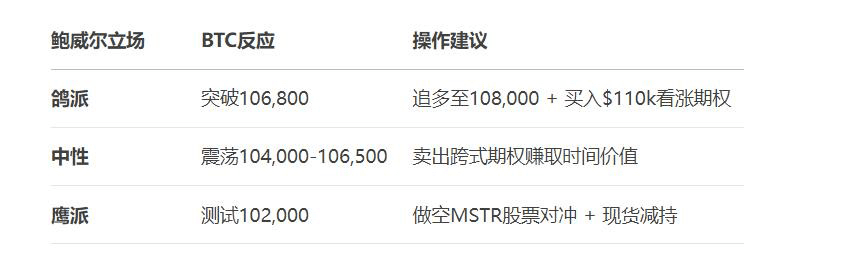
Three, key positions for long and short competition
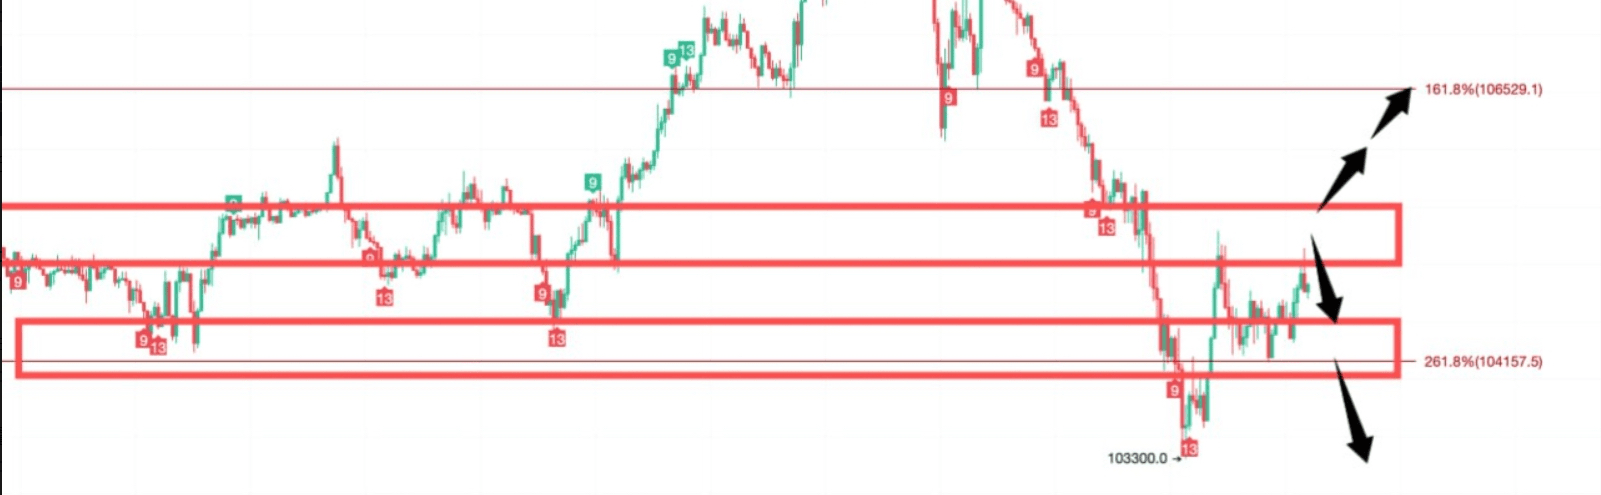
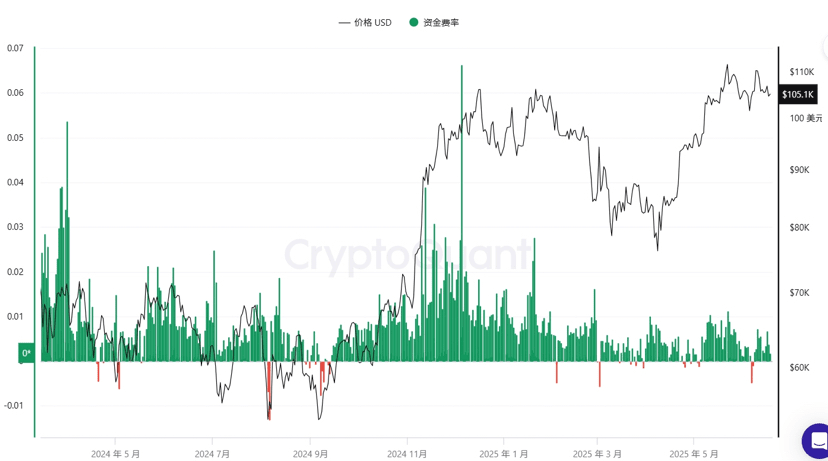
The funding rate has not shown abnormal amplification, and no FOMO sentiment seen at market tops
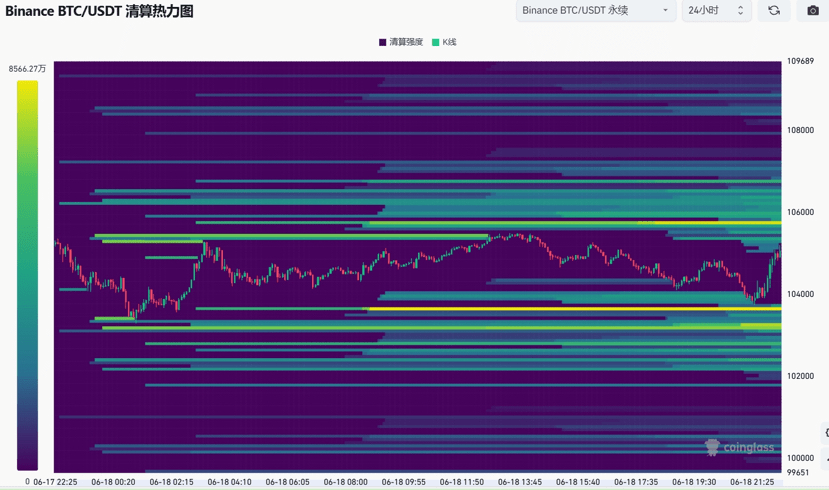
Bullish breakout conditions: Daily close stabilizes above 106,800 → triggers short covering target 108,00036.
Bearish defense line: 105,000 USD accumulates 1.07 million BTC (mainly short-term holders, easy to trigger a sell-off).
Ethereum linkage: support moves up to 2,450, breaking through 2,605 can chase the rise.
Four, macro catalysts: The Federal Reserve's decision will set the tone tonight
Interest rate decision: Maintaining 5.5% unchanged has been priced in, focus on Powell's speech and dot plot.
Market expectations:
Five, operational recommendations
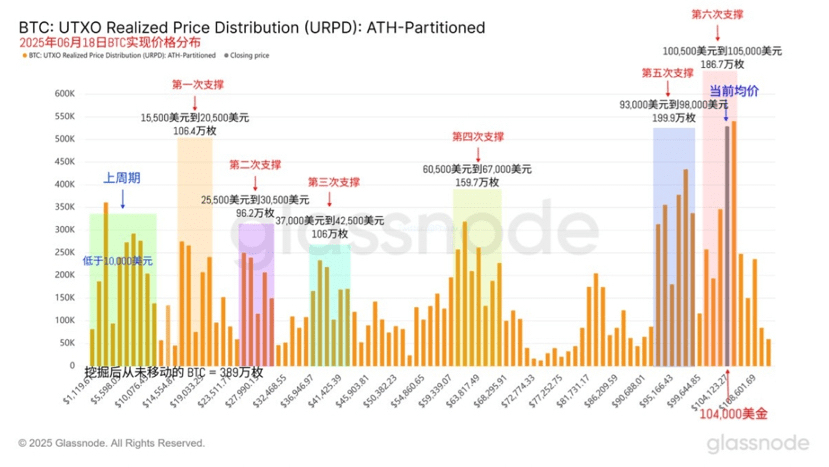
BTC short-term: Hold above 104,000, stop loss below 102,000; add positions above 106,800.
ETH swing: Layout long positions in the range of 2,450–2,420, target 2,580.
Macro hedge: Buy $102k put options + $108k call options combination, betting on volatility rebound.
Core contradiction: Whales taking profits vs. institutional ETF support → Breakout in the 102,000-106,800 range determines direction.
1. Greed and fear index today is: 48 neutral BTC has experienced a pullback, and market sentiment quickly recovers
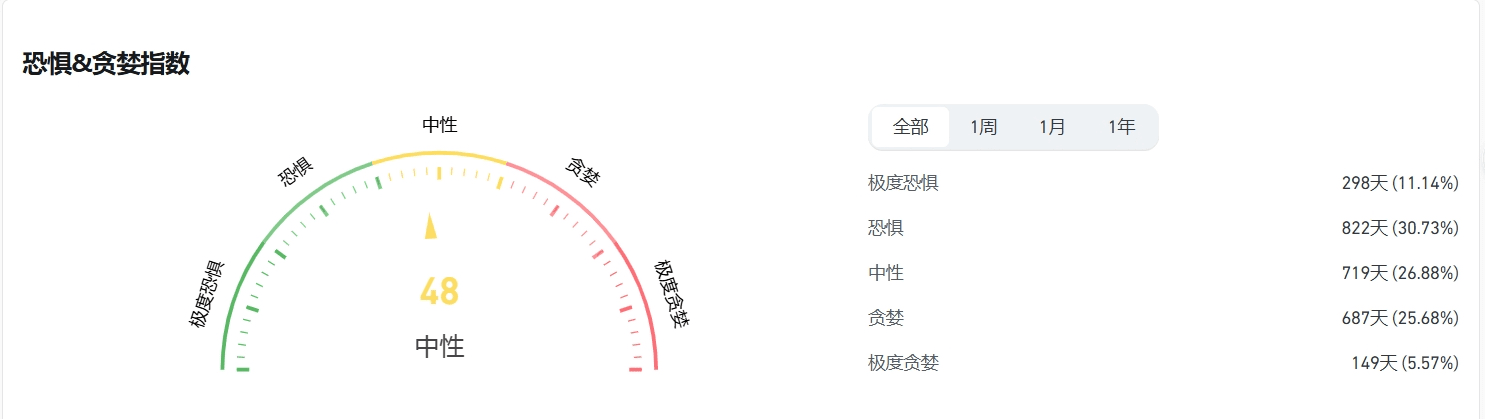
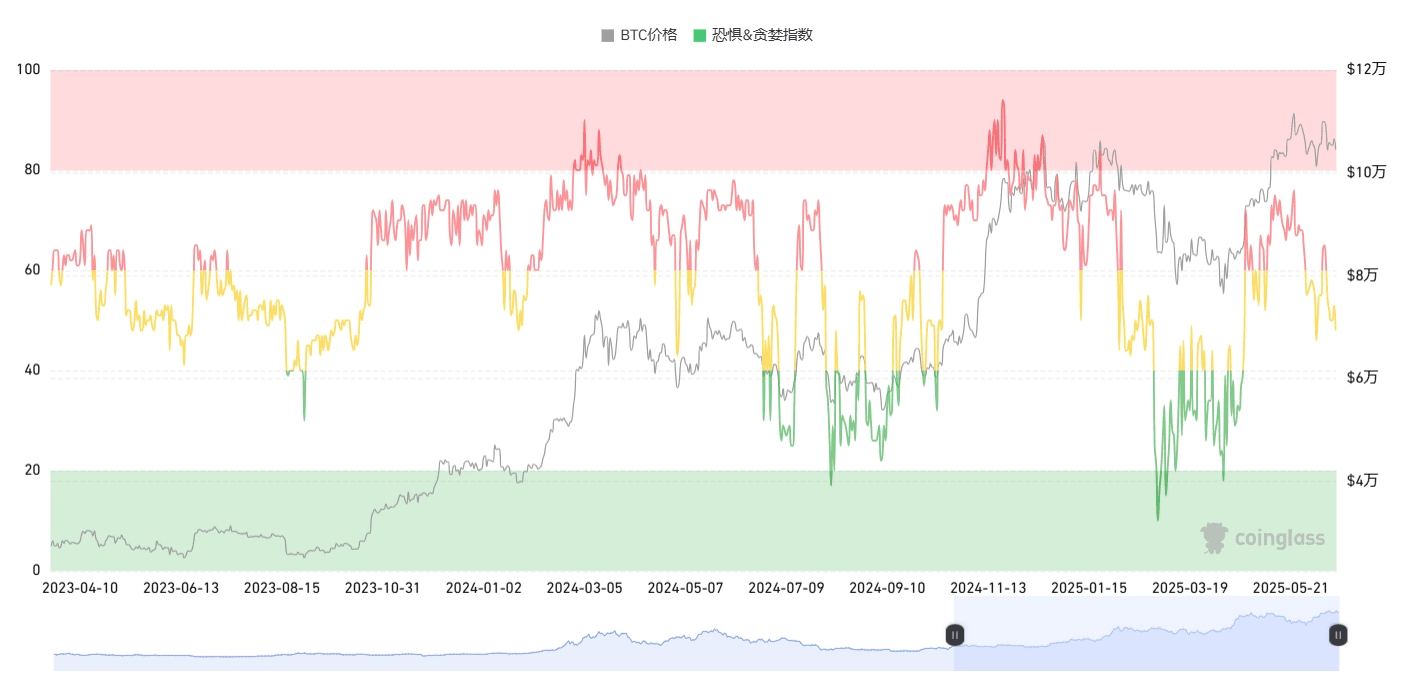
**Interpretation of the greed and panic/greed index
The behavior of the cryptocurrency market is highly emotional. When the market rises, people tend to be greedy, experiencing fear of missing out; when the market falls, they irrationally sell their cryptocurrencies.
Using the fear and greed index, help friends make non-rational judgments by minimizing emotional influences.
There are two states:
Extreme fear indicates that investors are overly worried, which may be a buying opportunity.
Excessive greed indicates that investors are too excited, and the market may undergo a correction.
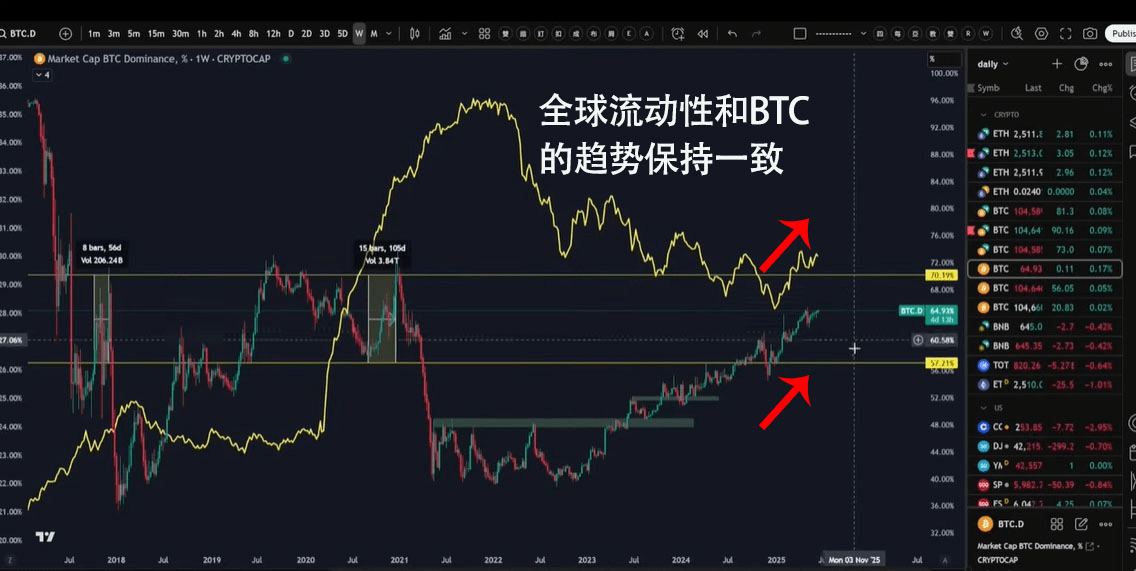
2. Bitcoin total market share 63.55 remains basically stable compared to yesterday
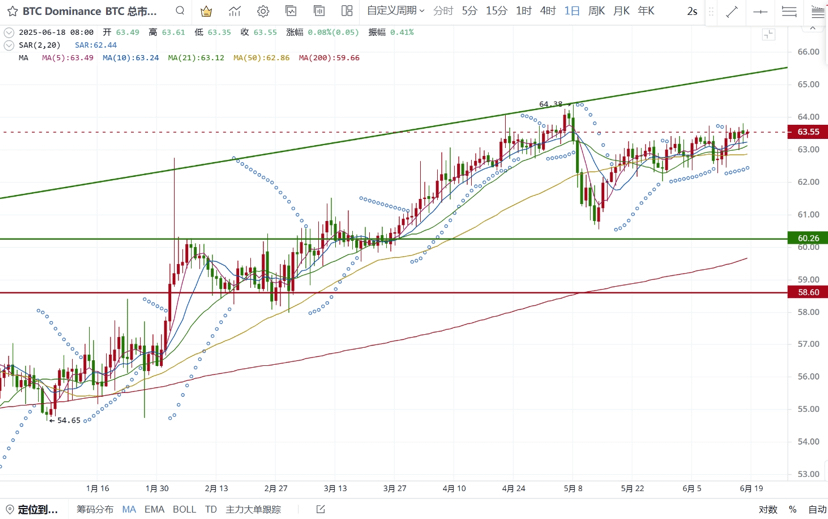
**Bitcoin's total market share is a core indicator of Bitcoin's relative influence in the entire cryptocurrency market. This indicator reflects not only Bitcoin's short-term market position but also reveals changes in capital rotation, investor sentiment, and macro trends.
Bitcoin market share is the 'weather vane' for judging market phases:
Early bull market: Market share rises, funds prioritize allocation to Bitcoin.
Late bull market: Market share declines, funds rotate to altcoins, triggering 'altcoin season'
Market thermometer: >60% = risk aversion dominant; <40% = altcoin frenzy.
Capital flow chart: Reveals the allocation preferences of institutions and retail investors (Bitcoin → stable, altcoins → high risk high return)
3. Bitcoin and Ethereum trading pair 0.024509 Ethereum to Bitcoin trading is basically stable
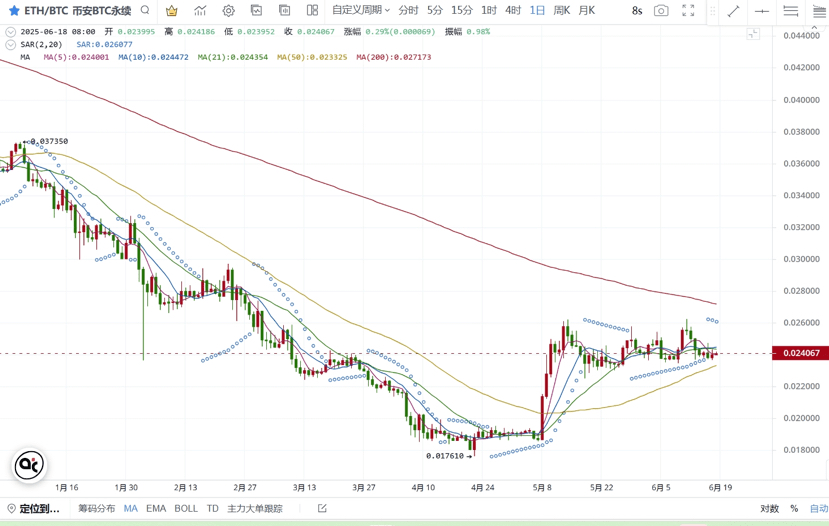
**Bitcoin/Ethereum trading pair is the 'risk thermometer' of the cryptocurrency market:
Ratio rising → Market prefers high-risk assets (signal for altcoin season initiation);
Ratio declining → Funds are seeking safety in Bitcoin (characteristics of bear market or early bull market).
4. ETF inflow and outflow data ETF data maintains a slight net inflow
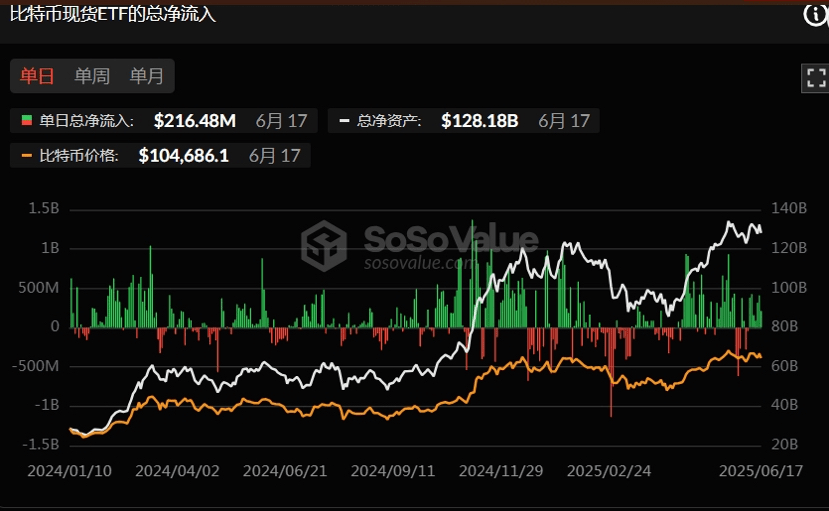
**ETF inflow and outflow data explanation: The inflow and outflow data of Bitcoin ETFs are core indicators for tracking institutional sentiment, market trends, and capital rotation.
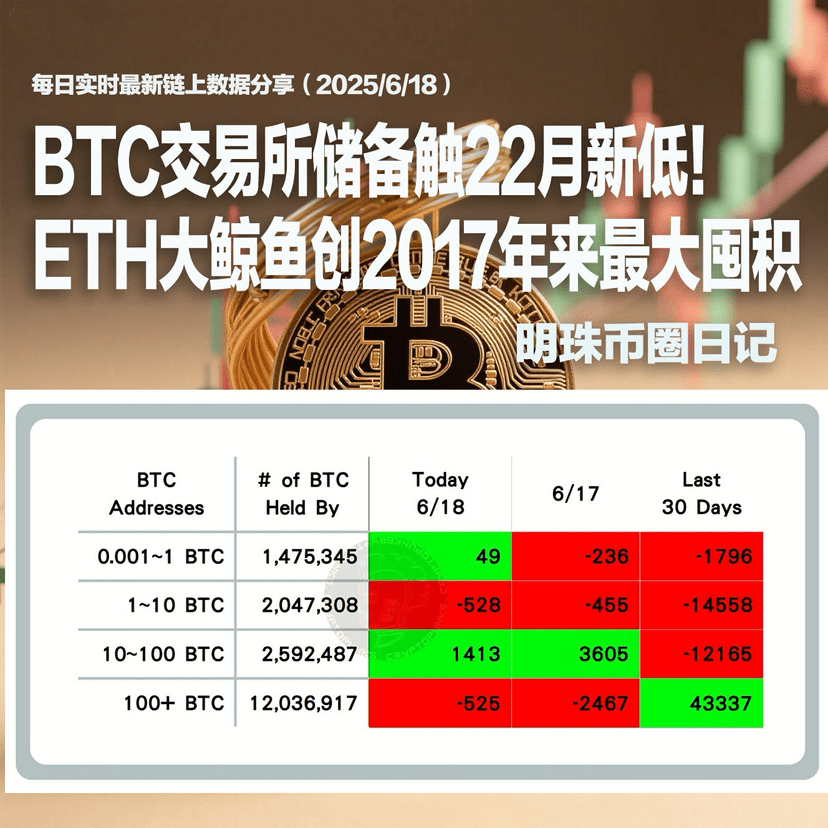
5. On-chain BTC retail, large holder, and institutional buying and selling data statistics Big whales sold off (largest in the past two weeks)
Thanks to @TradingPunk for providing data organization and sharing
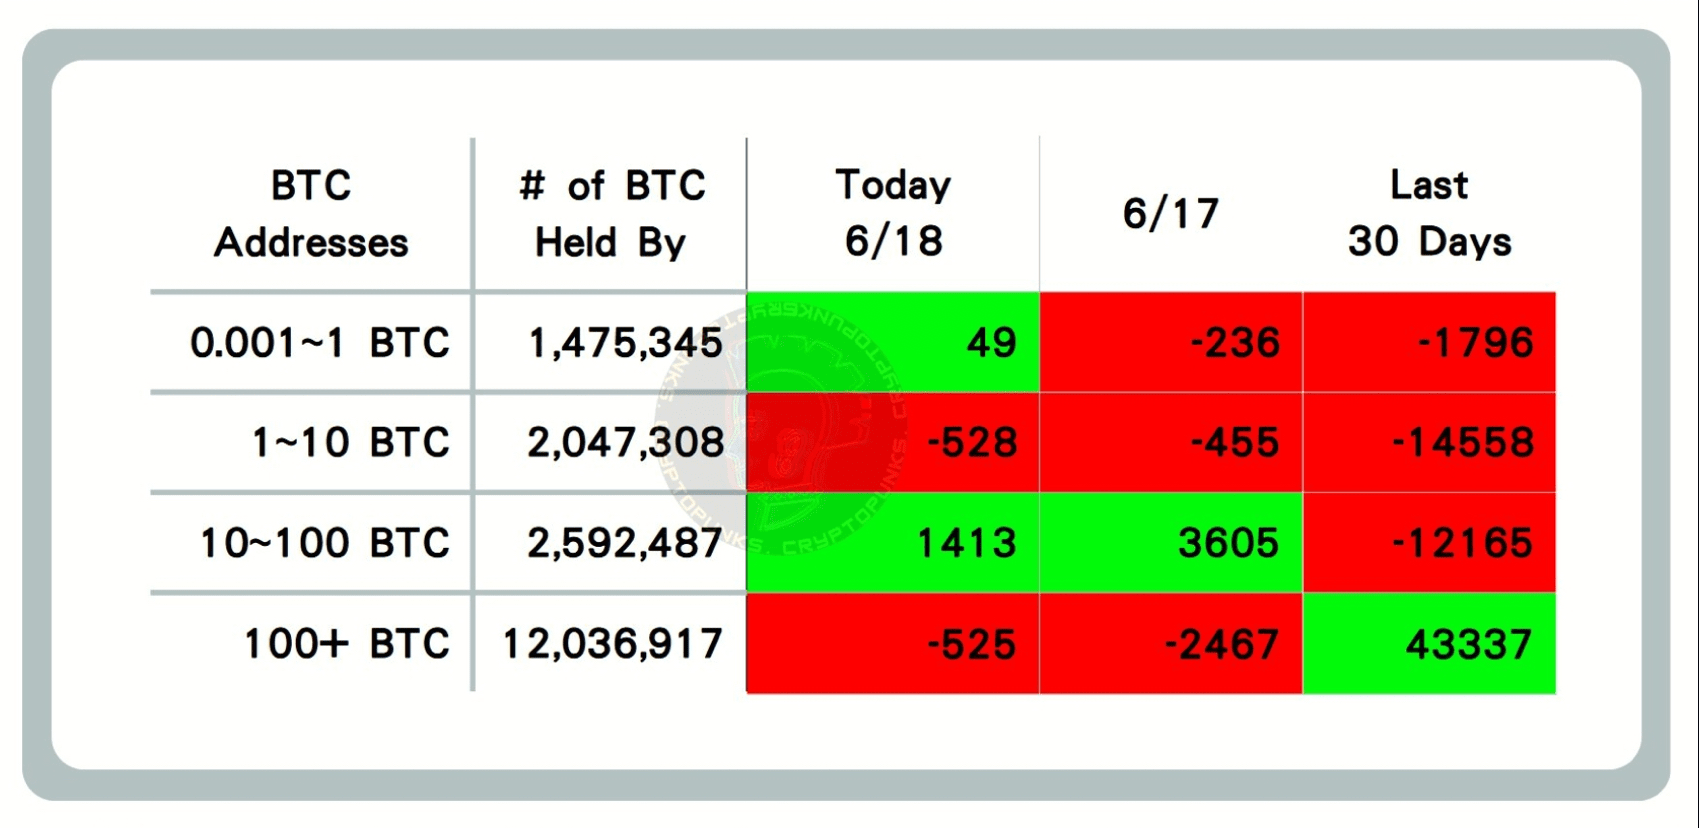
Data explanation: Representing the increase and decrease of ≤ 1 BTC, 1–10 BTC, 10–100 BTC, and 100+ BTC on-chain flow, this data reflects a kind of market sentiment of retail investors, large holders, and institutions.
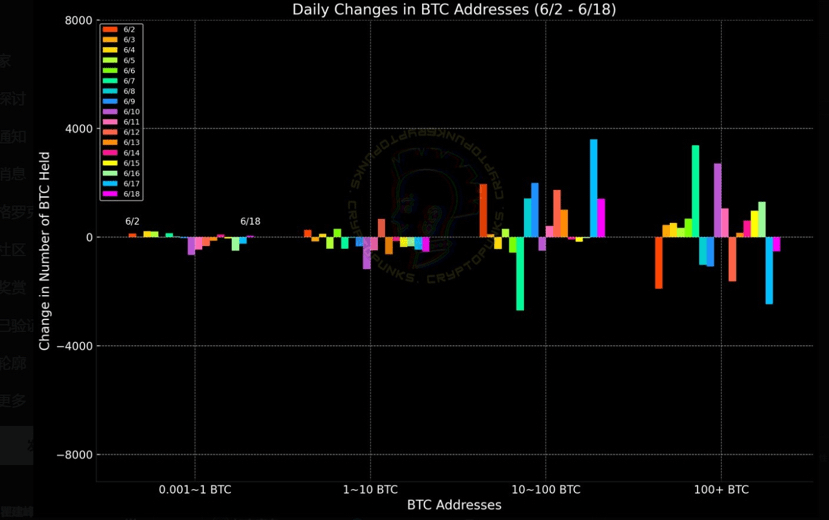
Data explanation: This data reflects the changes in on-chain flow of ≤ 1 BTC, 1–10 BTC, 10–100 BTC, and 100+ BTC within a week, providing an intuitive representation of the flow trends of retail investors, large holders, and institutions.
When on-chain data shows an extreme situation, a reversal often occurs (for example, if large whales with over 100 BTC appear to be buying heavily while others are selling, the probability of Bitcoin rising significantly increases, and vice versa for falling). It is also necessary to analyze in conjunction with other on-chain data and technical indicators.
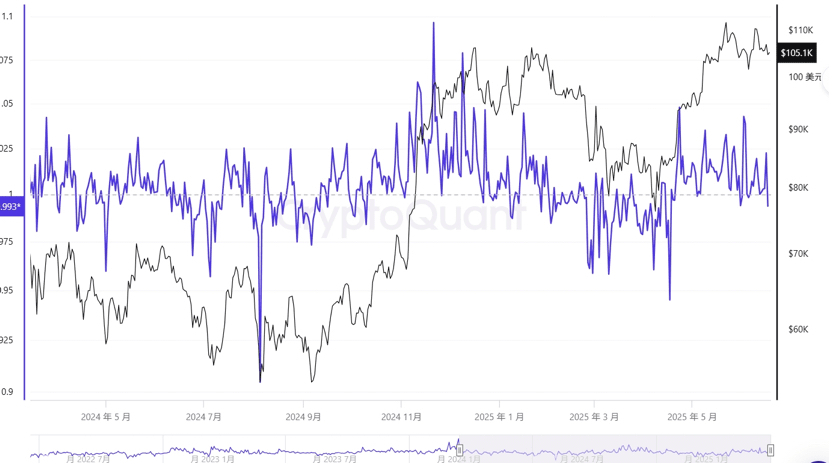
6. MVRV realized market cap ratio MVRV > 1
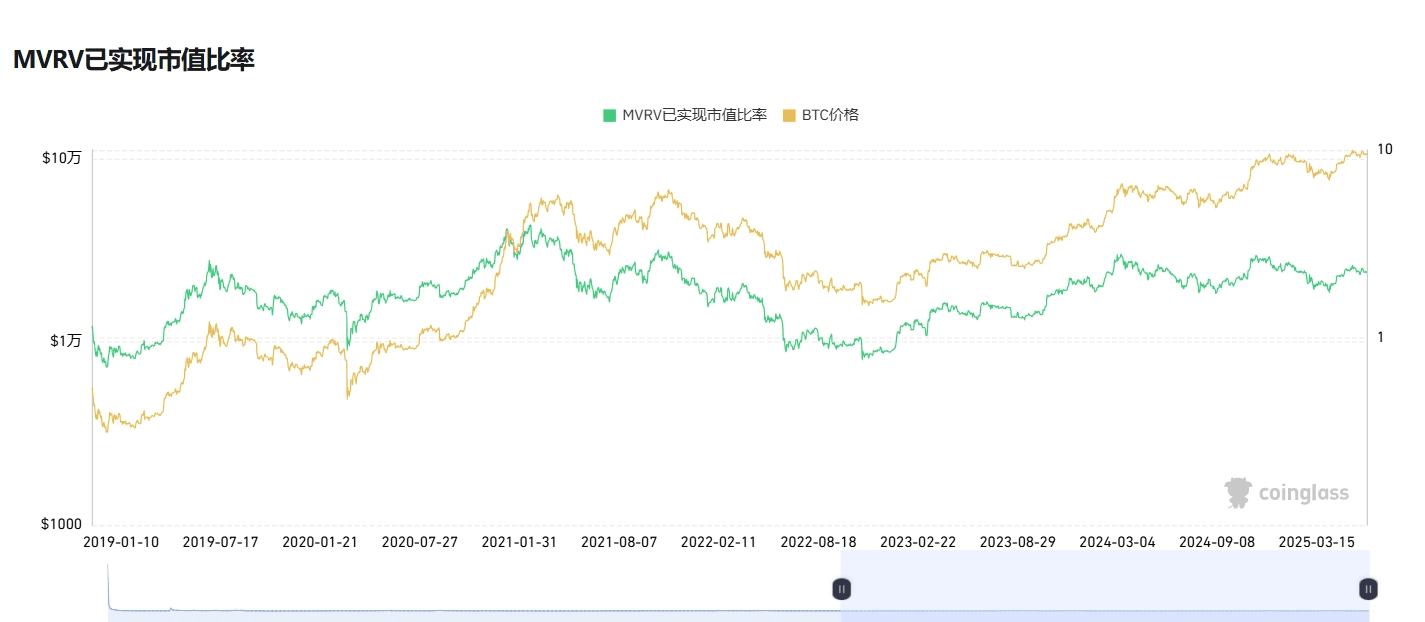
**MVRV realized market cap ratio explanation: The MVRV realized market cap ratio is an indicator used to assess the cryptocurrency market (especially Bitcoin), helping friends determine whether an asset is overvalued or undervalued and identify potential market cycle tops and bottoms.
MVRV > 1
When the ratio is greater than 1, it indicates that the market price is above the realized price, meaning most holders are in profit. This may indicate that the market is overheated, especially when MVRV reaches historical highs, which may signal a market top.
MVRV < 1
When the ratio is less than 1, it indicates that the market price is below the realized price, meaning most holders are in a state of loss. This may indicate that the market is undervalued, especially when MVRV reaches historical lows, which may signal a market bottom.
7. Altcoin season index 18 Is it in altcoin season: No, still in a sluggish state
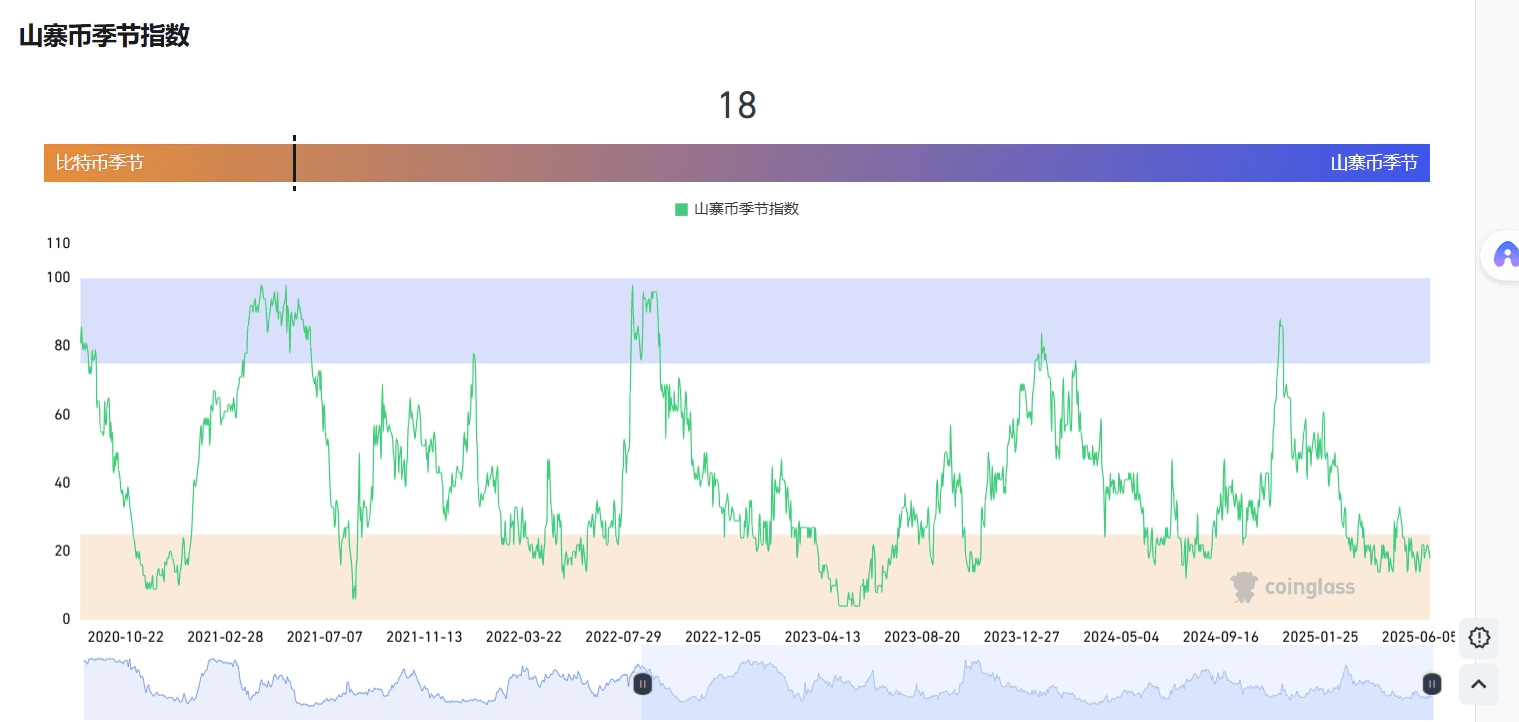
**Altcoin season index explanation: The altcoin season index is an indicator used to measure the performance of non-Bitcoin cryptocurrencies in the crypto market. It is typically used to judge whether altcoins outperform Bitcoin over a specific time period, helping investors understand market trends and investment opportunities.
8. USD inflow into the cryptocurrency market small outflow
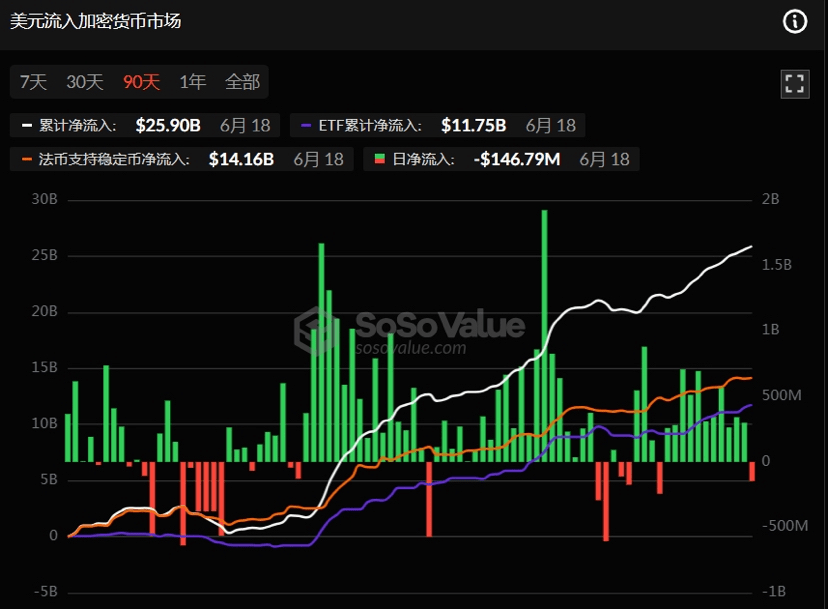
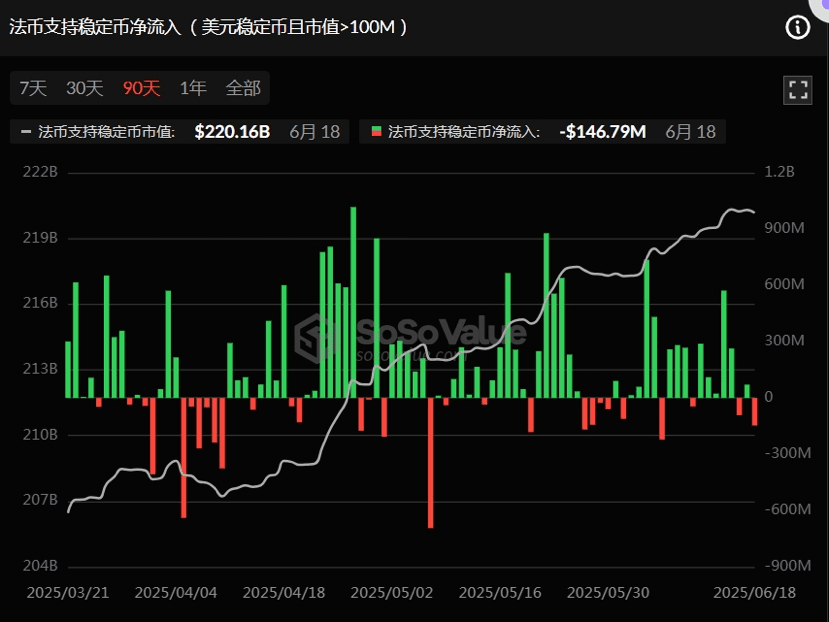
9. Fiat currency supports stablecoin net inflow (USD stablecoin with market cap >100M) small outflow
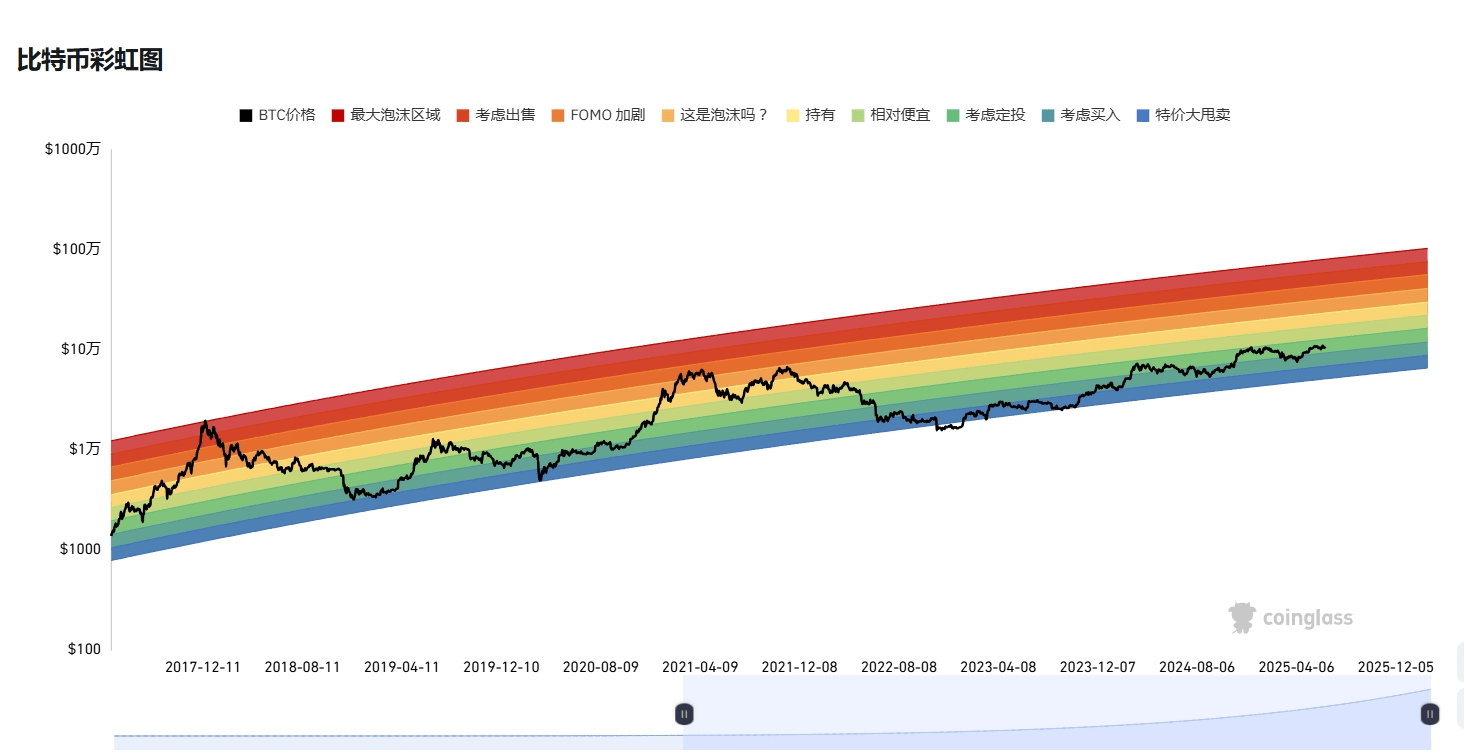
10. The rainbow chart shows that BTC does not show signs of peaking
The above data represents a perspective from on-chain data to anticipate BTC volatility trends and market sentiment, not representing any investment advice, please make cautious decisions!!

I am Mingzhu, follow me for daily sharing of real-time on-chain data and dynamics, helping friends anticipate decisions, exciting content not to be missed, welcome to leave comments for discussion.
