
1. On-chain data: Whale movements and exchange outflows
Large sell-off signal
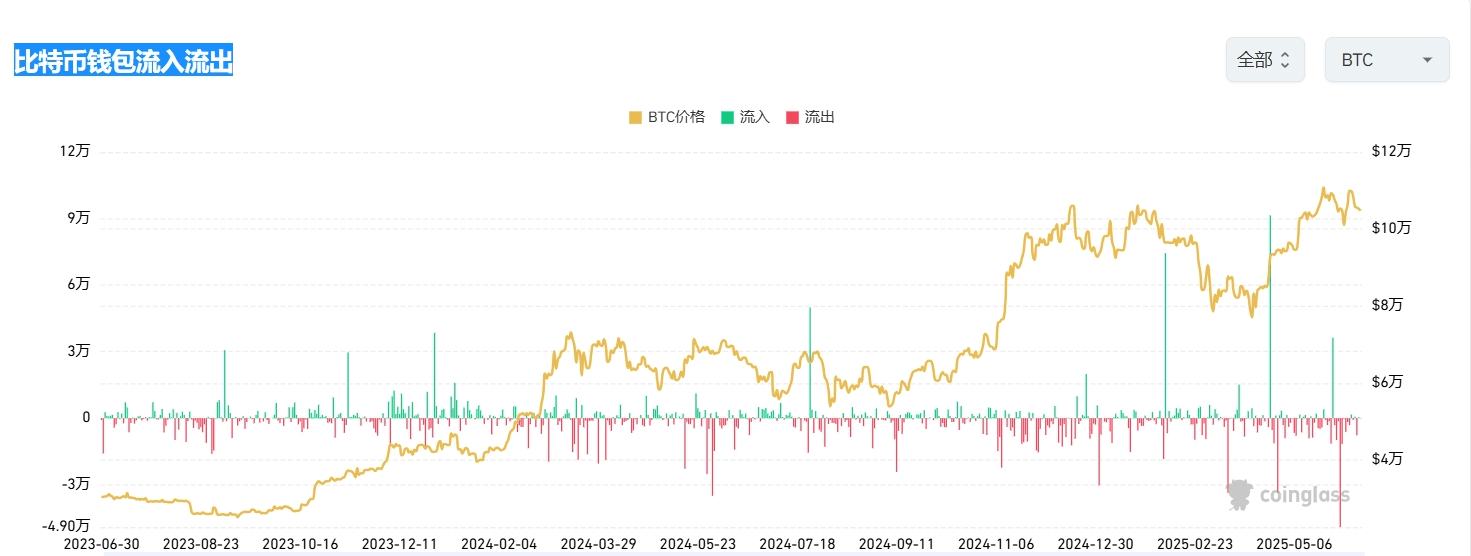
$100k+ whale addresses sold off in one day: the largest single-day selling volume in nearly two weeks, multiple transfers of over 10,000 BTC captured on-chain to exchanges (suspected cashing out).
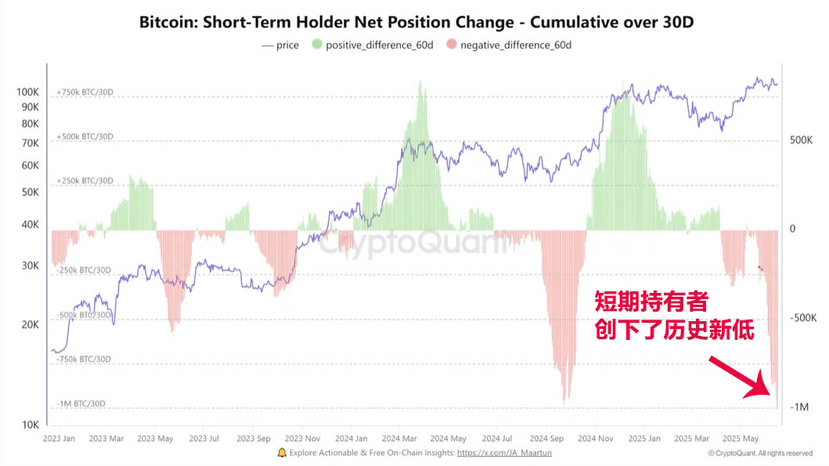
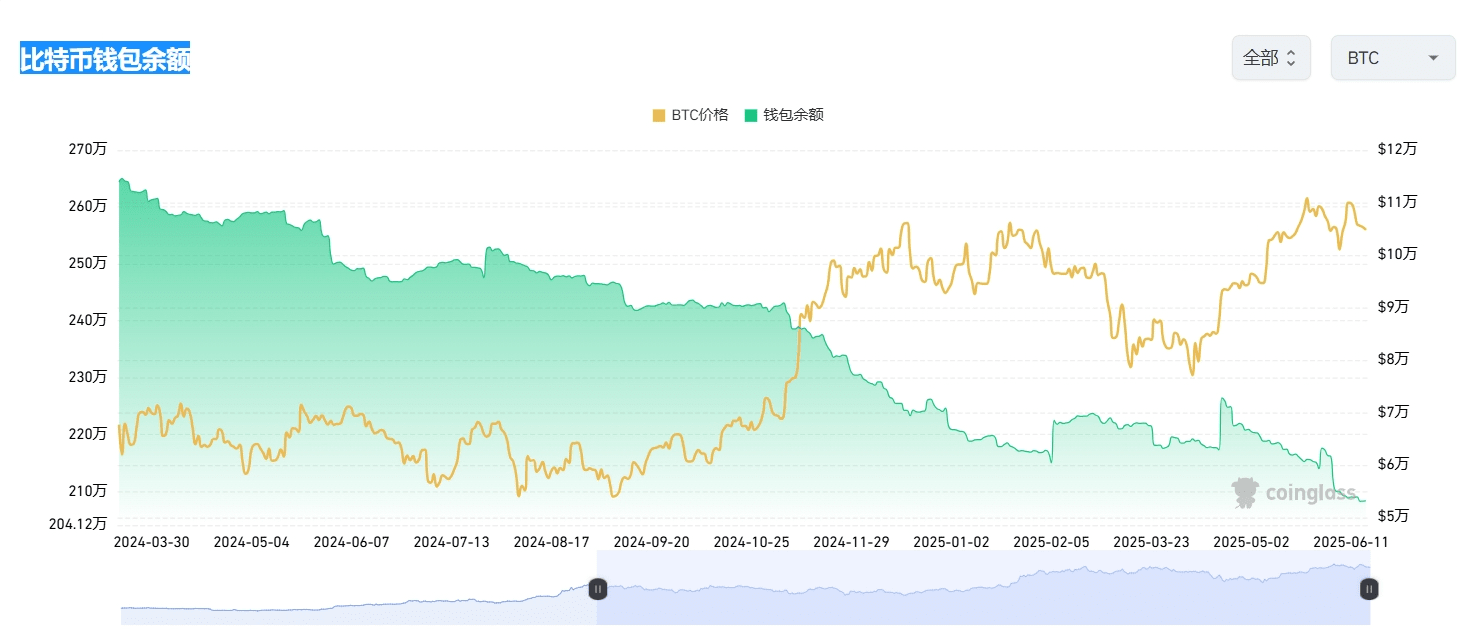
Exchange reserves continue to decline: BTC reserves on exchanges have decreased by 400,000 in the past 6 months (2.8 million → 2.4 million), tightening supply provides long-term price support, but short-term selling pressure increases volatility.
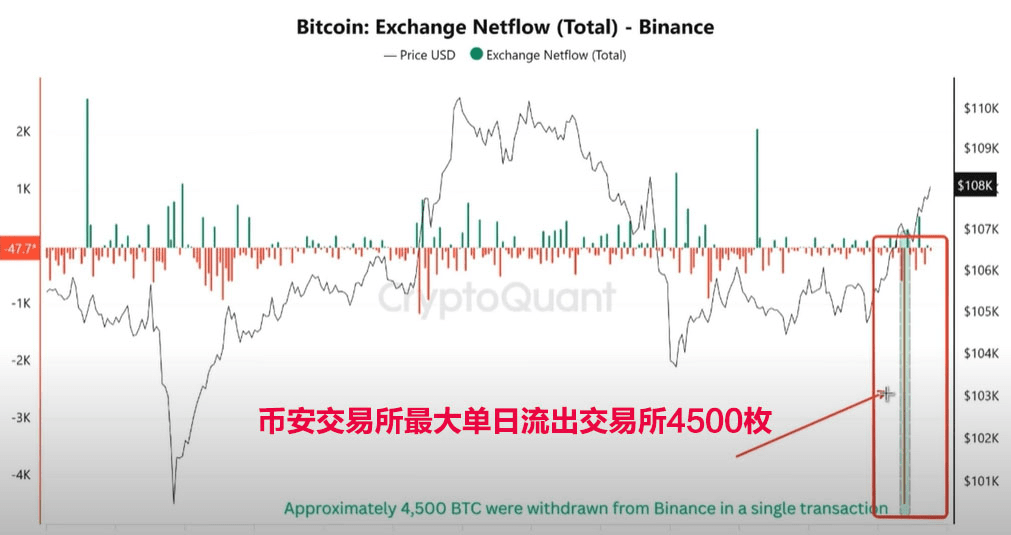
Binance exchange saw a net outflow of 4,500 BTC in one day, marking the third-largest single-day outflow this year, with long-term optimism.
On-chain activity alert
Bitcoin network's seven-day average transaction volume dropped to 317,000 transactions (the lowest since October 2023), miner fee income sharply reduced to $593,000/day (down 87% from October 2024).
2. Spot ETF fund flows: Institutional disagreements intensify
ETF market pattern:
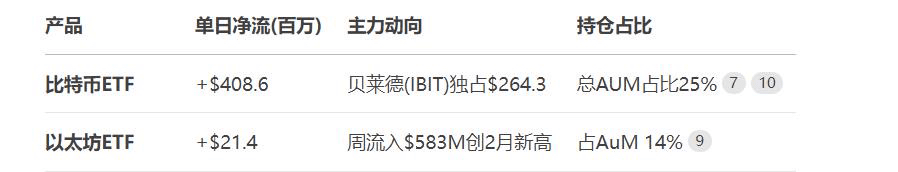
Bitcoin ETF total holdings reached 732,000 BTC (accounting for 3.73% of circulation), BlackRock + Fidelity absorbed 175,000 shares from Grayscale's reduction.
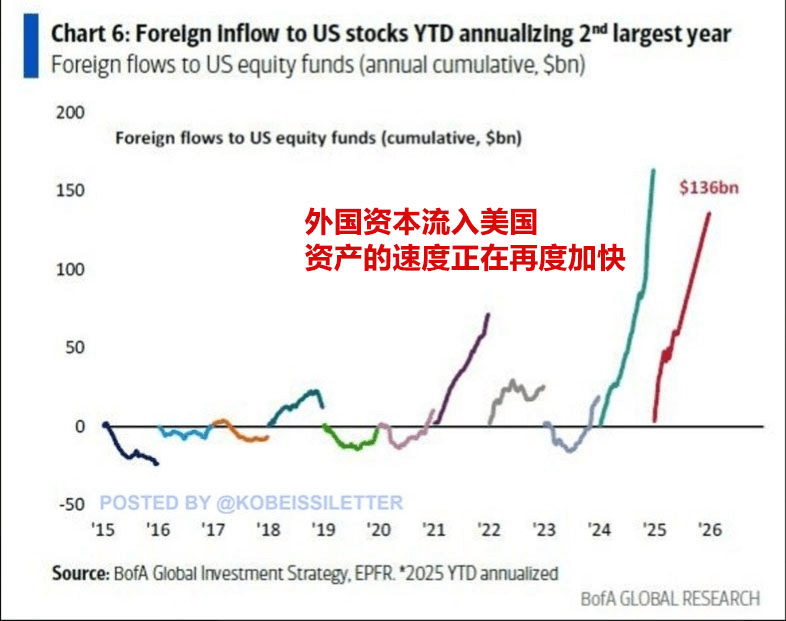
Funds have seen net inflows for 9 consecutive weeks (a total of $13.2 billion in 2025). Amid geopolitical turmoil, crypto assets have become the preferred hedge for institutions.
3. MicroStrategy's aggressive bets

High-level accumulation: Bought 10,100 BTC at an average price of $104,080 (costing $1.005 billion), total holdings increased to 592,100 BTC (accounting for 2.8% of circulation).
Arbitrage model controversy: The cycle strategy of issuing stocks for financing → buying BTC → driving up market value → refinancing has been warned by short-selling institution Citron as 'detached from fundamentals'.
Liquidation risk is extremely low: Current debt is only $4.25 billion, accounting for less than 10% of market value, unless BTC crashes to $15k, strong liquidation is unlikely.
4. Key positions and technical patterns in the battle between bulls and bears
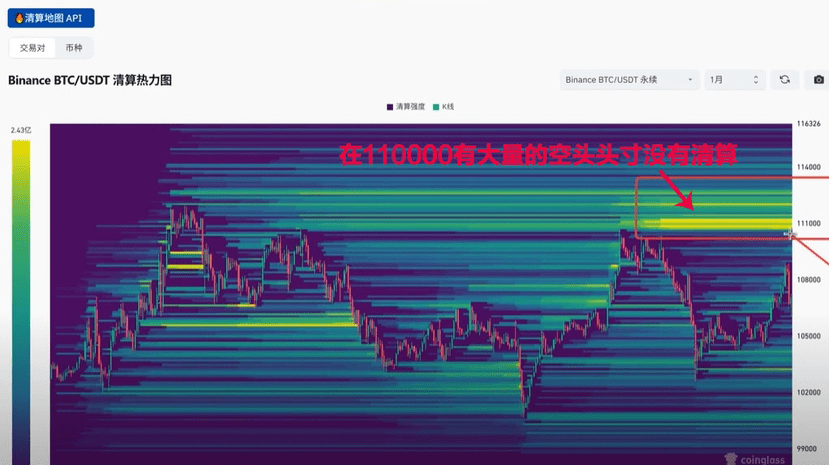
Bearish defense line 110,000
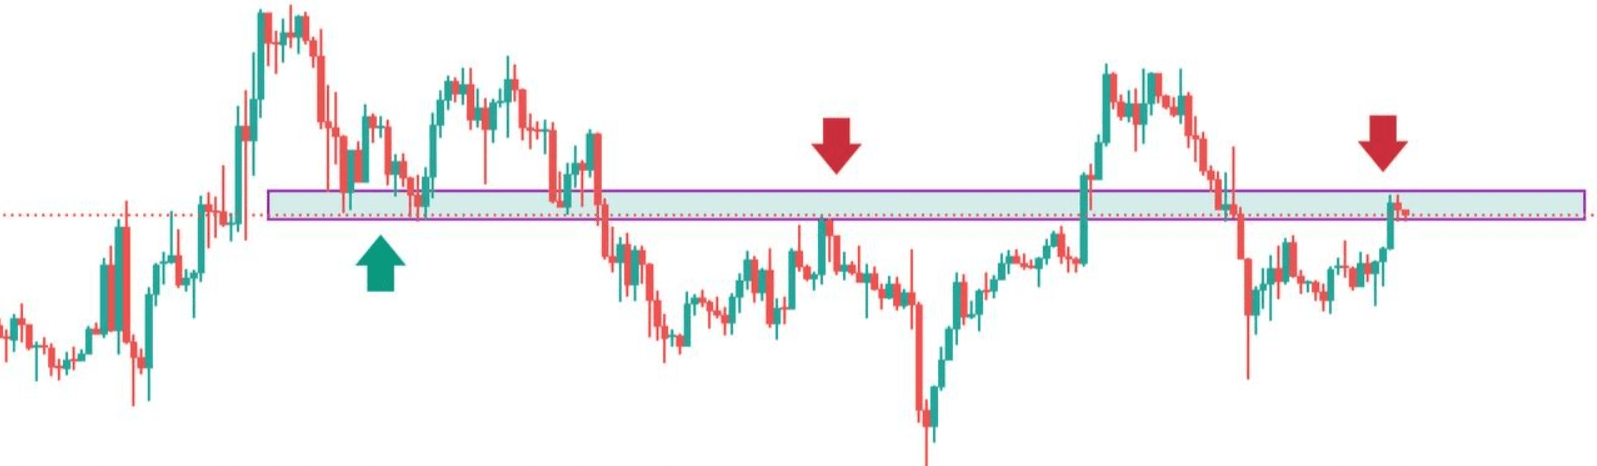
Bulls counterattack at 106,500
Battle Zone
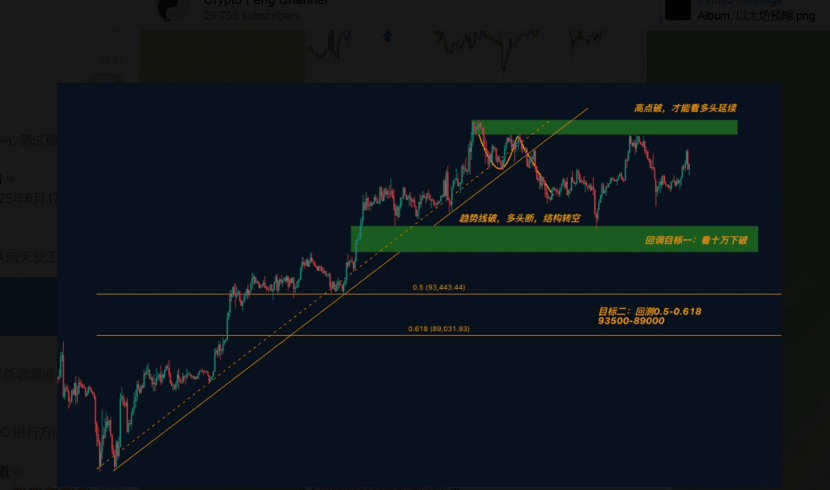
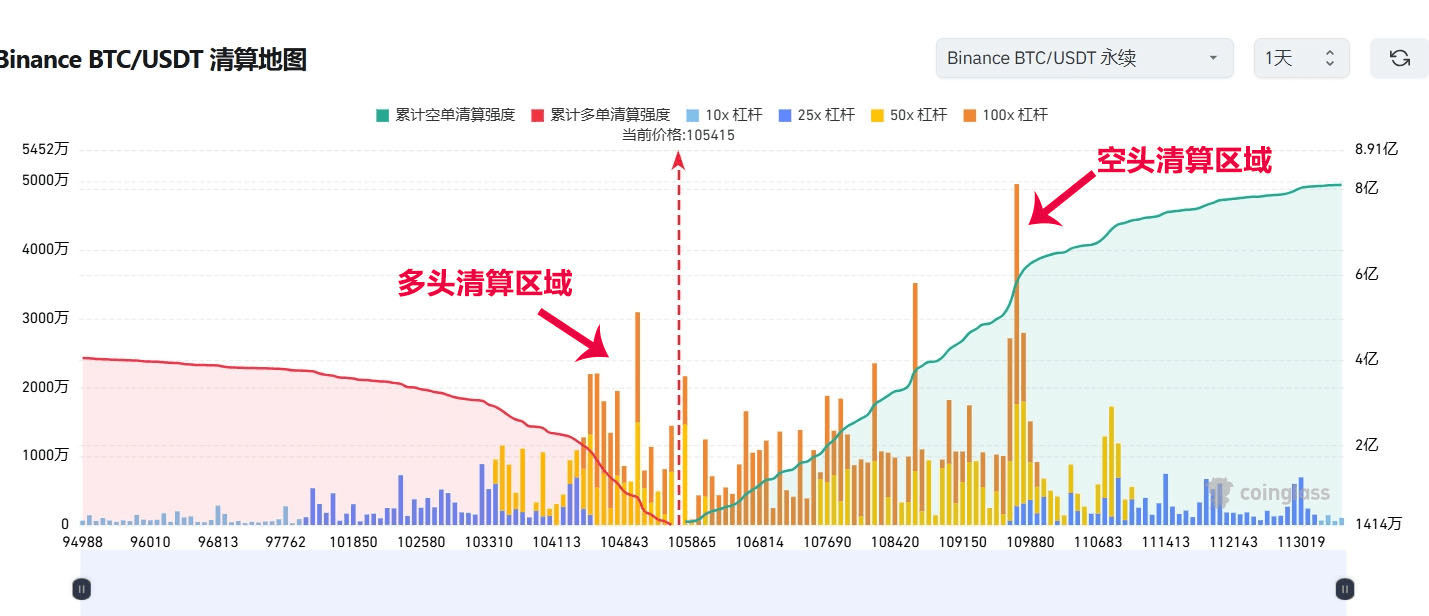
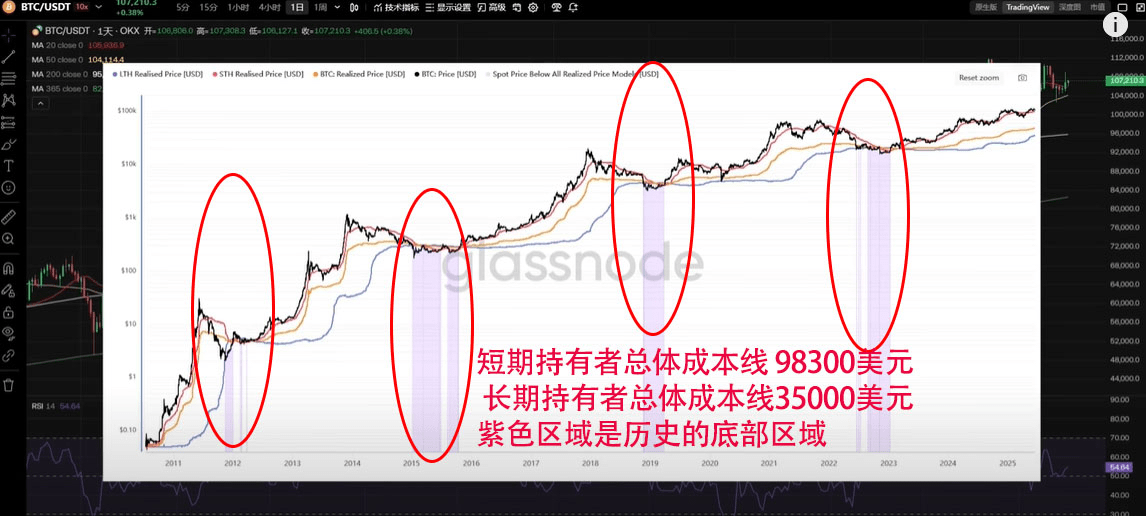
Breaking 106,500 → Test support at 93,000-98,000
Stabilize at 106,500 → Target 127,000 for the upward triangle flag.
Bullish triangle flag pattern: Daily line contracts as it prepares for a breakout, if it breaks the upper track (currently at $110,000), target $127,342 (+18%).
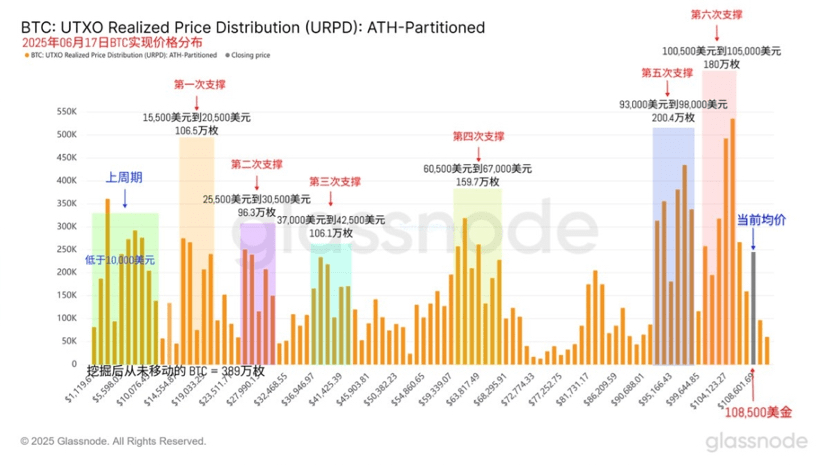
On-chain support validation: 93,000-98,000 USD range has accumulated over 2 million BTC, providing a buffer for deep declines.
5. Macroeconomic risks and interest rate cut expectations
Retail data is weak: US retail sales in May saw the largest drop of the year, tariff policies suppress consumption, but September's interest rate cut expectations remain unchanged (interest rate futures pricing still indicates 2 rate cuts).
Geopolitical black swan: Israel's airstrike on Iran triggered a $4.8 billion market cap evaporation in one day. A blockade of the Strait of Hormuz could trigger $5 billion in leveraged liquidations.
Regulatory variables: SEC's securities classification ruling on Trump-themed coins ($TRUMP) will determine the fate of the $20 billion meme coin market.
6. Trading strategies and key validation points

Operational suggestion:
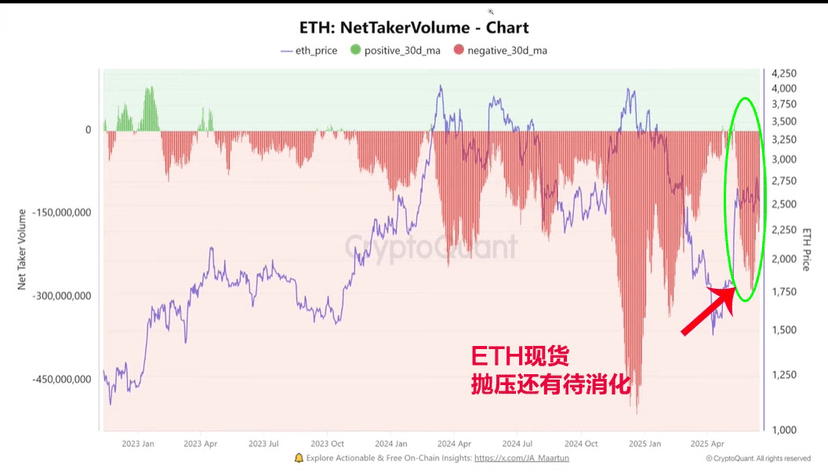
ETH follow signal: If the rebound cannot break 2,660, a short position can be laid out (support at 2,550, break accelerates).
Event-driven hedging: Buy Deribit $95k put options + $110k call options combination to lock in volatility premium.
7. Summary: Layout logic before the battle between bulls and bears
Short-term bearish: Whale sell-off + 110k technical resistance + geopolitical disturbances constitute triple pressure, with 106,500 as the dividing line between bulls and bears.
Mid-term bullish: ETF continues to accumulate (daily average of $280 million) + MicroStrategy's 'cycle buying' model supports the bottom, 93k-98k is the institutional buy zone.
Key to breaking the deadlock: If the Fed's dot plot on Thursday maintains expectations of 2 rate cuts, it may ignite a bullish explosion.
The market is being pulled between liquidity tightening and institutional support. Strictly adhering to key positions for risk control is essential to survive in the dark battle before dawn.
1. Greed and Fear Index today is: 53 Greed. After a pullback, BTC has returned to neutral.
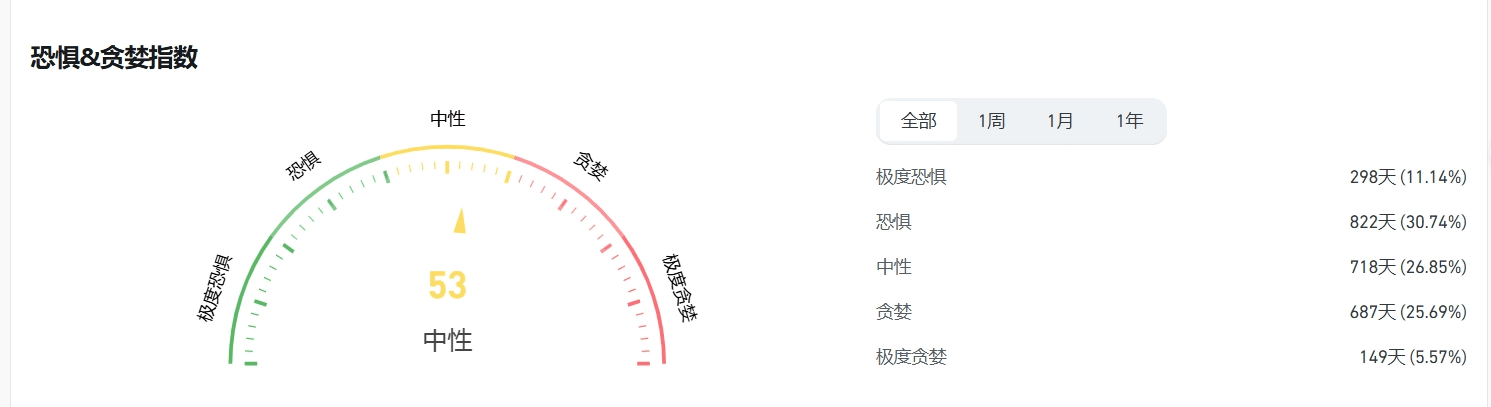
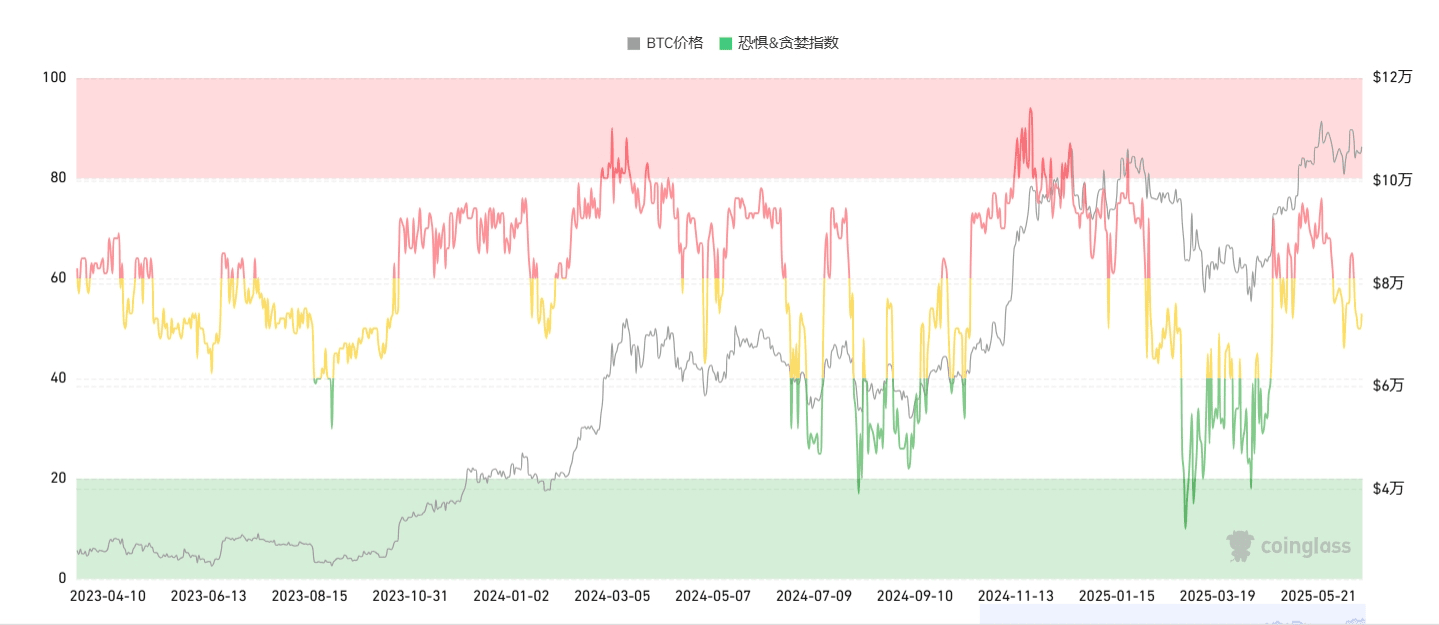
**Greed and Fear/Greed Index interpretation
The behavior of the cryptocurrency market is highly emotional. When the market rises, people tend to be greedy, generating a fear of missing out; when the market falls, they irrationally sell their cryptocurrencies.
By leveraging the greed and fear index, we aim to help friends avoid being influenced by emotional factors and make irrational judgments.
There are two states:
Extreme fear indicates that investors are overly worried, which may present a buying opportunity.
Overly greedy indicates that investors are too excited, and the market may undergo corrections.
2. Bitcoin total market share 63.38 has decreased from yesterday.
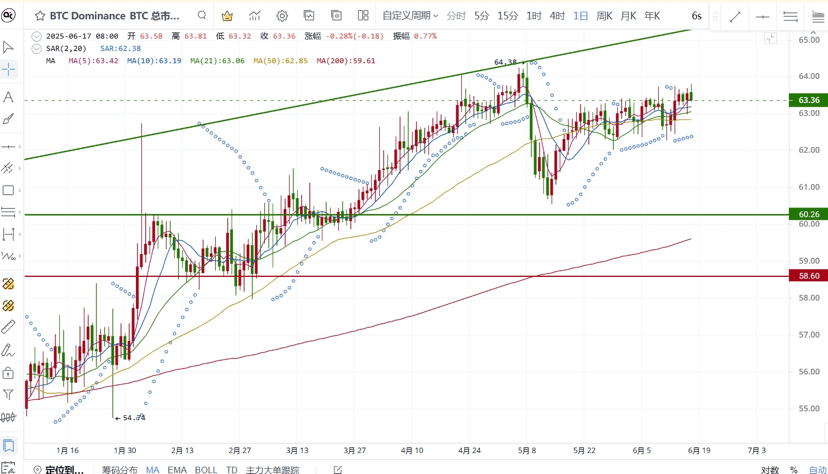
**Bitcoin's total market share is the core indicator for measuring Bitcoin's relative influence in the entire cryptocurrency market. This indicator reflects not only Bitcoin's short-term market position but also reveals changes in fund rotation, investor sentiment, and macro trends.
Bitcoin market share is the 'weather vane' for determining market phases:
Early bull market: Market share rises, funds prioritize allocation to Bitcoin.
Late-stage bull market: Market share declines, funds rotate to altcoins, triggering 'altcoin season'.
Market thermometer: >60% = Risk-averse dominant; <40% = Altcoin frenzy period.
Fund flow chart: Reveals institutional and retail allocation preferences (Bitcoin → stable, altcoins → high risk and high return)
3. Bitcoin and Ethereum trading pair 0.024148 Ethereum to Bitcoin trading basically flat.
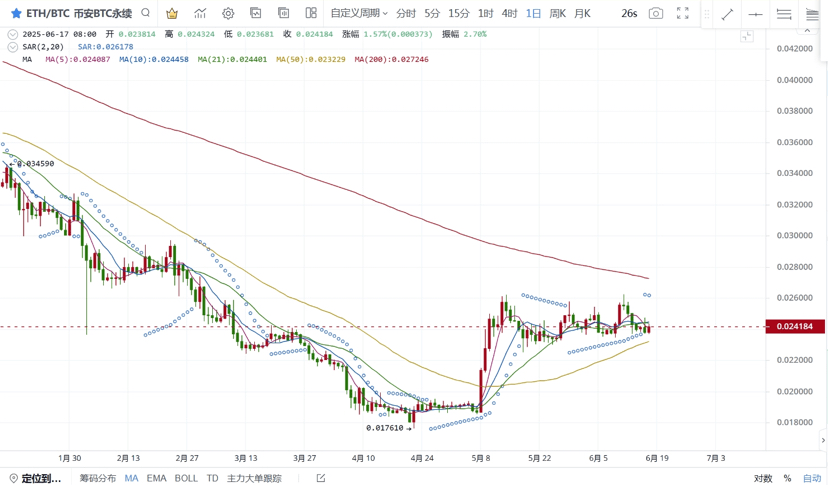
**Bitcoin/Ethereum trading pair is the cryptocurrency market's 'risk thermometer':
Ratio rises → Market prefers high-risk assets (signal for the start of altcoin season);
Ratio declines → Funds are seeking safety in Bitcoin (characteristics of a bear market or early bull market).
4. ETF inflow and outflow data ETF data shows slight net inflow
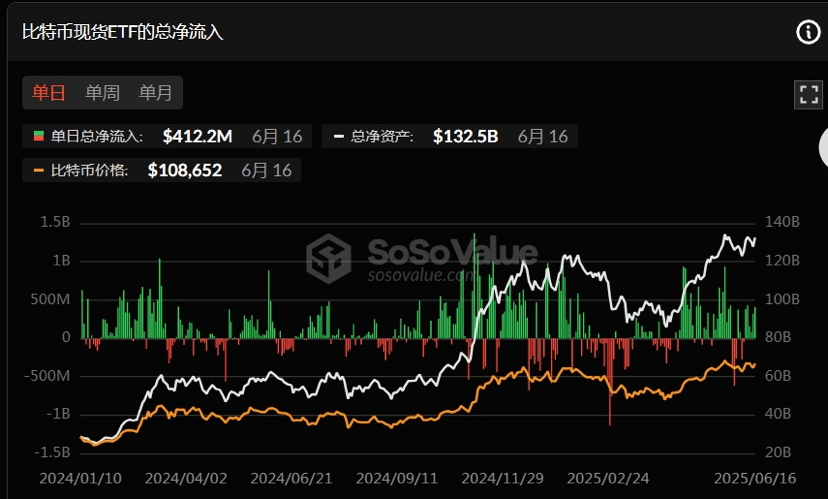
**ETF inflow and outflow data explanation: The inflow and outflow data of Bitcoin ETFs is a core indicator for tracking institutional sentiment, market trends, and fund rotation.
5. Statistics on on-chain BTC buying and selling data of retail investors, large holders, and institutions: Large whales sold off (largest in nearly two weeks).
Thanks to @TraderPunk for providing data organization and sharing.
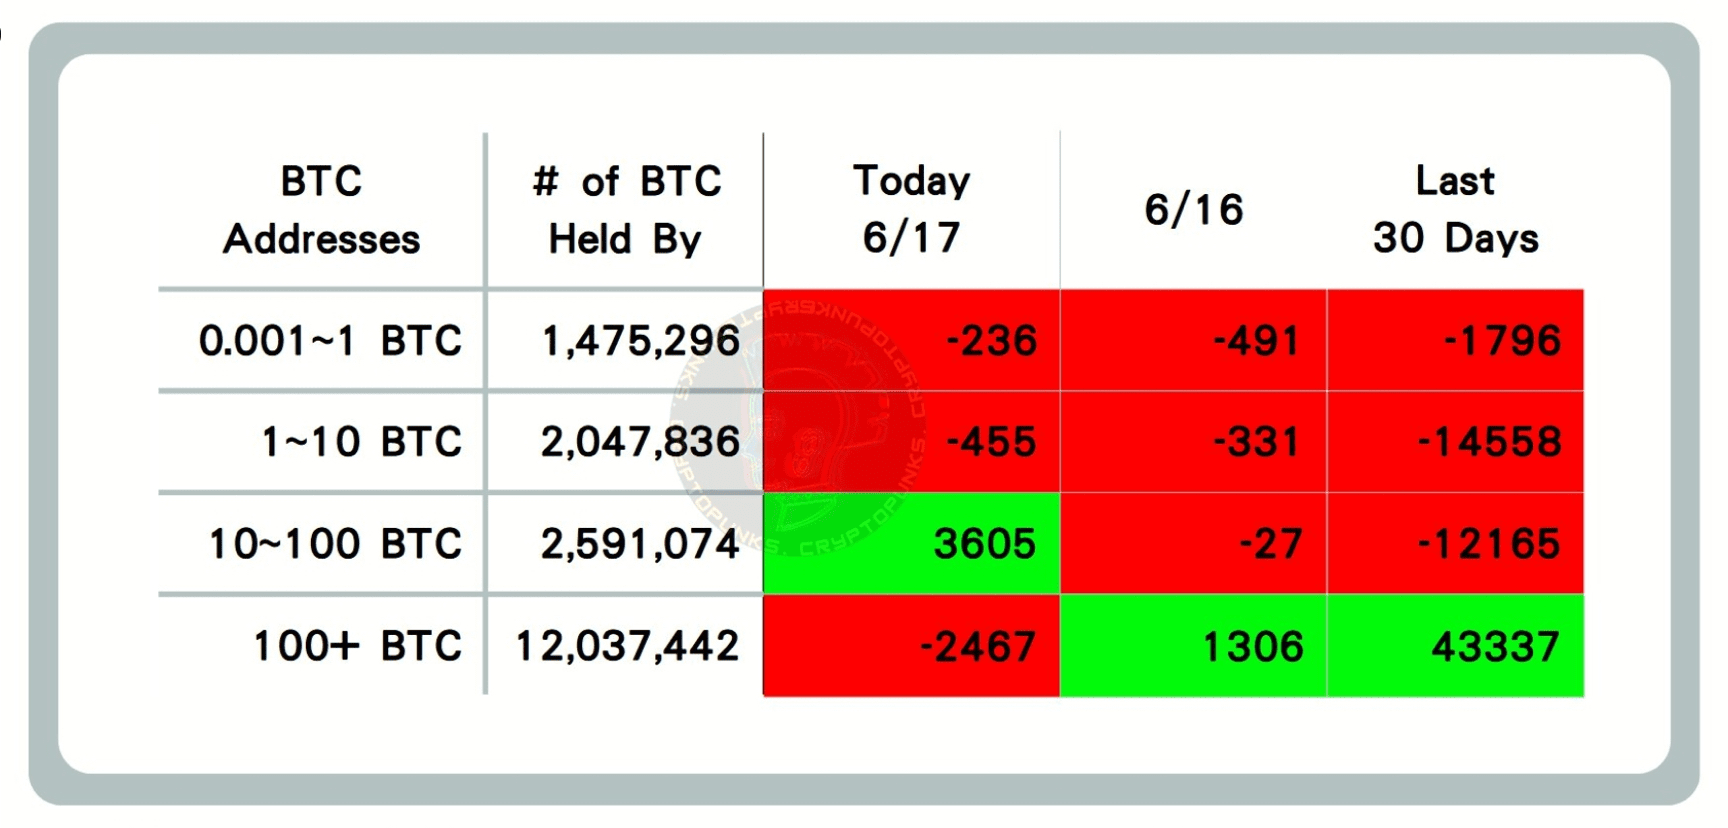
Data explanation: Represents the increase or decrease of on-chain flows for ≤ 1 BTC, 1-10 BTC, 10-100 BTC, and 100+ BTC, this data can reflect market sentiment among retail investors, large holders, and institutions.
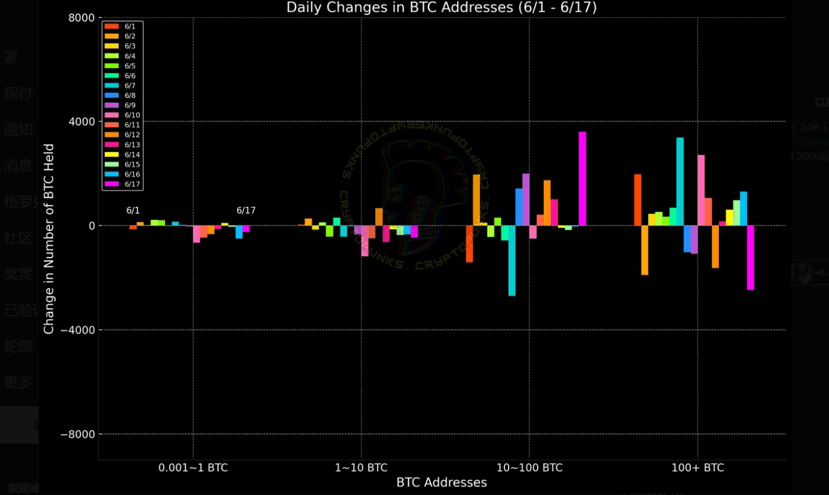
Data explanation: This data reflects the increase or decrease of on-chain flows for ≤ 1 BTC, 1-10 BTC, 10-100 BTC, and 100+ BTC within a week, this data can intuitively reflect the BTC flow trends among retail investors, large holders, and institutions.
When an extreme situation occurs in on-chain data, a reversal often occurs (for example, if large whales with over 100 BTC buy a large amount while others sell, the probability of Bitcoin rising significantly increases, and vice versa). This should also be analyzed in conjunction with other on-chain data and technical indicators.
6. MVRV realized market value ratio MVRV > 1
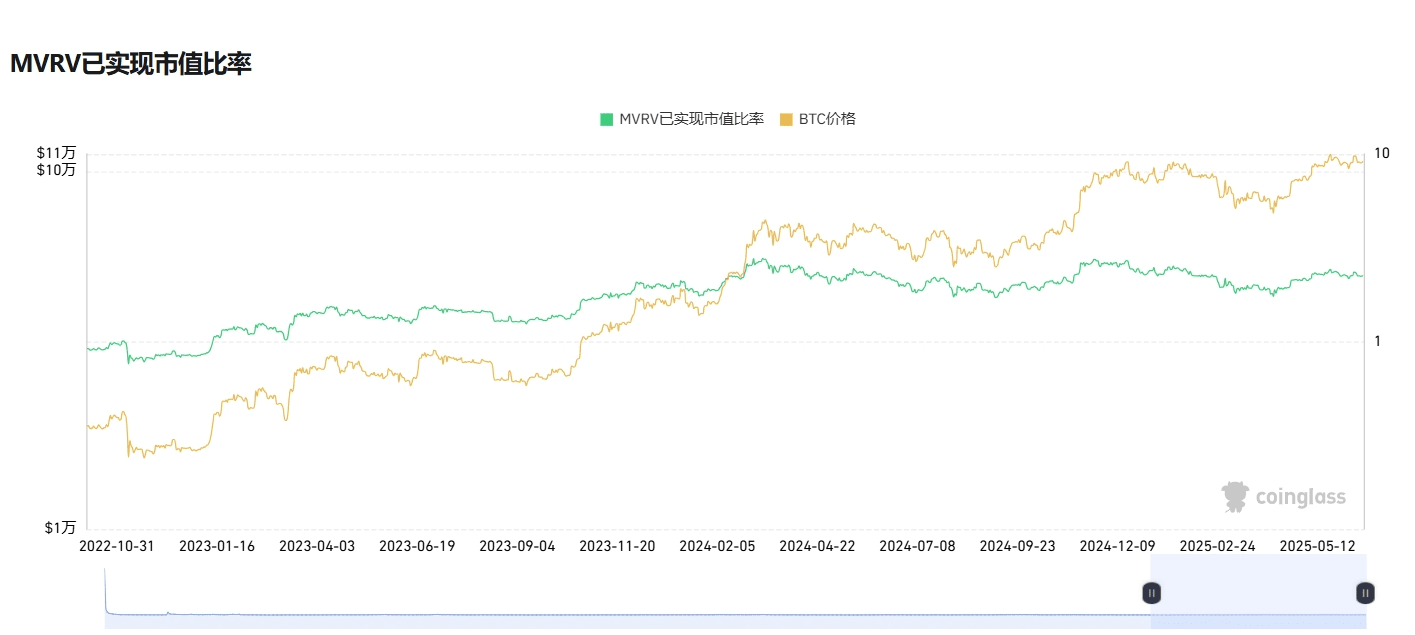
**MVRV realized market value ratio indicator explanation: MVRV realized market value ratio is an indicator used to assess the cryptocurrency market (especially Bitcoin), it helps friends judge whether assets are overvalued or undervalued and identify potential tops and bottoms in market cycles.
MVRV > 1
When the ratio is greater than 1, it indicates that market prices are above realized prices, meaning most holders are in a profit state. This may indicate that the market is overheated, especially when MVRV reaches historical highs, which may signal a market top.
MVRV < 1
When the ratio is less than 1, it indicates that market prices are below realized prices, meaning most holders are in a loss state. This may indicate that the market is undervalued, especially when MVRV reaches historical lows, which may signal a market bottom.
7. Altcoin Season Index 20. Is it altcoin season: No. A slight rebound from yesterday.
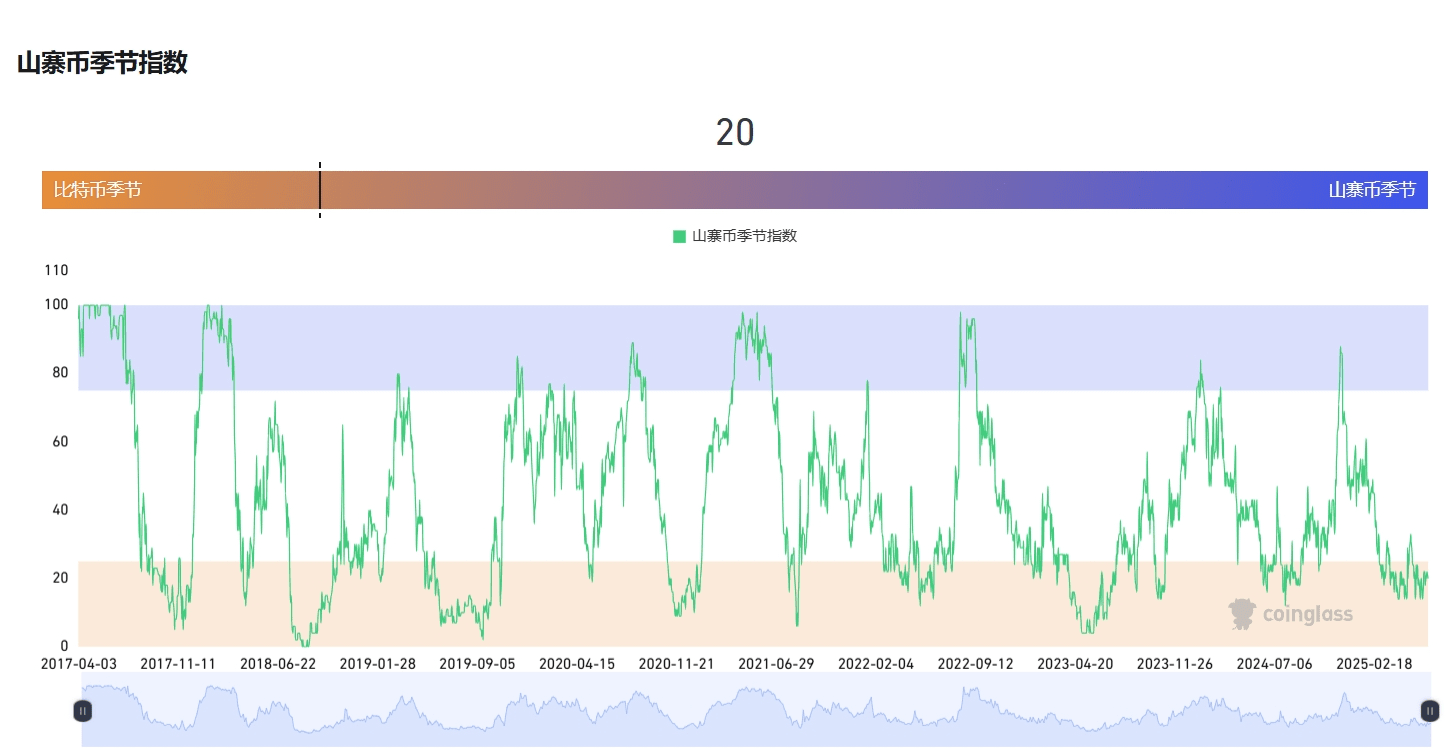
**Altcoin season index explanation: The altcoin season index is an indicator used to measure the performance of non-Bitcoin cryptocurrencies in the market. It is usually used to determine whether altcoins are outperforming Bitcoin during a specific time period, helping investors understand market trends and investment opportunities.
8. USD inflow into the cryptocurrency market continues but at a slower pace.
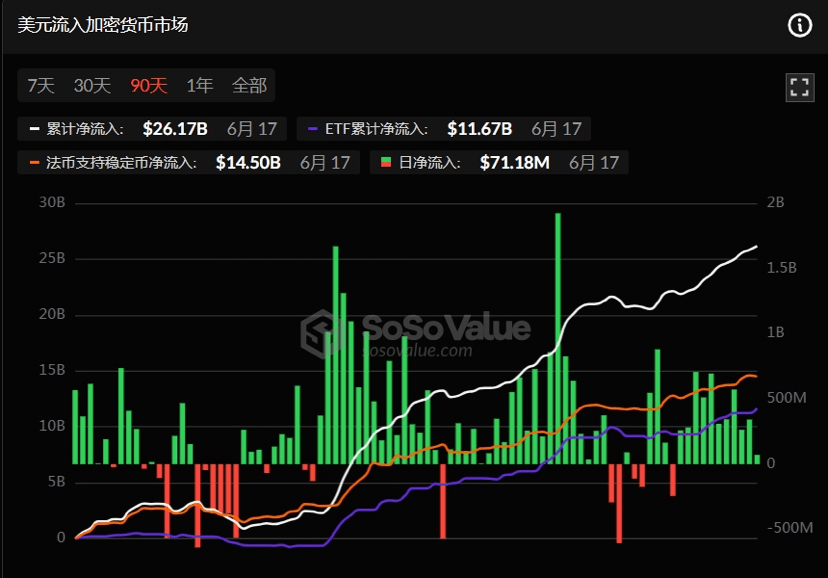
9. Fiat currency supports stablecoin net inflow (USD stablecoins with market cap >100M) Small inflow

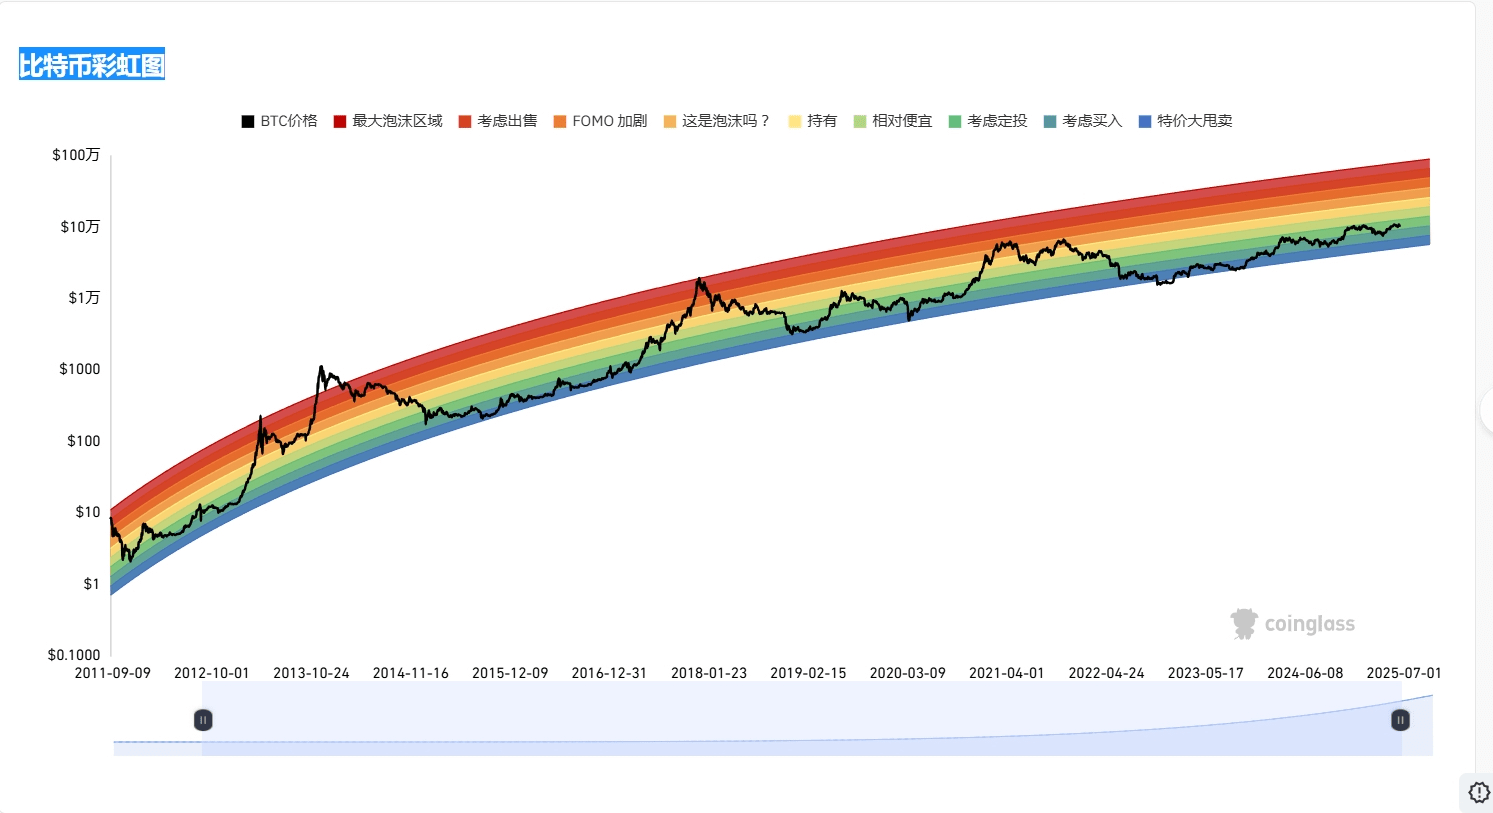
10. Rainbow chart shows that BTC does not show signs of peaking.
The above data only represents the perspective of on-chain data to predict BTC volatility trends and market sentiment and does not represent any investment advice, please make decisions carefully!!

I am Mingzhu, follow me for daily sharing of real-time on-chain data and dynamics to help friends anticipate decisions. Exciting content not to be missed, welcome to leave comments for discussion.
