🔄 1. Altcoins and Bitcoin Exchange Supply Show Significant Divergence
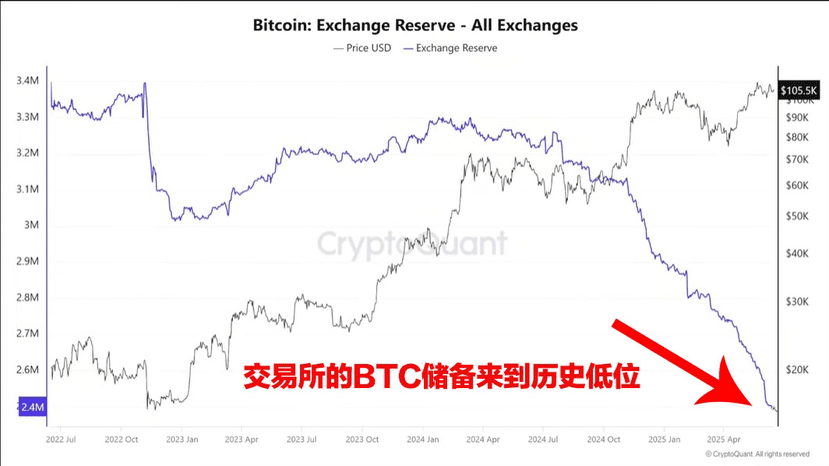
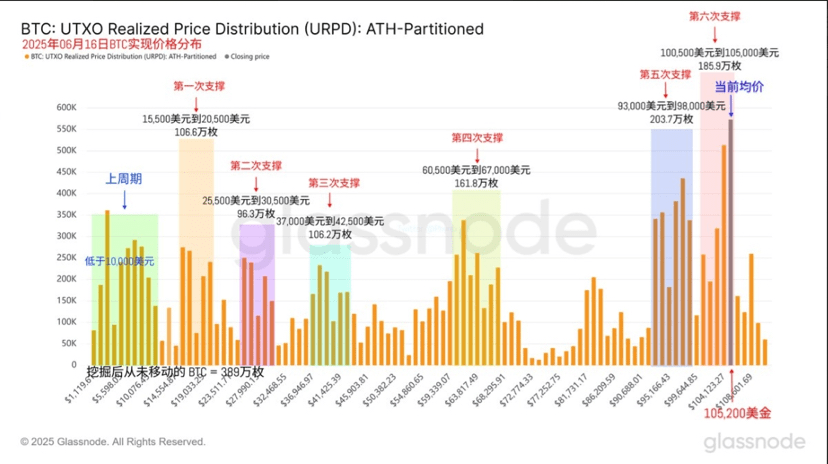
Bitcoin Supply on Exchanges Continues to Decline: Long-term holders (LTH) and institutions remain steadfast in accumulating at high prices; on-chain data shows that the number of whale addresses (holding ≥1,000 BTC) is stable with no large-scale sell-offs.
Altcoin Exchange Supply Has Not Increased: Historically, new highs in BTC often bring FOMO sentiment in altcoins, while in this round of market conditions, BTC is in a historically high area, and altcoin holders have not transferred chips to exchanges for selling or stop-loss, showing a clear divergence from Bitcoin.
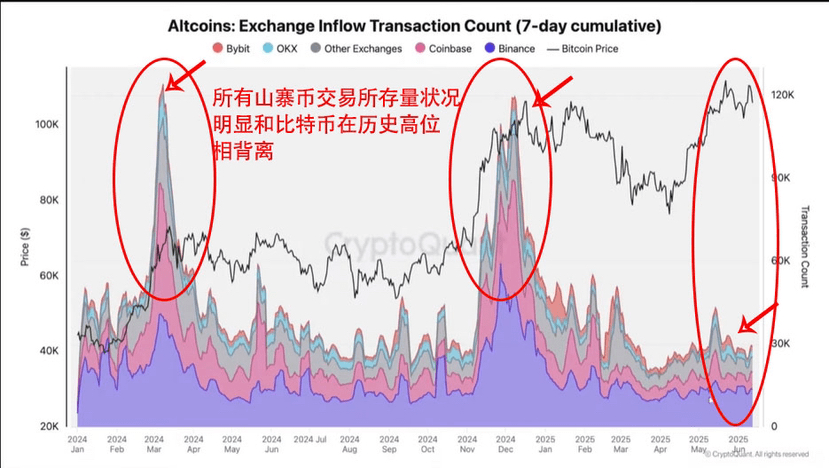
💎 Root of Divergence: Bitcoin is supported by institutional ETF fund inflows and the implementation of regulatory compliance; meanwhile, altcoins lack similar mechanisms and are more easily influenced by retail sentiment. Additionally, in this round of market conditions, Wall Street whales prefer BTC, and a large amount of funds has not entered the altcoin market.
🧮 2. Behavior Divergence Among Holders: Long-term Accumulation vs Short-term Selling

Extreme Sentiment Signals Arising: Whale buying and retail selling form a 'reverse consensus'; historically, similar structures are often accompanied by mid-term price breakouts.
📊 3. On-Chain Data and Technical Key Signals for June 16
On-Chain Dynamics
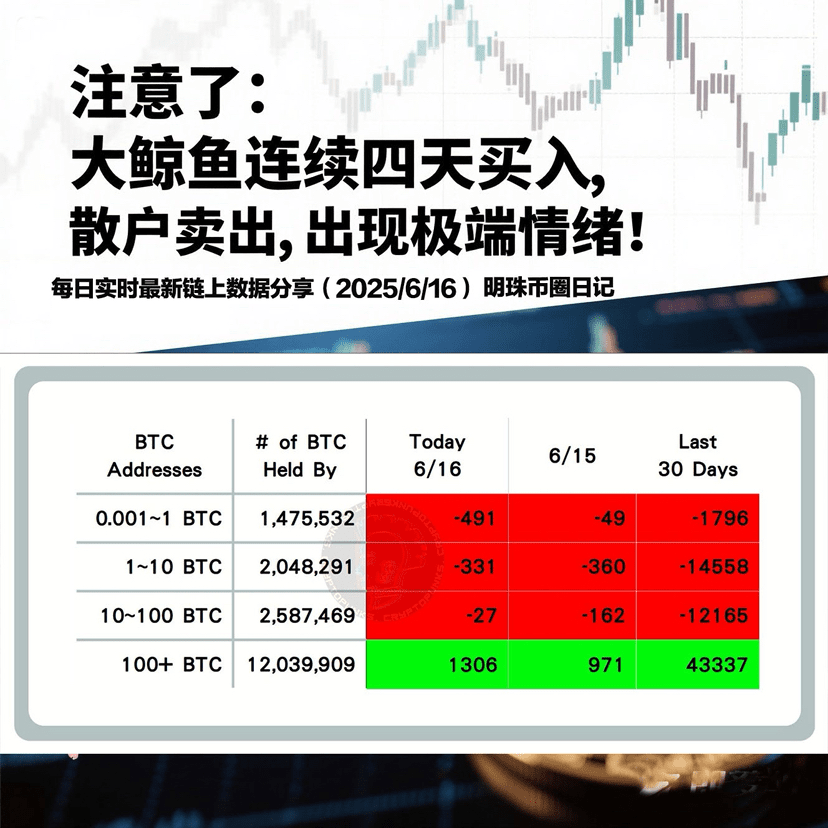
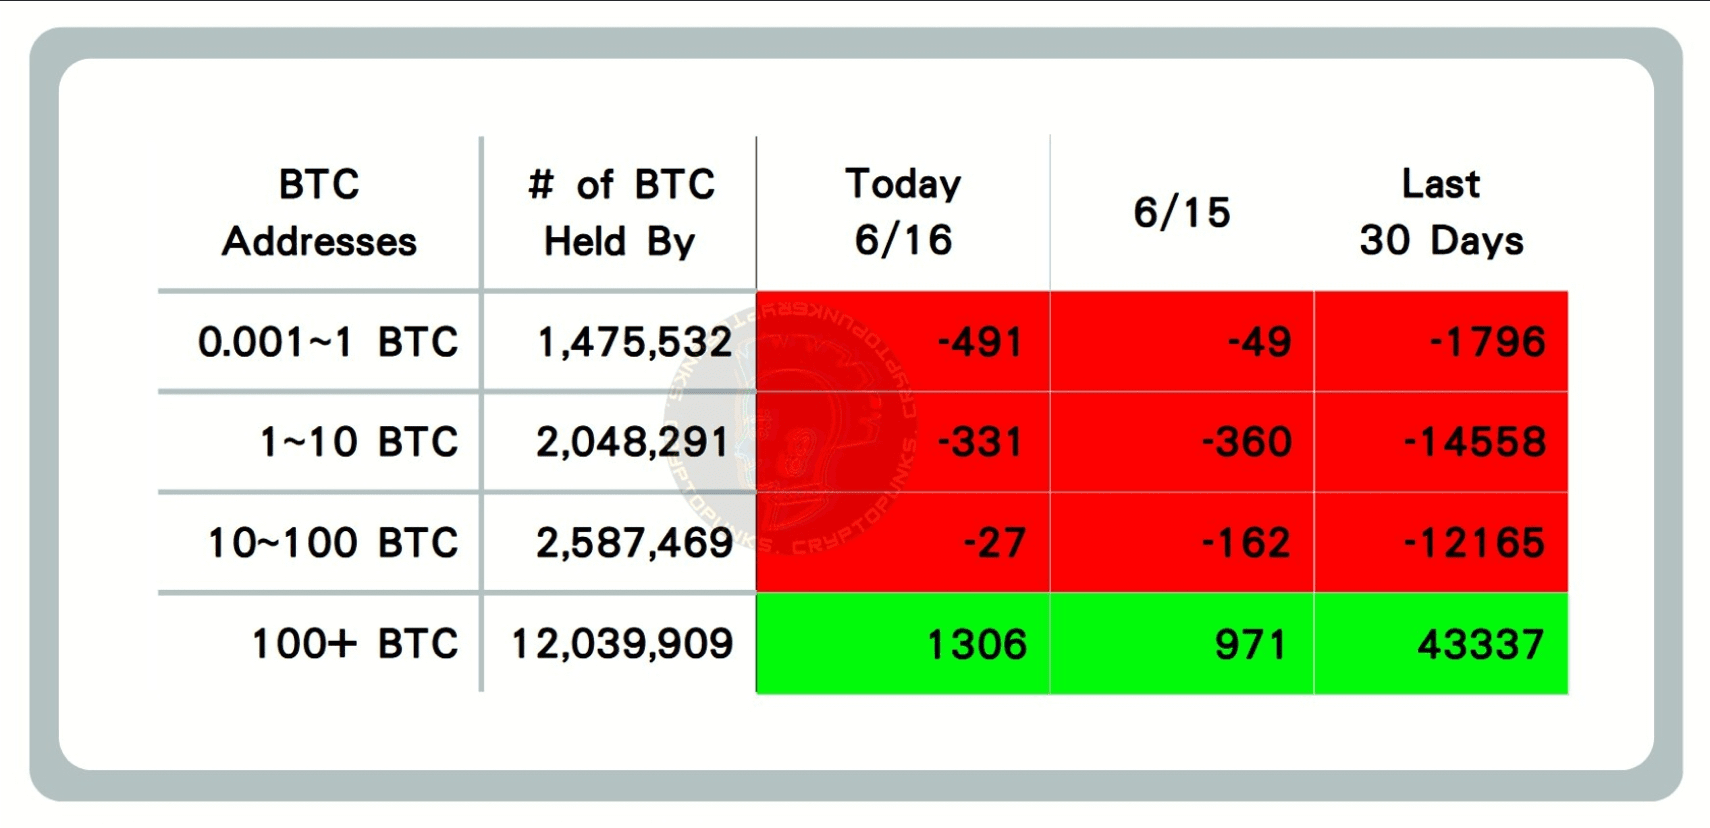
Surge in Large Transactions: 100+ BTC whale addresses net buying for four consecutive days, on-chain activity points to accumulation.
Retail Enthusiasm Weakening: On-chain small and medium transactions continue to sell, with market sentiment showing extremes, often indicating an impending trend change.
Technical Structure
Volatility Range Narrowing: The 4-hour chart forms a micro-channel of $103,150–$105,400, and the contraction of the Bollinger Bands indicates a breakout is near.
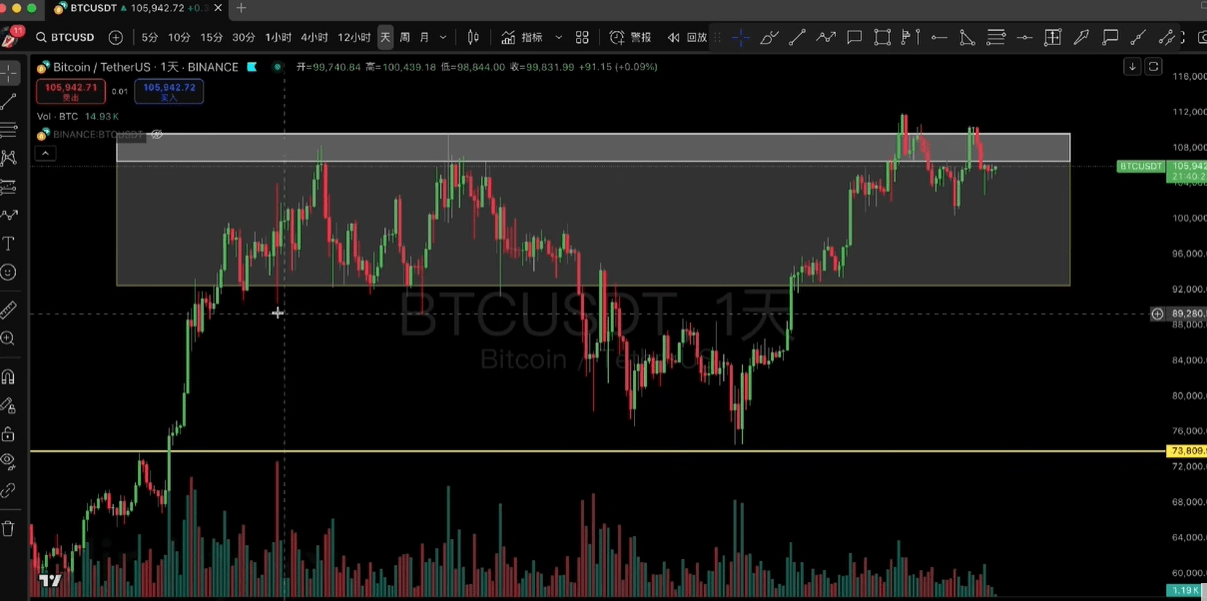
Key Level Distribution:
Support: $104,200 (Fibonacci 0.618 level) → $103,150 (High Volume Area) → $101,200 (Strong Macro Support).
Resistance: $106,300 (EMA Cluster + Cloud Resistance) → $108,150 (Daily 0.382 Fibonacci Level)69.
Bull-Bear Momentum: 30-minute MACD Dead Cross + RSI Falling to 45, a short-term volume breakout above $106,000 is needed to reverse the neutral to bearish structure.
Ethereum Linkage:
Support raised to $2,550 (top-bottom conversion point); a break above $2,650 will trigger right-side chasing opportunities.
🌐 4. Triple Catalysts of Macro Events Next Week
Japan Interest Rate Decision (6/17): Expecting to maintain status quo, limited impact on the market.
U.S. Retail Sales Data (6/18):
Expected negative growth: Reflects consumer weakness and economic slowdown pressures; if the actual is lower than expected, it may strengthen rate cut bets, benefiting risk assets.
Federal Reserve Meeting (6/19-20):
Interest rates unchanged are priced in: Focus on the dot plot (whether to maintain expectations of one rate cut this year) and Powell's speech tone.
Potential Disturbance: If the dot plot turns more hawkish (e.g., suggesting no rate cuts), the dollar may rebound to suppress BTC; if the rate cut path is opened up, it could ignite a bull market.
⚠️ Geopolitical Risks Accumulating: Middle East conflicts are driving up gold's safe-haven demand, but Bitcoin has not received equivalent fund inflows, questioning its safe-haven attributes.
💎 5. Operational Strategy and Conclusion
Essence of Divergence: The differentiation in exchange supply reflects the accelerated 'institutionalization' of Bitcoin, while altcoins remain trapped in a retail-driven model. Looking at the medium term, BTC is expected to continue its relative strength.
Short-term Direction Anchor Point:
Break above $106,300: Confirming the return of bulls, target $108,150→$110,000.
Loss of $104,200: Testing support at $103,150, extreme scenarios may test $101,20069.
Positioning Suggestions:
BTC: Holding above the midline ($105,000), reduce positions if it falls below $104,500.
ETH: Increase positions above $2,650, maintain base at $2,550.
Macro Hedge: Reduce leverage before Wednesday to guard against risks of unexpected hawkish moves from the Fed triggering a dollar rebound.
The market is on the eve of an institutional-led valuation reassessment, with divergences and volatility being a necessary phase for a long bull run. Stabilizing at key levels, awaiting trend resonance after policy implementation.
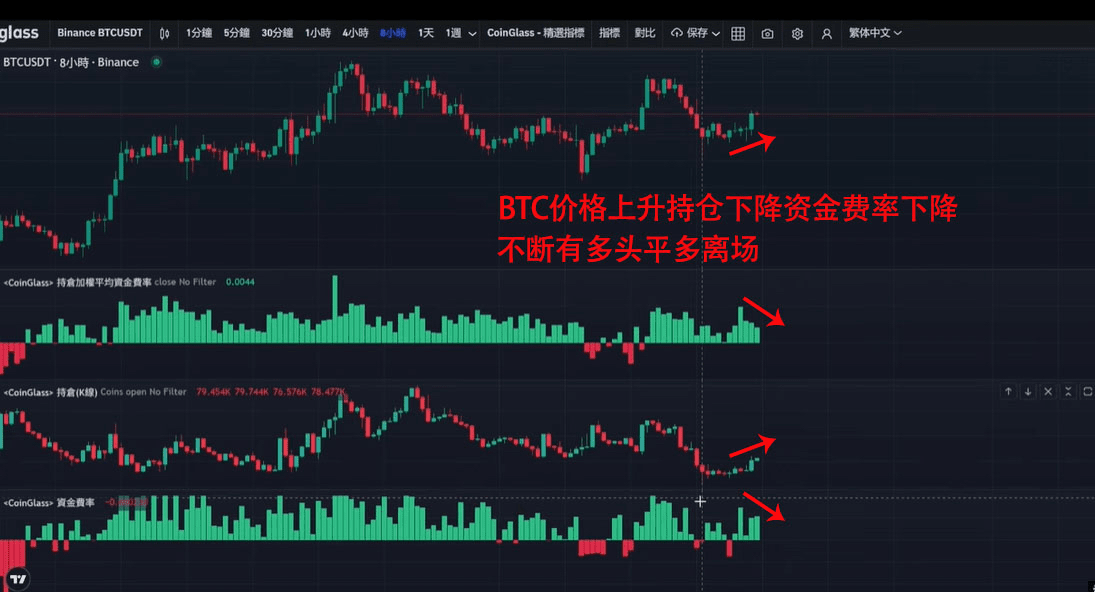
BTC price slightly up, position volume rising, funding rates decreasing, reflecting that many bulls are exiting while many short positions are being established.
1. Greed and Fear Index Today: 50 Neutral The market has returned to neutral after experiencing a pullback
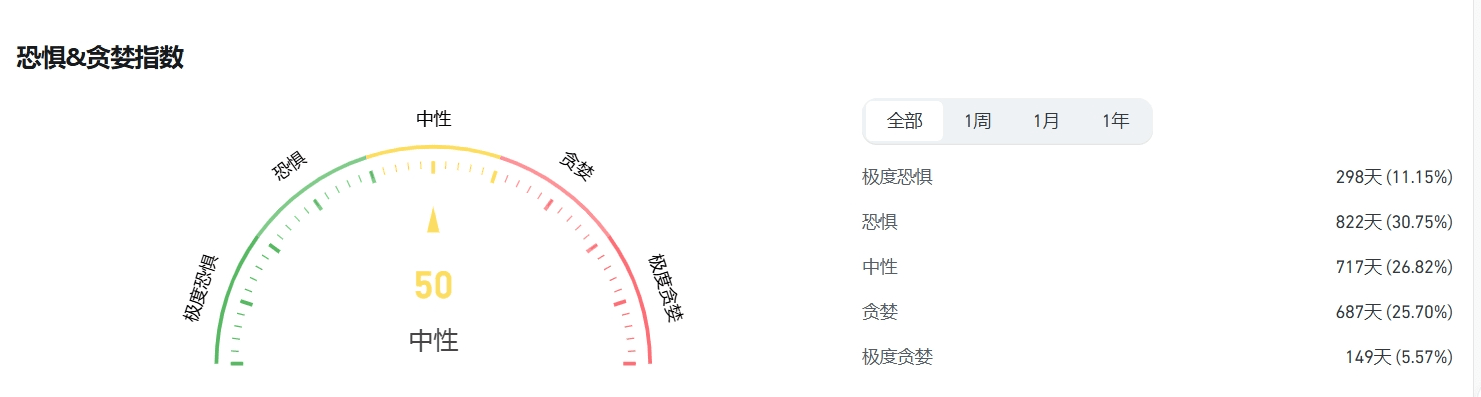
**Greed and Fear/Panic Index Interpretation
The behavior of the cryptocurrency market is very emotional. When the market rises, people tend to be greedy, feeling a fear of missing out; when the market falls, they irrationally react by selling their cryptocurrencies.
Utilizing the Fear and Greed Index, we strive to help everyone avoid making irrational judgments influenced by their emotions.
There are two states:
Extreme fear indicates that investors are overly worried, which may be a buying opportunity.
Excessive greed indicates that investors are overly excited, and the market may undergo an adjustment.
2. Bitcoin Total Market Share 63.12 Slightly Decreased from Yesterday
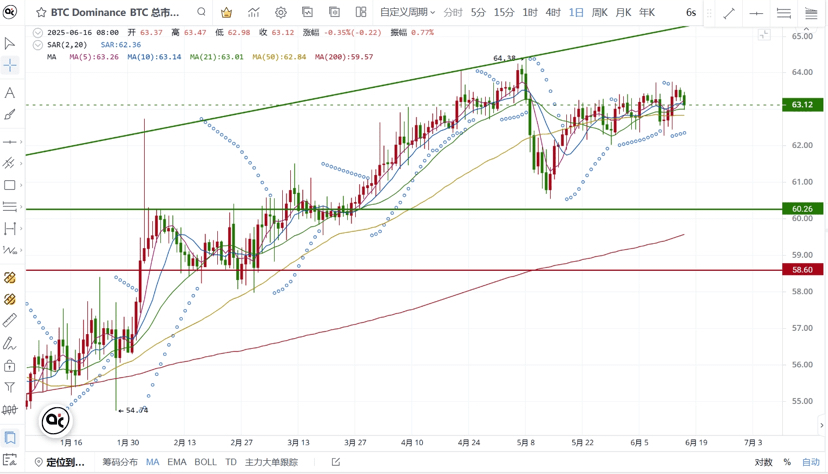
**Bitcoin's Total Market Share is a core indicator measuring Bitcoin's relative influence in the entire cryptocurrency market. This indicator reflects not only Bitcoin's short-term market position but also reveals changes in fund rotation, investor sentiment, and macro trends.
Bitcoin's market share is a 'weather vane' for assessing market phases:
Early Bull Market: Market share rises, funds prioritize allocation to Bitcoin.
Late Bull Market: Market Share Decreases, Funds Rotate to Altcoins, Triggering 'Altcoin Season'
Market Thermometer: >60% = Risk Aversion Dominating; <40% = Altcoin Frenzy.
Capital Flow Chart: Revealing the allocation preferences of institutions versus retail (Bitcoin → Steady, Altcoins → High-Risk High-Return)
3. Bitcoin and Ethereum Trading Pair 0.024518 Ethereum to Bitcoin Trading Remains Strong
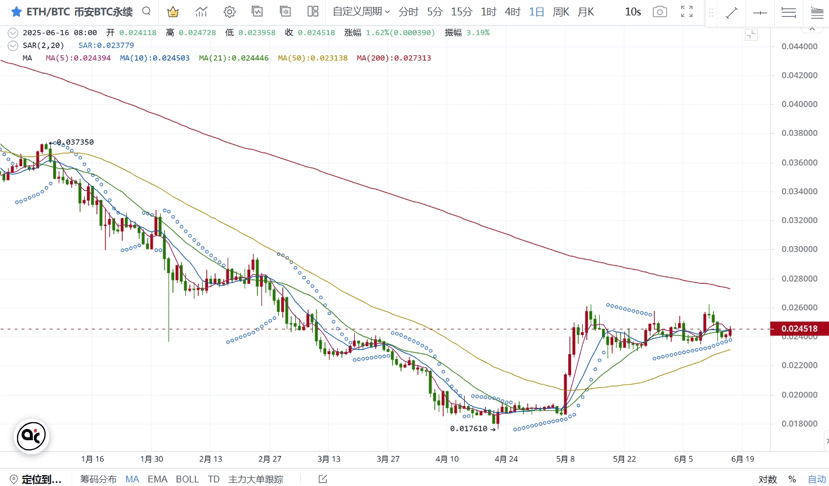
**The Bitcoin/Ethereum Trading Pair is the 'Risk Thermometer' of the Cryptocurrency Market:
Ratio Increase → Market Preference for High-Risk Assets (Signal for Initiating Altcoin Season);
Ratio Decline → Funds Seeking Safety in Bitcoin (Characteristics of Bear Market or Early Bull Market).
4. MVRV Realized Market Value Ratio MVRV > 1
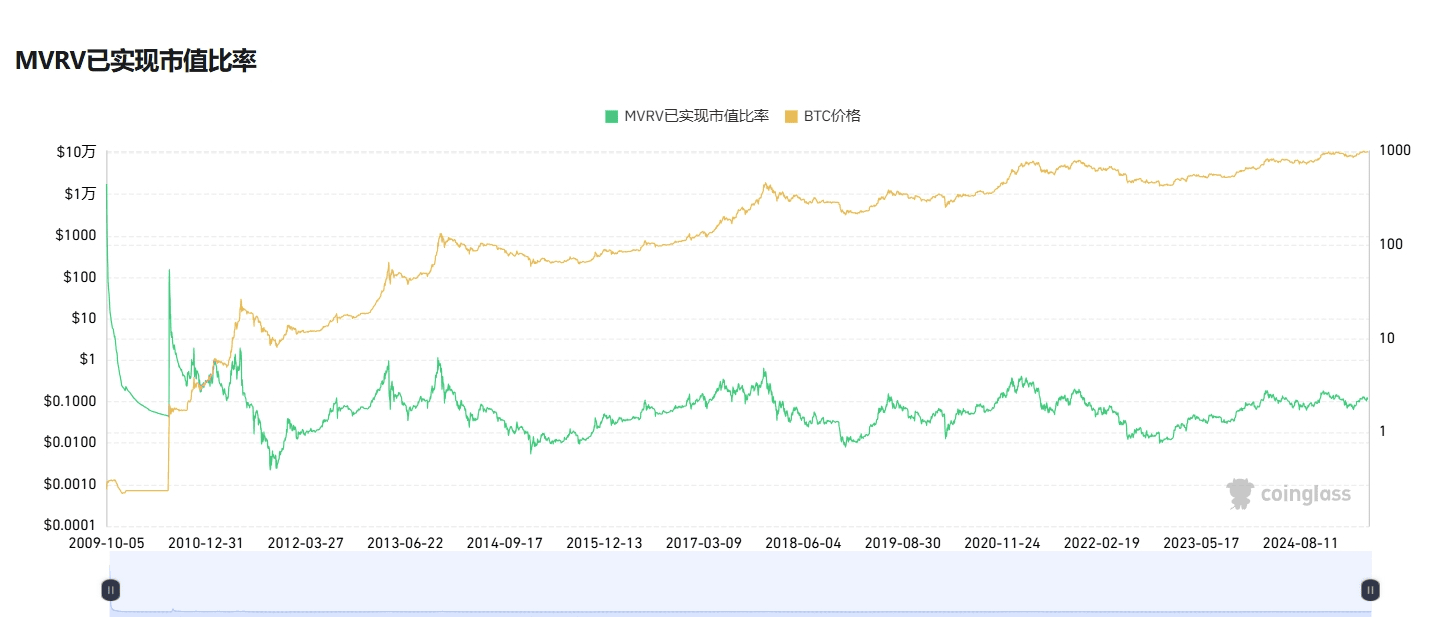
**MVRV Realized Market Value Ratio Indicator Explanation: MVRV Realized Market Value Ratio is an indicator used to assess the cryptocurrency market (especially Bitcoin). This indicator helps participants determine if an asset is overvalued or undervalued and identifies potential tops and bottoms in market cycles.
MVRV > 1
When the ratio is greater than 1, it indicates that the market price is above the realized price, meaning most holders are in a profit position. This may suggest that the market is overheated, especially when MVRV reaches historical highs, which may indicate a market top.
MVRV < 1
When the ratio is less than 1, it indicates that the market price is below the realized price, meaning most holders are in a loss position. This may suggest that the market is undervalued, especially when MVRV reaches historical lows, which may indicate a market bottom.
5. Altcoin Season Index 20 Is it Altcoin Season: No Slight Recovery from Yesterday
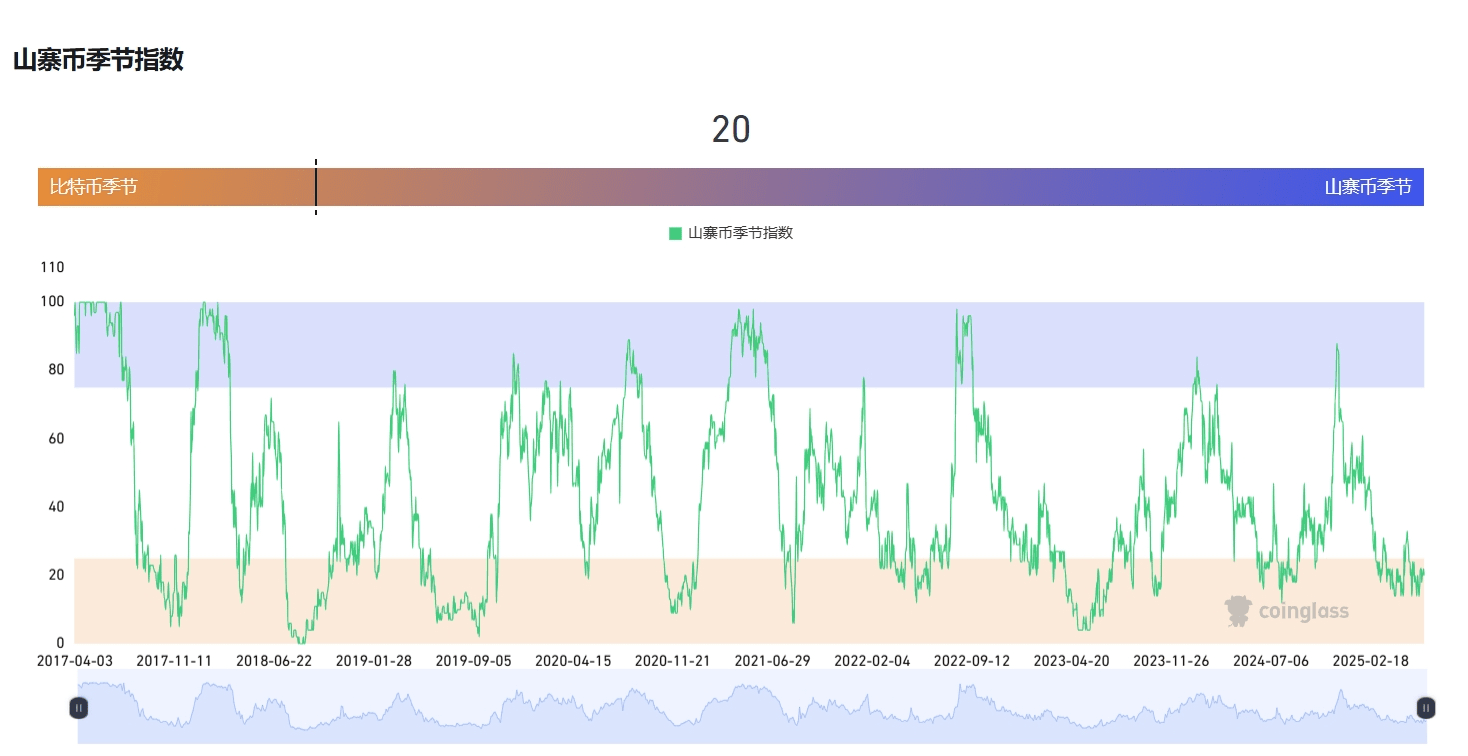
**Altcoin Season Index Explanation: The Altcoin Season Index is an indicator used to measure the performance of non-Bitcoin cryptocurrencies in the market. It is typically used to determine whether altcoins are outperforming Bitcoin over a specific period, helping investors understand market trends and investment opportunities.
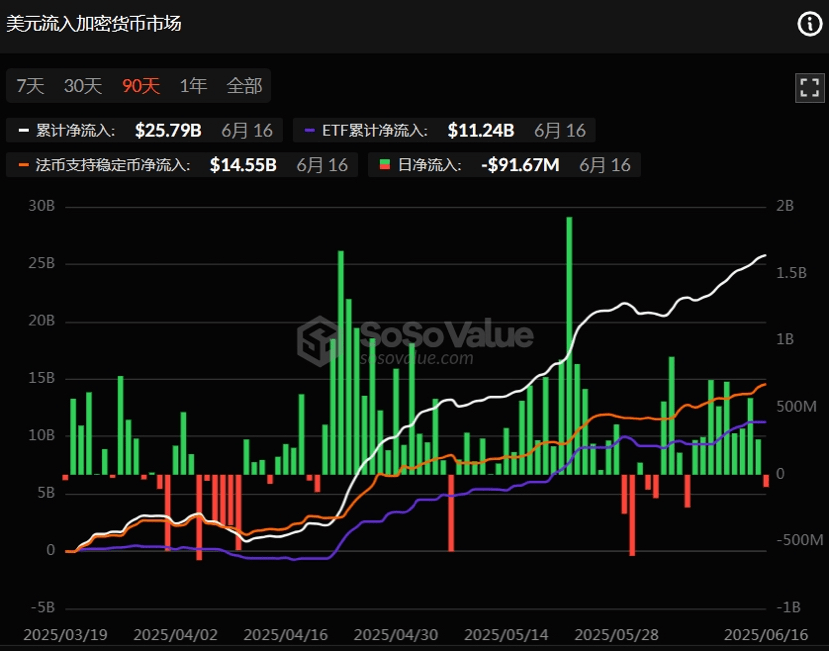
6. Dollar Inflows to the Cryptocurrency Market Slight Outflow After Maintaining Net Inflows for Several Days
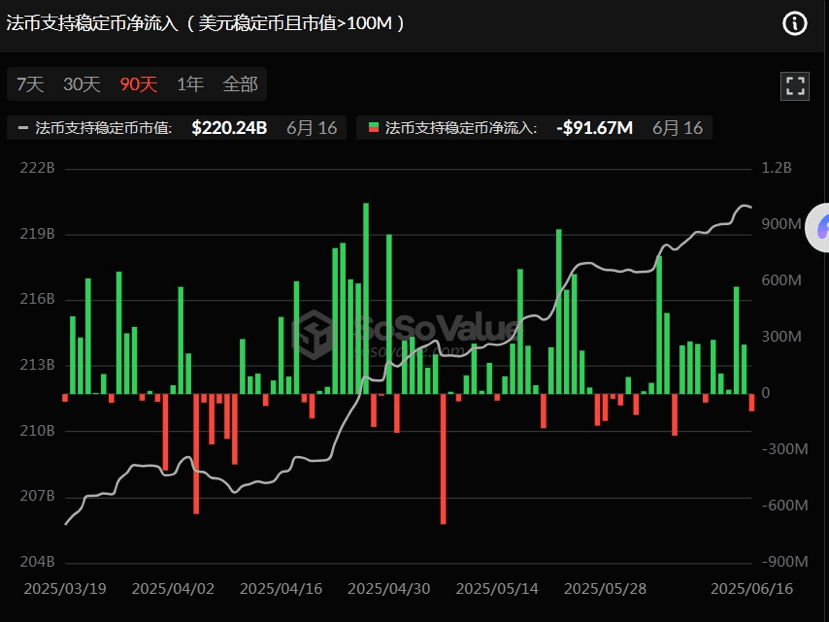
7. Fiat Currency Supporting Stablecoin Net Inflows (USD Stablecoin with Market Cap > 100M) Slight Outflow After Maintaining Net Inflows for Several Days
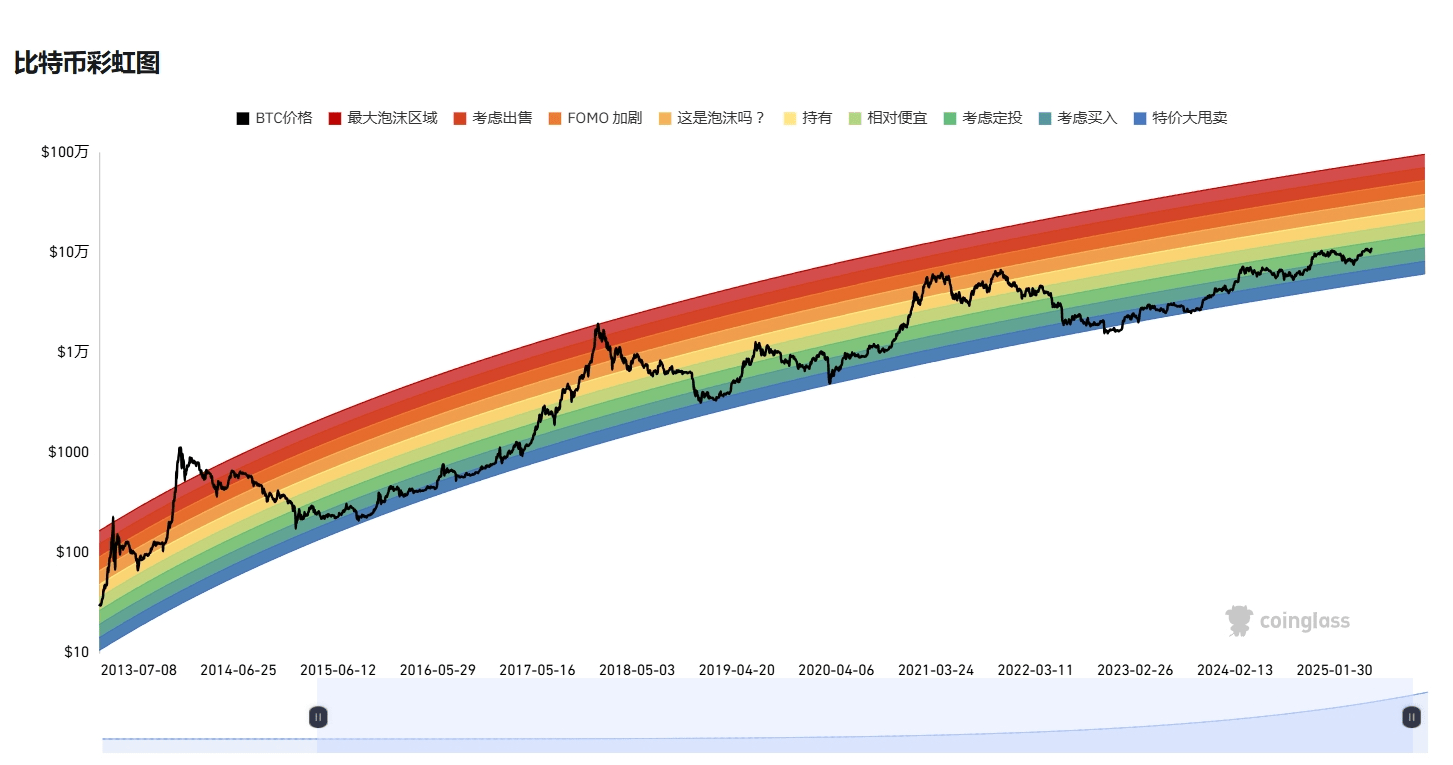
8. Rainbow Chart Shows No Signs of Bitcoin Reaching a Peak
The above data only represents an anticipation of BTC volatility trends and market sentiment from the perspective of on-chain data and does not constitute any investment advice. Please make decisions carefully!

I am Mingzhu, follow me for daily sharing of real-time on-chain data and dynamics, helping everyone to anticipate decisions, exciting content not to be missed, and welcome to leave comments for discussion.