In the cyclical fluctuations of Bitcoin prices, there is a widely concerned yet often overlooked signal: the deviation between spot prices and the cost of loss-making chips. Changes in this data often quietly herald significant shifts in market sentiment and trends.
Typically, when the spot price gradually approaches the average holding cost of BTC in all loss states, the market may be entering a new bull market phase. When the deviation approaches 1, it means that almost all Bitcoin chips are in a state of floating profit, which often corresponds to a periodic peak of a market cycle.
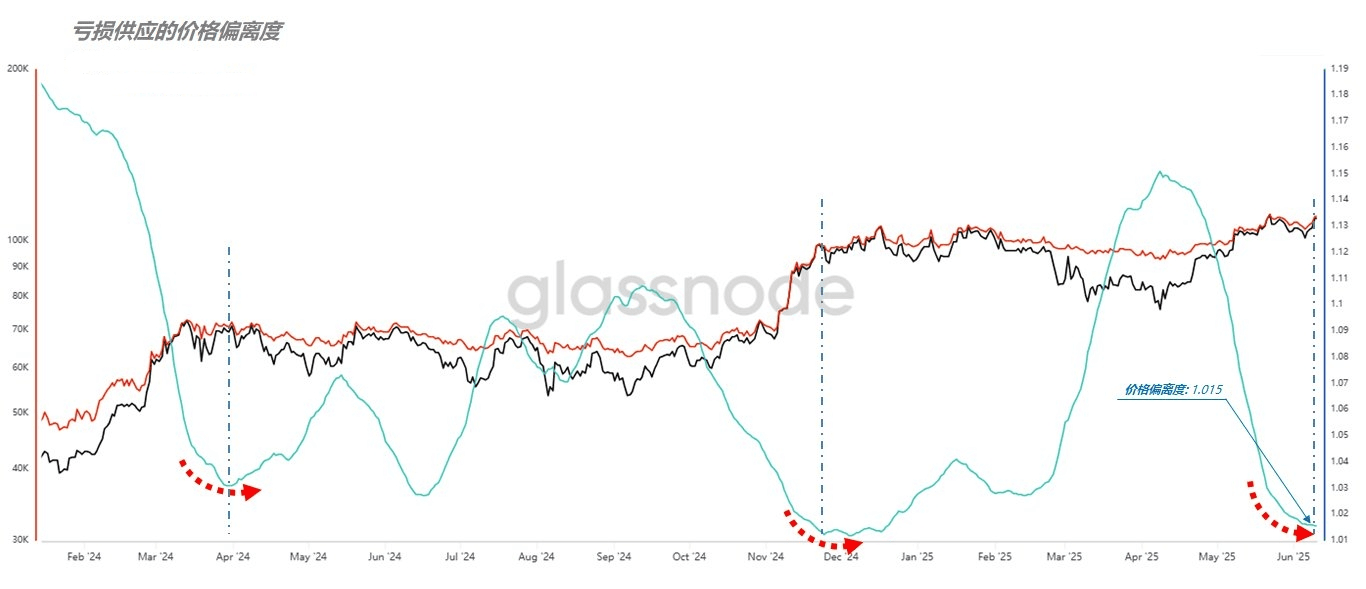
Conversely, if the deviation significantly rises (the green line in the chart is elevated), it indicates that the market may enter an adjustment period in the short term. This indicator thus becomes an important signal for determining market strength.
More noteworthy is the turning moment when the deviation curve shifts from a continuous decline to a 'turning point' (as indicated by the red dashed line in the chart). This change suggests that Bitcoin has transitioned from a strong upward attack to a sideways consolidation phase. Once the curve rises again and the price gap starts to widen, it indicates that potential selling pressure is increasing, and the market enters an observation period.
From the latest data, the current deviation is 1.015. Coincidentally, this value also appeared on November 21, 2024, when the price of Bitcoin was about $99,000, and then it surged by around $10,000 before truly peaking. Of course, history does not always repeat itself, but this provides some temporal mapping reference for the current judgment.
Combining the multi-level structure of 'price and capital flow gradients', this deviation indicator's 'turning point' may be brewing a new market pattern adjustment.#比特币走势分析
