According to the latest on-chain data analysis, the trend of the profit and loss ratio of long-term holders (LTH) is releasing important signals, and the market may be gradually entering a phase-top range.
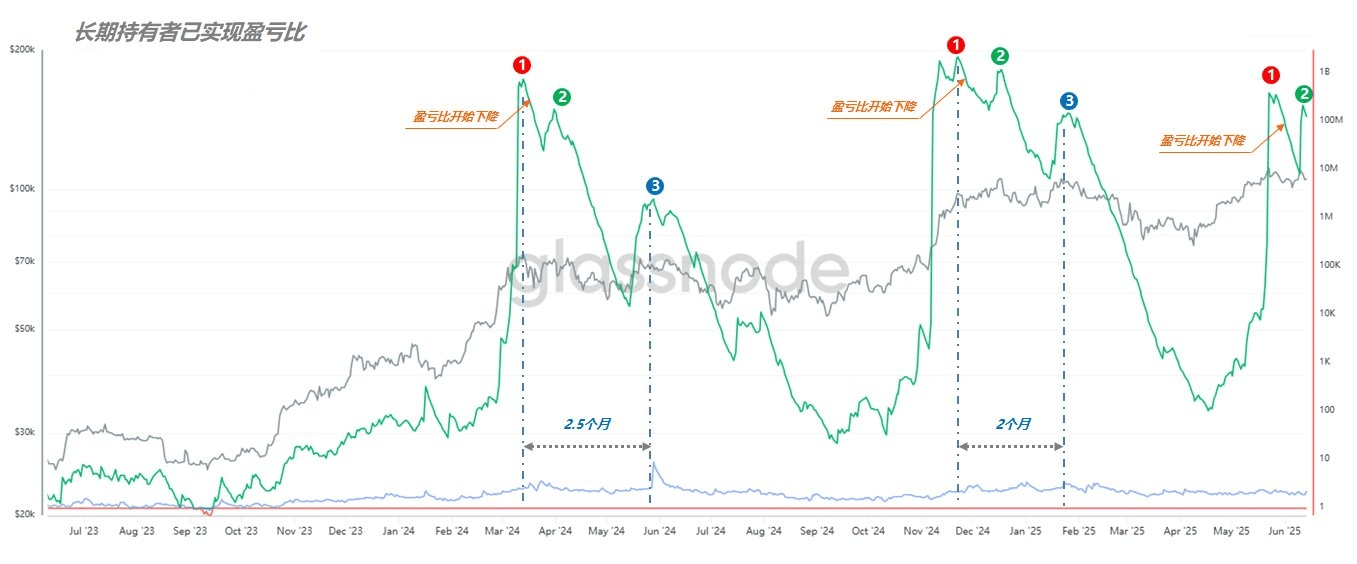
As early as June 2, the LTH profit and loss ratio (green curve) began to show signs of turning downward; as of yesterday, this trend has become increasingly evident. Observing the chart, from June 9 to June 11, the green curve briefly rebounded, indicating that new funds entered the market during this period, supporting LTH in realizing some profits at high levels. However, this rebound's peak (peak 2, green) failed to surpass the earlier peak on May 22 (peak 1, red), indicating that the downward trend in the profit and loss ratio has been preliminarily established.
Looking back at history, similar situations occurred in March and December 2024: prices approached or even reached new highs, but the LTH profit and loss ratio failed to move upward in sync, and the green curve turned downward. This indicates that while market sentiment remains high, the profitability of long-term holders is weakening, and a top region may be brewing.
If we extrapolate based on historical patterns, the green curve often rebounds again during a downward trend, forming the so-called peak 3 (blue). The two previous cycles from peak 1 to peak 3 lasted about 2 months; based on this calculation, the current peak 1 appeared on May 22, and the next rebound may occur in mid to late July, with prices potentially approaching earlier highs.
It is important to emphasize that historical patterns are not absolute, and market trends are influenced by multiple factors. However, based on current data, at least the following two trends are relatively clear:
✅ First, the profit and loss ratio of long-term holders has currently confirmed a downward trajectory. Even if a rebound occurs, it has not surpassed the previous high.
✅ Second, such a downward trend often indicates that the market is constructing a phase-top structure, a process that is relatively slow and may last several weeks or even months.
In the future, when peak 3 appears, we will continue to update the data to verify whether the market unfolds as expected. Please stay tuned!#比特币
