In recent Bitcoin market trends, a change worthy of attention is gradually emerging: although the price remains oscillating at a high level, the momentum is showing a slow weakening trend.
The first effective signal we are focusing on comes from the profit realization behavior pattern of players. From the trend shown in Figure 1, significant signs of momentum slowdown appeared in the market as early as June 2. At that time, although the price remained strong, the selling pressure triggered by players taking profits showed a significant reduction compared to the previous occurrence (marked 2 in Figure 1), which directly put considerable pressure on the price.
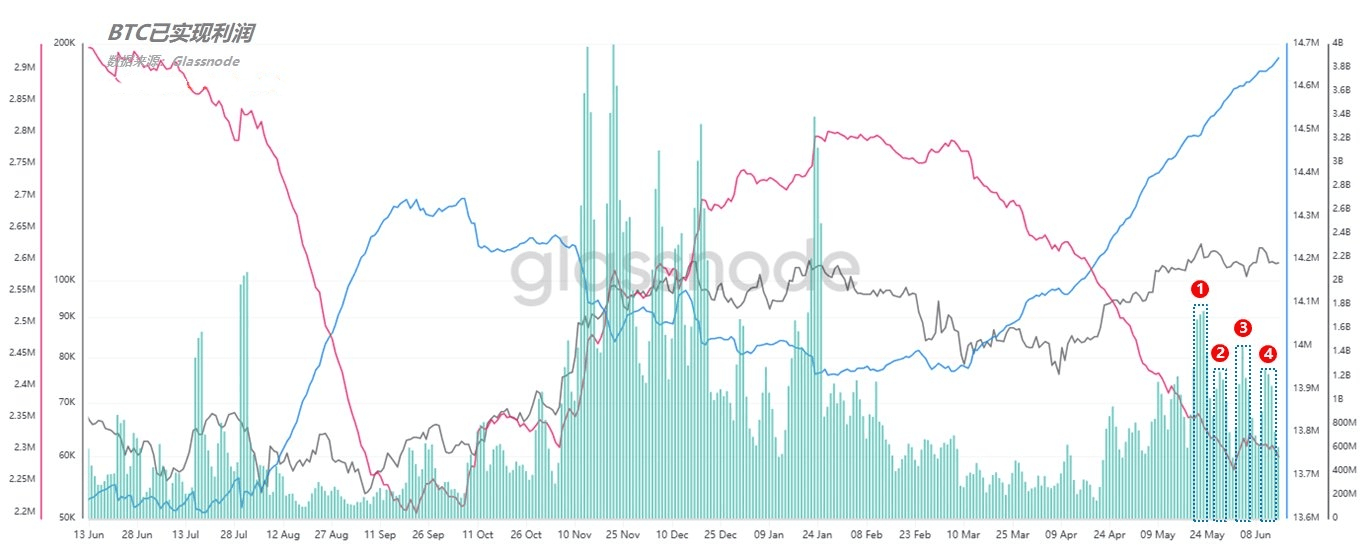
(Figure 1)
However, after the 'mutual tearing incident' between Trump and Musk on June 5, the market suddenly experienced a third round of more intense profit realization (marked 3 in Figure 1), and although the Bitcoin price was short-term hindered, it found support around $100,000, showing that the market’s承接力 remains strong.
Additionally, this round of profit realization, although not exceeding the previous high, is significantly higher than the previous wave (marked 2 in Figure 1), indicating that the momentum decay has temporarily stopped, triggering a subsequent rebound trend, with the price almost challenging historical highs again. On June 11, the fourth round of profit realization occurred again (marked 4 in Figure 1), becoming a key point for judging the market momentum direction.
After comparison, it can be found that the scale of this round of profit realization is far lower than the first (marked 1 in Figure 1) and the peak on June 5 (marked 3 in Figure 1). Therefore, we conclude that although the upward momentum of Bitcoin has not experienced a sharp decline, it has entered a relatively mild weakening phase, which is difficult to detect with the naked eye but is clearly reflected in the data.
The second observation angle comes from the changes in market 'new demand'. As seen in Figure 2, new demand (blue waveform) is highly correlated with price (black curve). During the early phase of the market launch in early April, demand saw a significant surge (marked 1 in Figure 2), directly pushing BTC from $76,000 to $96,000.
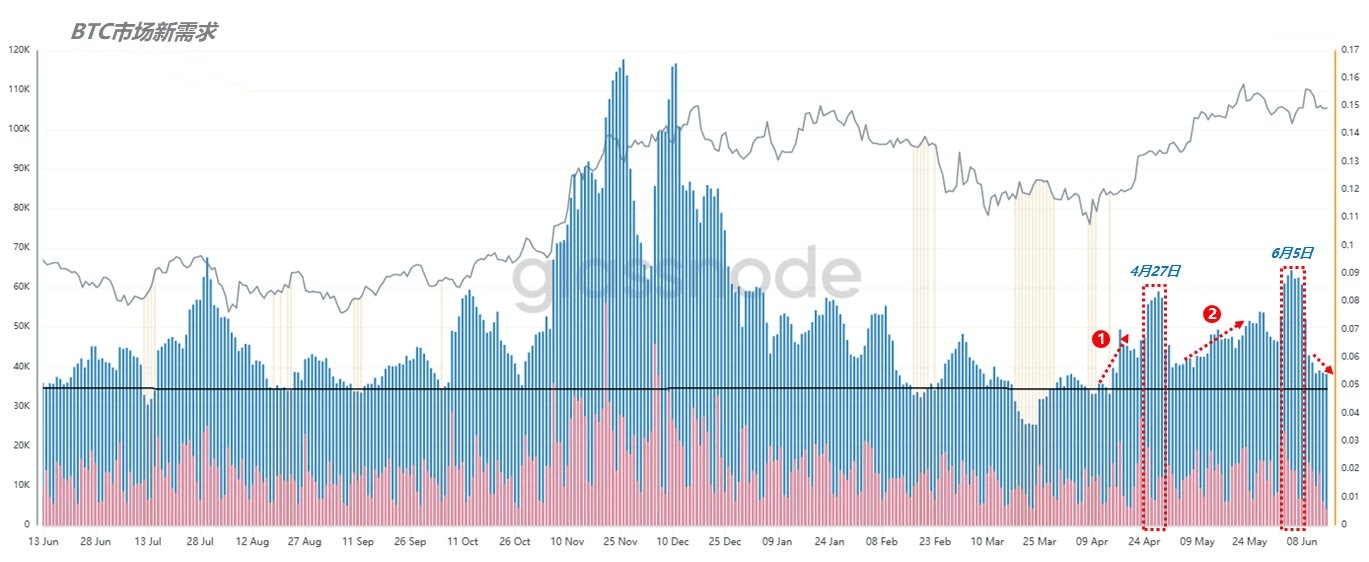
(Figure 2)
Despite the slowdown in subsequent demand, new funds have re-entered the market under the encouragement of Trump’s remarks and macro positive factors (marked 2 in Figure 2), ultimately pushing Bitcoin to peak at $110,000. However, on June 5, while a large amount of profit was realized, we also observed another thing: new demand surged simultaneously, becoming a key driving factor for the rapid price recovery.
However, the current situation is somewhat different. Although the price has rebounded, new demand in the market continues to weaken, even falling below the level seen in early May. This corroborates the observed phenomenon of 'momentum decline' through profit realization mentioned earlier.
Overall, Bitcoin still has some support, but the core driving force behind the price increase is fading.