#DOGE / #USD. Here is my analytical conclusion regarding a possible scenario of events:

 Overall technical context:
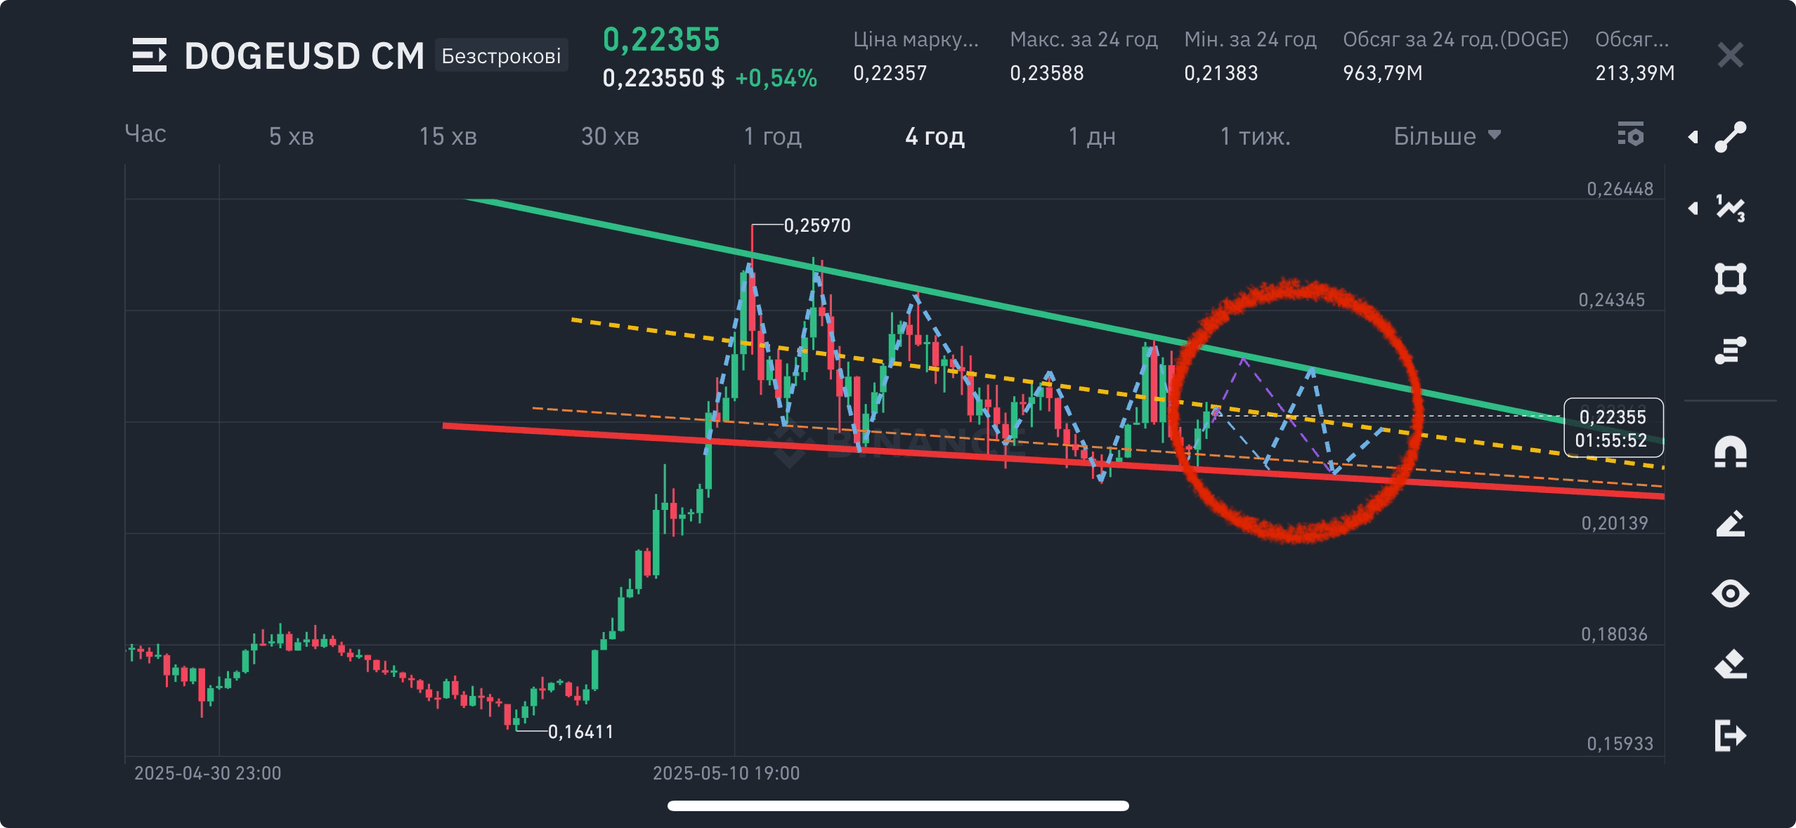
1. Global trend - descending channel.
2. The price is currently about in the middle of this channel, closer to the upper boundary.
3. The yellow dotted line is local resistance, which acts as a kind of internal boundary.
4. There is a red support zone that has already been tested several times.
⸻
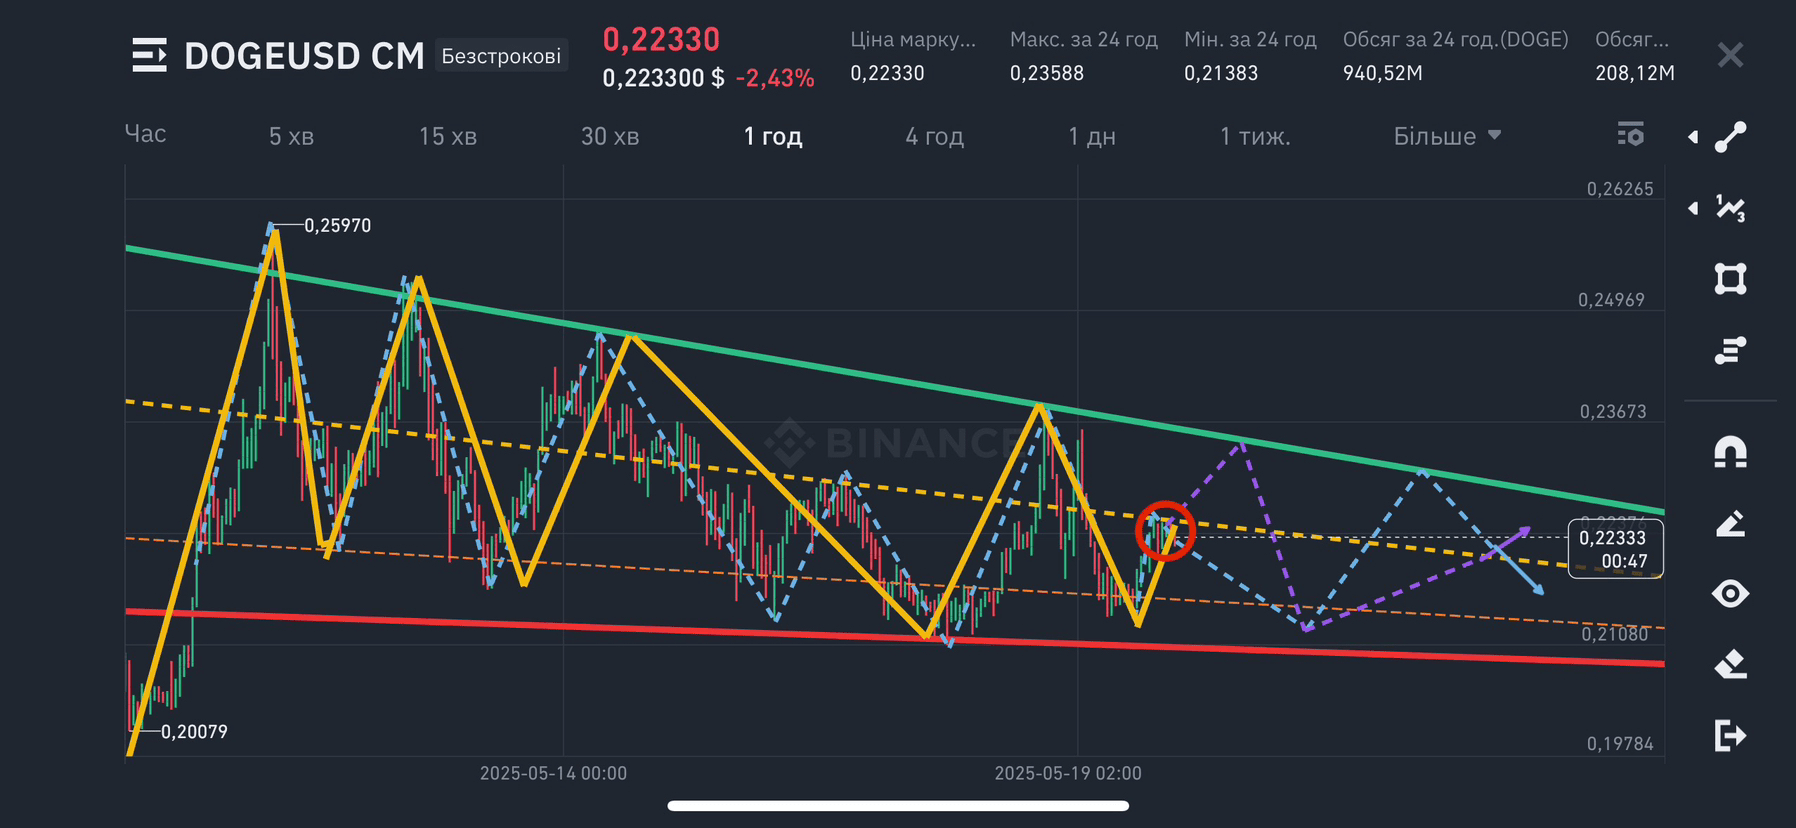
Purple dashed line (growth scenario):
• It suggests a continuation of the upward movement, testing the upper boundary of the channel (green line), with the potential for a breakout.
⸻
Blue line (flat/decrease scenario):
• This scenario shows that the price will 'wander' within the internal wedge, returning to the lower red support.⸻
Possible scenarios:
• A breakout upwards with a fixation above 0.228–0.230 opens the way to 0.237, and further to 0.246–0.250.
• A downward breakout and consolidation below 0.210 will lead to a test of 0.200 or even 0.193.
Ideas for action:
1. Stop-loss is preferably hidden below 0.208 if you buy in the support zone.
2. If the price consolidates above the green trend line (around 0.230–0.232) – this is a signal to open long positions.
3. Futures idea: short position from the upper boundary of the channel with tight SL or long on a breakout with confirmation.
