 1. Key Points and Technical Signals for Bitcoin (BTC)
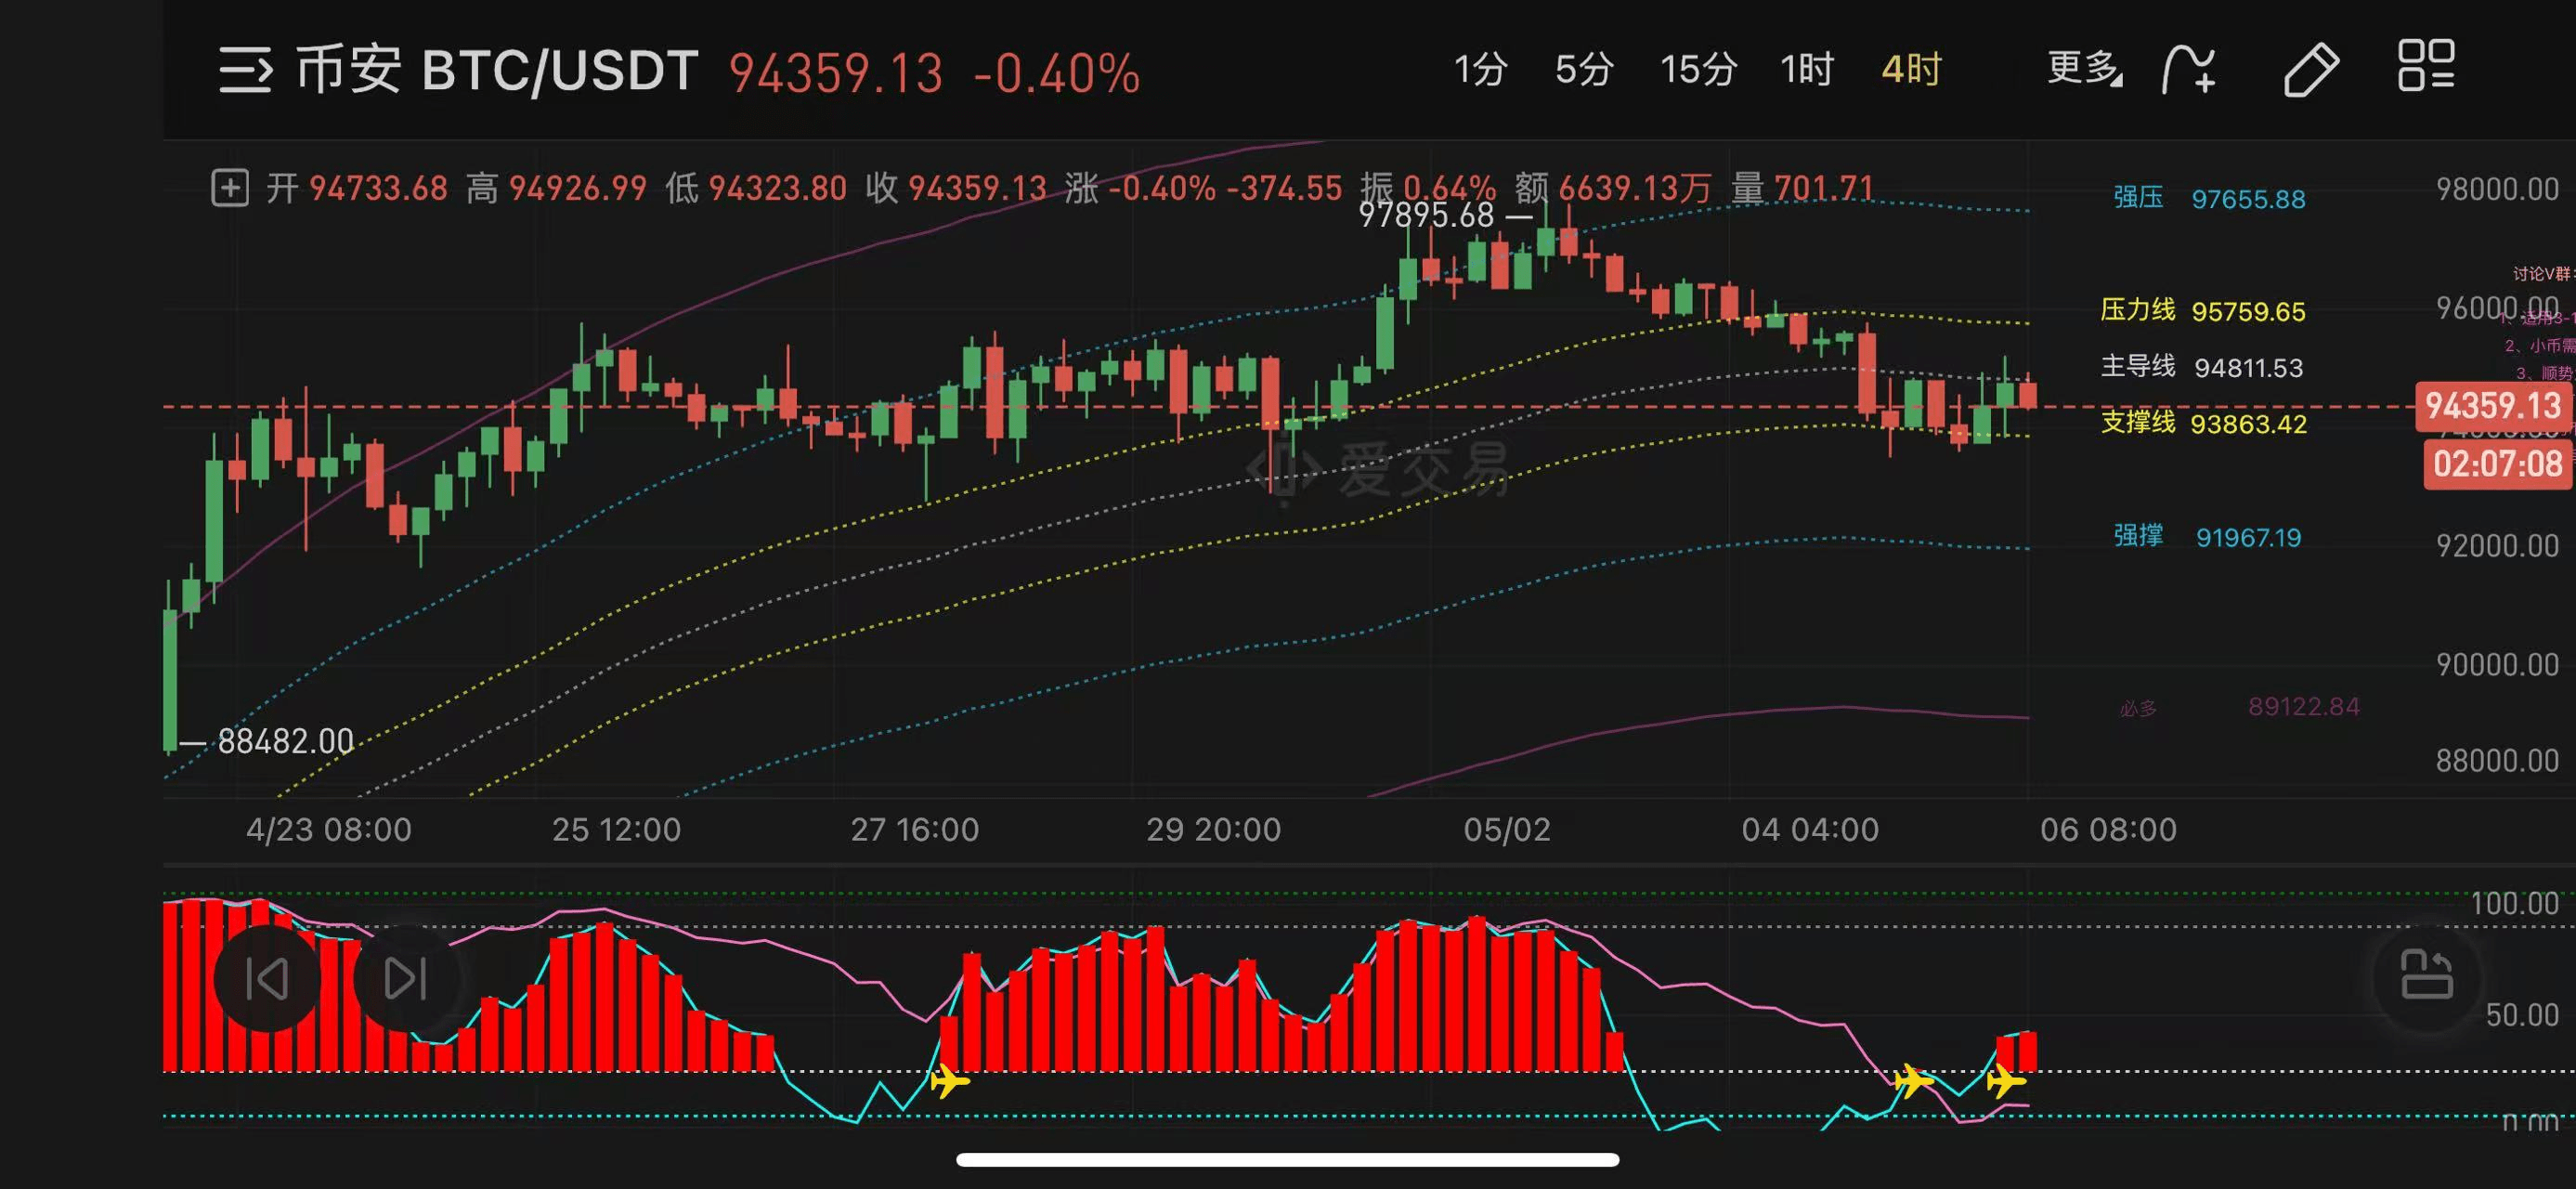
1. Daily Level Analysis
◦ Support Verification: The current price has fallen below the daily EMA5 moving average of $94,500, but there is a double bottom support structure around $93,500; if stabilized, it may trigger a rebound.
◦ Resistance Pressure: Short-term resistance is around $95,500; a breakthrough needs to be accompanied by an increase in trading volume (hourly buying ≥ 5,000 BTC), otherwise, it may form a false breakout.
◦ Potential Risk: If $93,500 is lost, it may accelerate the pullback to $92,000 (daily MA20 support) or even $88,000 (weekly support).
2. 4-Hour Level Signals
◦ MACD Indicator: After a death cross below the zero line, bearish momentum is dominant, but the downward momentum has weakened.
◦ Volume-Price Relationship: During price consolidation, trading volume shrinks, and one should be wary of false breakout risks.
◦ Pattern Observation: Currently in a descending triangle consolidation, a breakout above the upper boundary (about $95,500) or below the lower boundary ($93,500) will determine the short-term direction.
2. Ethereum (ETH) Trends and Key Areas
1. Daily Level Trend
◦ Downward Trend Continues: ETH is still in a daily downward channel; a rebound needs to break the $1,870 resistance level to confirm a reversal.
◦ Support Area: $1,700-$1,730 is a key support zone; if it breaks, it may test $1,680 (strong weekly support) or even $1,500.
◦ Volume Verification: Recent trading volume is sluggish; a rebound needs to be accompanied by increased spot buying (hourly ≥ 100,000 ETH).
2. 4-Hour Level Signals
◦ MACD Indicator: In the negative value area, bears dominate, but RSI is close to the oversold area (45), indicating a possible short-term rebound.
◦ Correlation Risk: The ETH/BTC exchange rate needs to stay above 0.019; otherwise, it may follow BTC for further pullbacks.
3. Operational Strategies and Risk Control Suggestions
Bitcoin (BTC)
1. Bullish Opportunities:
◦ Light Long Position: If the price stabilizes around $93,500 (such as a long lower shadow on the 4-hour chart), target $94,500-$95,000, stop loss below $93,000.
◦ Breakout Long: After stabilizing at $95,500, pursue long positions, target $96,000-$97,000, stop loss at $94,800.
2. Bearish Opportunities:
◦ Shorting Pressure Level: If the price reaches $95,500 and RSI is overbought (>70), open a light short position, target $93,500-$92,000, stop loss at $96,000.
◦ Breakout Short: If it loses $93,500, reverse to short, target $92,000-$88,000, stop loss at $94,000.
Ethereum (ETH)
1. Bullish Opportunities:
◦ Support Zone Long: If the price stabilizes around $1,700-$1,730, target $1,780-$1,800, stop loss below $1,680.
◦ Breakout Long: After stabilizing at $1,840, pursue long positions, target $1,870-$1,900, stop loss at $1,820.
2. Bearish Opportunities:
◦ Shorting Pressure Level: If the price rebounds to $1,840-$1,870 and shows signs of stagnation (such as a long upper shadow), open a light short position, target $1,780-$1,730, stop loss at $1,880.
4. Risk Warning
1. Policy Disturbances: Pay attention to changes in the Federal Reserve's interest rate cut expectations in June (current probability 65%) and the progress of Bitcoin reserve legislation in Arizona.
2. On-Chain Movements: Daily outflow from miner addresses increased to 1,200 BTC; if selling continues, it will suppress rebounds.
3. ETF Fund Flows: BlackRock's IBIT ETF needs to maintain a daily net inflow of over $200 million; if it falls below $100 million for consecutive days, it may trigger selling.
4. Liquidity Risk: Insufficient market liquidity during weekends may amplify volatility; it is advisable to reduce leverage to below 3 times.
Summary and Future Market Outlook
• BTC Short-Term: Range-bound between $93,500-$95,500; if it breaks below $93,500, it turns bearish; a breakthrough above $95,500 could target $97,000.
• ETH Short-Term: Range-bound between $1,700-$1,870; breaking below $1,700 may accelerate the pullback, while breaking above $1,870 will relieve selling pressure.
• Medium-Term Trend: BTC weekly still maintains an upward channel; after stabilizing at $95,000, the target points to $100,000; ETH needs to stabilize above $1,800 to reverse the downtrend.
Strict stop-loss measures are required to avoid excessive leverage, and pay attention to liquidity fluctuation risks during US stock market opening hours (20:30-22:00).