Daily sharing
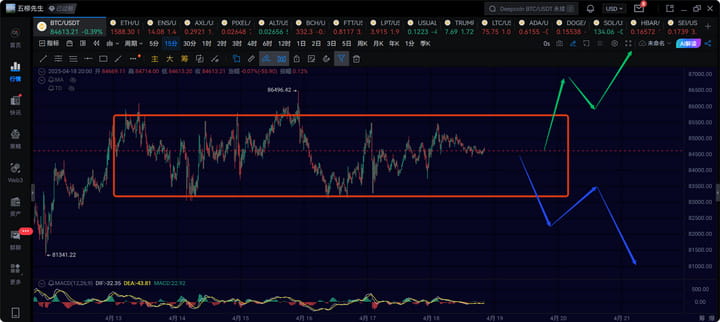
Bitcoin has maintained oscillation within the range of 83000 to 86000 for about 5 days. During this period, although there were two breakouts above 86000, they were quickly suppressed. The continuous range oscillation has left short-term traders a bit confused, as Bitcoin has not chosen to break upward nor has it directly fallen below 83000. As the oscillation amplitude gradually shrinks, a short-term trend change is about to occur.
Firstly, what we can confirm is that Bitcoin is still within the range of a 4-hour level rebound, which has not yet completed. Therefore, after the short-term trend change, there are essentially two scenarios.
The first scenario is an upward trend change, where the expected pullback does not occur, and it directly breaks through 86000. In this case, it will continue to rise to complete a 4-hour level rebound. However, if it goes directly upward, the short-term movement is unlikely to be too high, perhaps only reaching above 87500 or 88000, and then it will trigger another 4-hour level decline to retest below 80000.
The second scenario is a downward trend change, where the current oscillation is intentionally showing strong signs and then suddenly turns downward, directly pulling back to around 80000. After the pullback, it quickly rebounds to 90000 or a little higher. This situation actually belongs to a washout method within the 4-hour level rebound.
Next, it depends on which way the short-term market will go. At this time, it is actually better to observe more.
BTC medium to long term
Weekly:
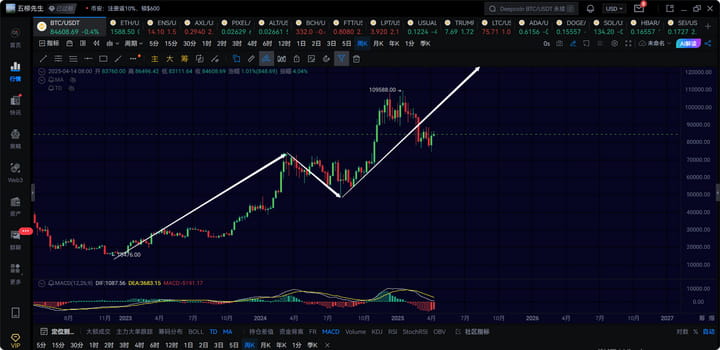
Weekly level: Currently leaning towards this being the third wave of a weekly level rise, since Bitcoin has not yet broken below 74000, the overall weekly upward trend remains healthy. The starting point for the weekly rebound is around 49000, with an expected target range of 150000 to 200000.
Although the sharp drop in the first quarter led many people to completely lose confidence in the future, believing that Bitcoin has started to bear or that the bear market has arrived, many even predict that by the end of 2025, Bitcoin will again fall below 50000 to the 40000 range.
However, the current bullish trend structure of Bitcoin has not been severely damaged, so we can still maintain a certain degree of confidence that the bull market is still ongoing. Personally, I am more inclined to believe that Bitcoin is about to enter a long and slow bull phase. This round of the cryptocurrency market has actually broken the pattern of a 4-year bull-bear cycle. Bulls are not like bulls (referring to the current bull market being completely different from the bull markets of the past 4 to 8 years), and bears are not like bears.
For Bitcoin, it has entered a long-term slow bull market era. The main feature of this era is that prices will continuously reach new highs, but there is no longer the capability for sustained explosive growth. Often it is a series of rises and pauses, with the time period of one-sided upward trends continually shrinking. In the past bull market era, a rise could last for half a year or a year, with short pullback times and longer upward times. The slow bull era sees short upward times and increasingly prolonged pullback, fluctuation, and washout periods. This aligns with the market situation after the regular army enters.
For Ethereum, mainstream, and altcoins, the bull-bear cycle is gradually becoming chaotic, remaining in a short bull and long bear phase. However, this does not mean that there will be no bull market for altcoins and mainstream coins during the years 2025, 2026, and 2027. There will almost always be a wave of bull market every year, but after the bull market ends for altcoins and mainstream coins, they revert to a downward trend of continuous losses. Only a few coins will see continuous price increases in between.
Therefore, when the next wave of altcoin market appears, everyone will have to change strategies, as holding long-term seems no longer feasible. Since the altcoin market has already declined significantly, there should be a rebound in the next few months, followed by another decline. It is expected that by the end of the year, there may be a small bull market for altcoins.
Daily level:
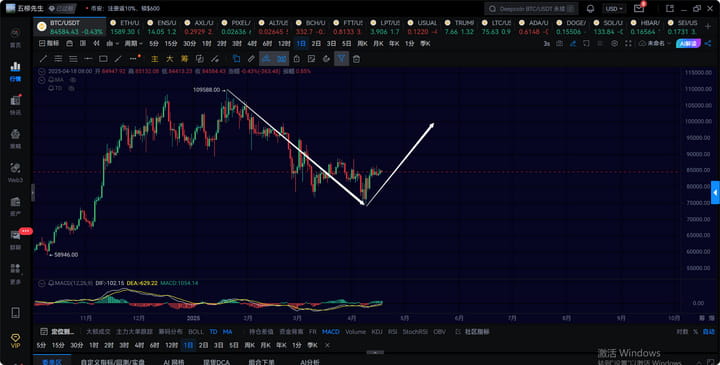
Daily level, it is currently uncertain whether 74508 is the lowest point of the first half of the year's daily pullback. Personally, I believe there is a strong suspicion that 74508 is a bottom. However, the key is that we still need to observe whether the next 4-hour level pullback will produce a second buy signal. Only if the next 4-hour level decline does not create a new low can we fully confirm the start of a daily level rebound.
Before this, we can first assume that 74508 is the bottom, and then make our own trading and risk management based on this assumption. If it has already formed a daily level rebound, the goal of the daily level rebound would be to reach around 100000. As for whether it will continue to push for a new historical high after reaching 100000 or pull back to retest 75000, that is something to consider later. For now, we only consider the market during the rebound phase.
4H:
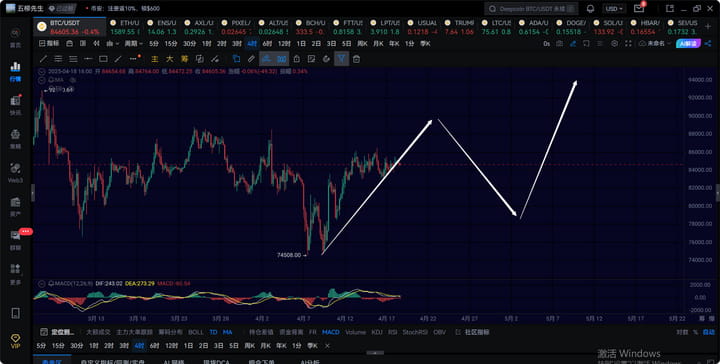
At the 4-hour level, it can be confirmed that the current 4-hour level rebound has not ended. However, it is uncertain whether the short term will see a direct upward push or a pullback before another upward move. If it directly completes the 4-hour level rebound, then it might only see the range of 87500 to 90000 before it has to start a 4-hour level decline.
If there is a pullback first followed by an upward surge, then a 4-hour level rebound could see targets around 90000 or even 92000. After that, there would be another 4-hour level pullback.
For the next 4-hour pullback, if it follows the former's trajectory, we can see around 79000 or 78000. If it follows the latter, we expect to see around 80000 or 81000. The smaller probability is that the next 4-hour pullback will create a new low.
BTC short-term
Due to the rapid changes in the market, this article can only make predictions based on the market changes at the moment of publication. Short-term traders should pay attention to the latest market changes, and this should only be taken as reference.
1H:
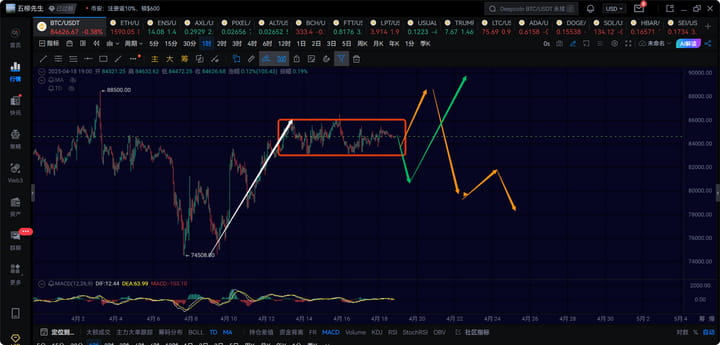
At the 1-hour level, after 5 days of continuous oscillation, it is almost ready to upgrade to a 1-hour level central zone, and the short-term is about to change trend. From the current trend, the probability of a short-term upward movement is increasing. If it breaks through 85500 again, Bitcoin will continue to rise in a 1-hour level breakout segment, with an expected target around 87500 to 89000. After that, there will be a 4-hour level decline, targeting around 78000, as indicated by the yellow arrow in the above figure.
If Bitcoin cannot break above 85500 in the short term and instead continues to fall below 83000, it will pull back to around 81000 again, experiencing a false breakdown before continuing to rise, as indicated by the green arrow in the above figure, to continue the 4-hour level rebound, with targets of 90000 or 92000, before starting a 4-hour pullback.
15M:
At the 15-minute level, there has been repeated oscillation within this range, which can actually upgrade to a 1-hour level central zone. During central zone oscillations, the direction is not very clear. Here, it can break upward past 85500, starting a 1-hour level rebound as indicated by the green arrow in the above figure. Alternatively, it could drop again below 83000, leading to a 1-hour level pullback. It depends on whether a direction emerges tonight. If it continues to stay above 84100, the probability of the first scenario is higher. If it breaks below 84100, the probability of a downward pullback increases.
ETH
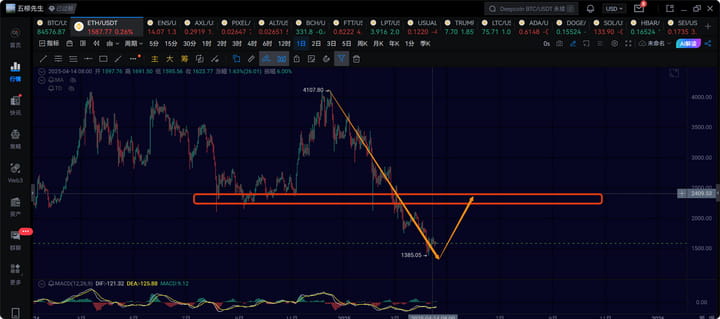
Ethereum's daily level rebound in May currently has a relatively high probability of reaching around 2300 to 2400. If 1385 is the lowest point, then from 1385 to 2400, the rebound amplitude reaches 73%, which is quite attractive. However, how much further it can drop remains to be seen, as the support around 1200 is still very strong. Therefore, Ethereum has entered an era of high risk-reward ratios in the medium to short term.
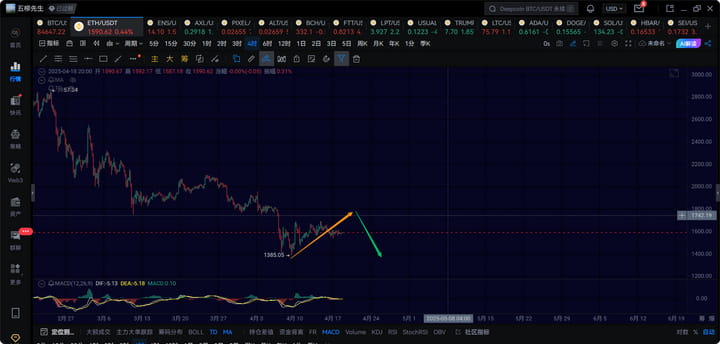
At the 4-hour level, Ethereum is undergoing a 4-hour level pullback, with resistance for the rebound at around 1750 and 1800. After rebounding, it is expected that there will be another 4-hour level pullback. It is currently uncertain whether the next 4-hour pullback will break below 1385, as Ethereum's randomness is a bit higher.
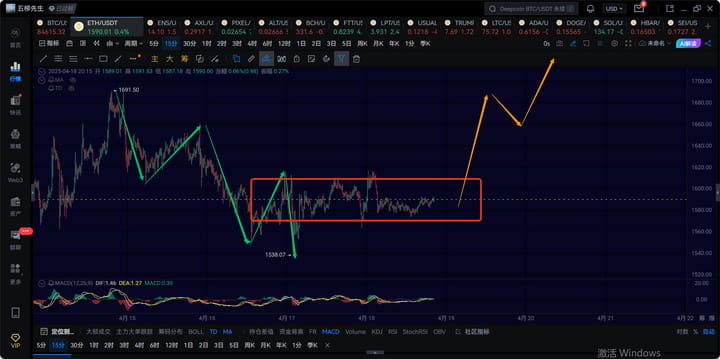
At the 15-minute level, Ethereum has consolidated into a 15-minute level central zone, and the short-term direction is not very clear, entering a short-term trend change node. If it breaks upward again past 1615, then it may rise in a 1-hour level rebound to around 1750. If it falls below 1560, it is considered to continue to decline in a 1-hour level extension to around 1480.
Trend direction
Weekly level: The direction is upward, currently moving towards a new weekly level increase, with an overall target above 150000.
Daily level: The direction is downward, at the end of the daily level decline, but currently it is still uncertain when the daily pullback will end. We need to observe the situation of the next 4-hour pullback.
At the 4-hour level: The direction is upward, and it is currently very likely to be within the range of a 4-hour level rebound, with a target around 90000.
1-hour level: The direction is upward or downward. If it breaks through 85500 again, it is considered that it will continue to push upward, with a target above 88000.
15-minute level: Oscillating, looking at key positions upward or downward. If it falls below 84000, the probability of continuing to drop below 83000 increases, while breaking above 85500 increases the probability of an upward trend change.


