Short-term trend assessment: Neutral to bearish, but approaching the oversold rebound threshold.
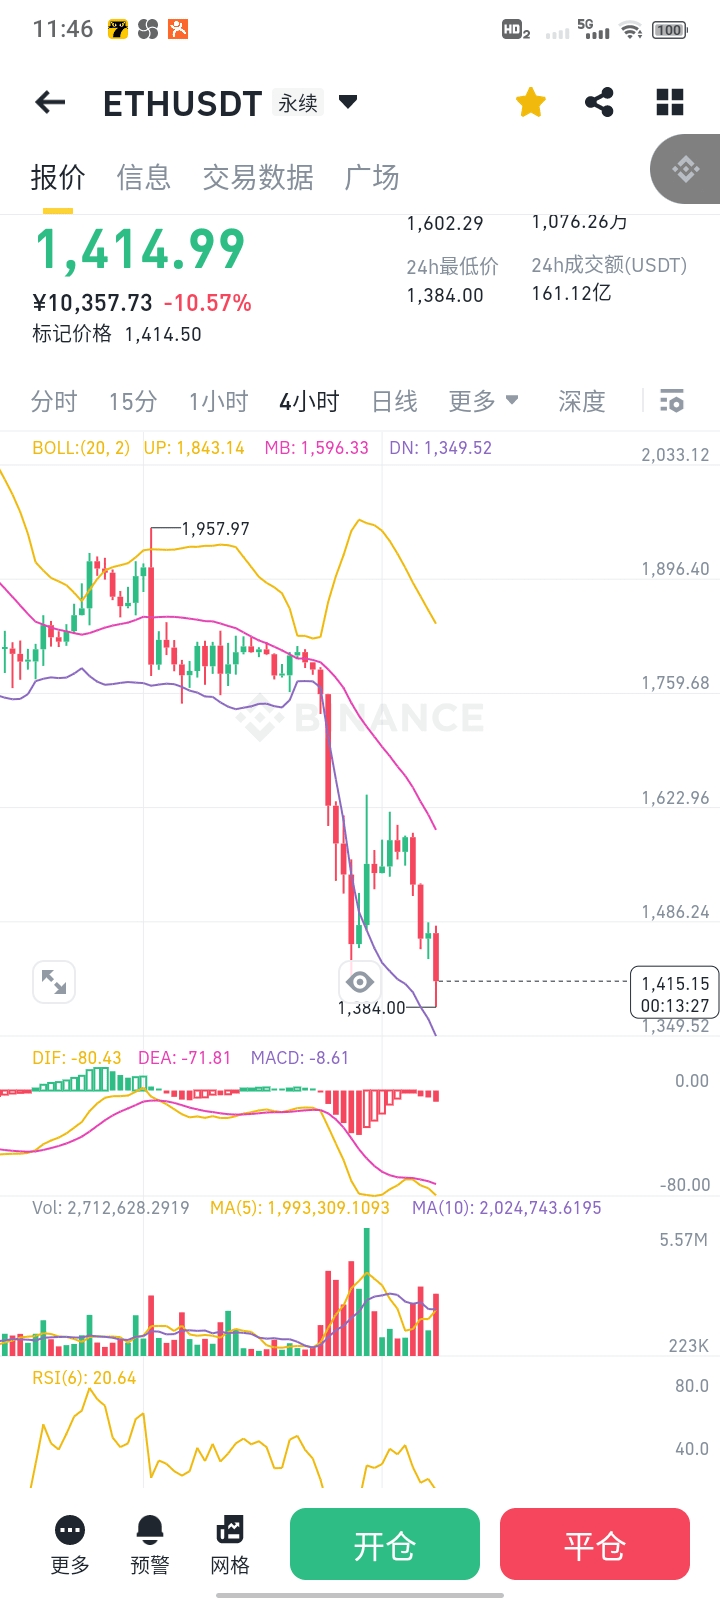
The current price is in a downward channel, but RSI(6) has dropped to 20.64 (oversold zone), with BOLL lower band support around 1,349.52, caution is needed for oversold rebound.
Operation Suggestion:
1️⃣ Bullish Signal (Cautious):
Entry Point: If the price effectively stays above the BOLL lower band at 1,349.52 and the following signals appear:
MACD Golden Cross (DIF crosses above DEA)
RSI(6) rebounds above 30
1-hour candlestick forms a long lower shadow or bullish engulfing pattern
Target: Rebound to the BOLL middle track around 1,596.33
Stop Loss: Stop loss if it breaks below 1,349.52 (to prevent lower band failure).
2️⃣ Bearish Signal (Trend Following):
Entry Point: If the price breaks below the BOLL lower band at 1,349.52 and rebounds weakly, with MACD continuing to diverge downwards.
Target: Next support range 1,200-1,250 (historical key levels)
Stop Loss: Price needs to stay above 1,360.
Key Indicator Analysis:
BOLL lower band (1,349.52): Current key support, breaking below may accelerate the decline.
MACD (-8.61): Green bars are shortening but no golden cross, downward momentum is weakening but has not reversed.
RSI(6)=20.64: Severely oversold, but need to wait for a confirmation of upward turn for rebound.
Summary:
Mainly wait and see in the short term, waiting for the following signals:
Aggressive (Left-side Trading): Light position near 1,349.52 to try going long, strict stop loss.
Conservative (Right-side Trading): Follow up after breaking 1,450 (short-term resistance) or MACD golden cross.
Bearish: Short below 1,349 after a breakdown, but be wary of oversold rebound risks.
⚠️ Risk Warning: The current market is highly volatile; strict position control and stop-loss measures are required to avoid blind bottom-fishing.