Trend judgment:
Bearish trend dominant:
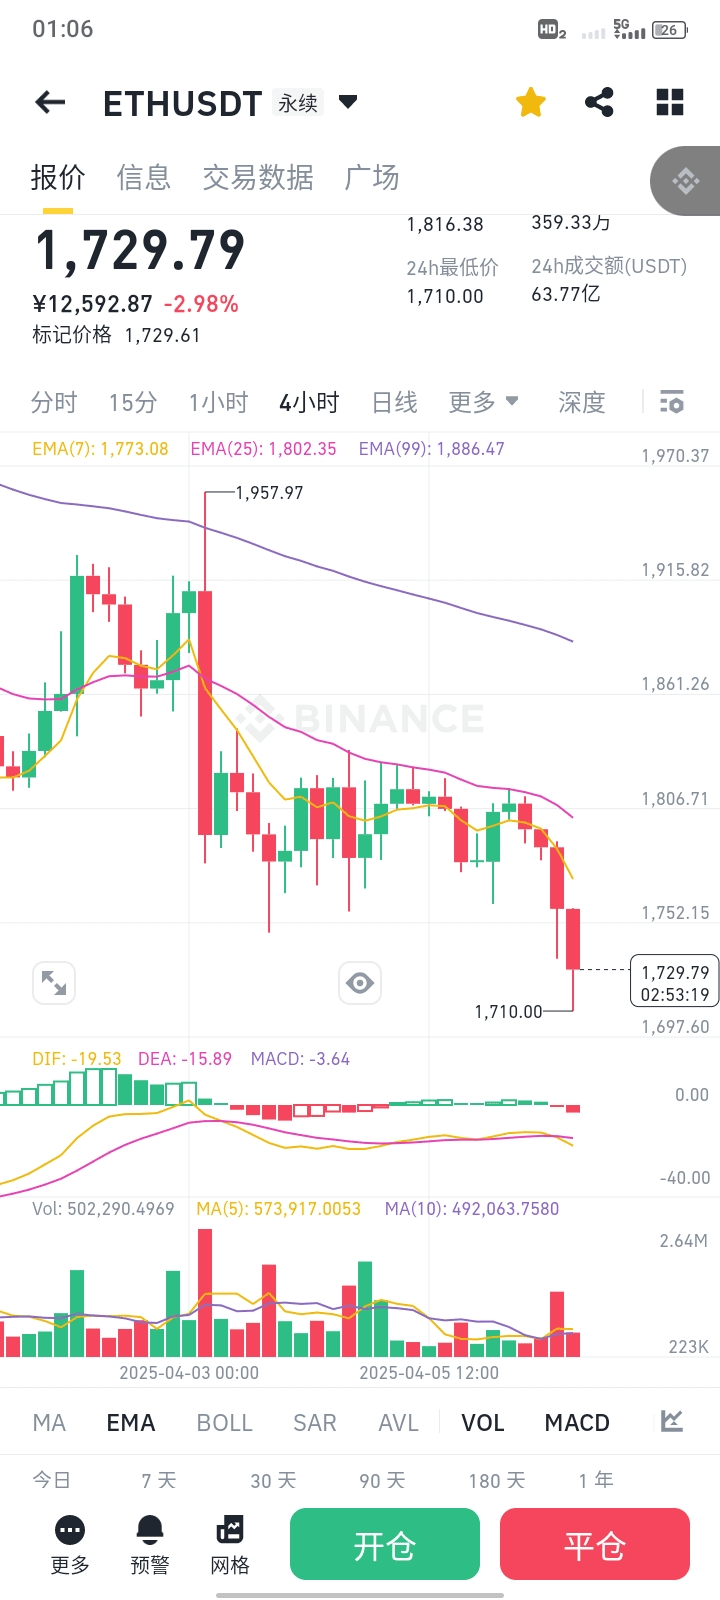
The current price (1,729.79) is significantly below EMA(7)/EMA(25)/EMA(99) (1,773~1,886), and the three EMAs are in a bearish arrangement (short-term moving average below), indicating a bearish bias in the medium to long term.
In the MACD indicator, both DIF and DEA are negative and diverging downwards. The MACD histogram (-3.64) shows that the downward momentum is still continuing.
Short-term risk:
The price is close to the 24-hour low support level (1,710). If it breaks below, it may accelerate the decline to 1,697 (lower support marked on the chart).
If the price rebounds, watch for resistance near EMA(7) (1,773). If it does not effectively break through, the downward trend remains unchanged.
Entry point suggestion:
Short strategy (trend-following):
Ideal entry point: Enter short if the price rebounds near EMA(7) (1,773) or after breaking below the 1,710 support.
Stop loss: Above EMA(7) at 1,780 or previous high of 1,730 (adjust flexibly based on position).
Target: First target 1,697, second target below the long-term EMA(99) (1,600 area).
Long strategy (counter-trend, proceed with caution):
Aggressive condition: If the price stabilizes above the 1,710 support and MACD shows a golden cross (DIF crosses above DEA), one can attempt a small long position.
Stop loss: Below 1,700.
Target: Short-term rebound to 1,750~1,770.
Key indicator monitoring:
Support level: 1,710 (24-hour low) → 1,697 (marked on the chart)
Resistance level: EMA(7) (1,773) → EMA(25) (1,802)
Volume alignment: If the price drops with increased volume, the trend strengthens; if the rebound is low volume, short on rallies.
Summary:
Short-term bearish outlook, recommend focusing on shorting on rebounds, set strict stop losses, and monitor the effectiveness of the 1,710 support. If the market has unexpected positive news (such as ETH spot ETF approval), adjust the strategy flexibly.$ETH