One, market structure and technical signals
1. Volatility range and bull-bear game
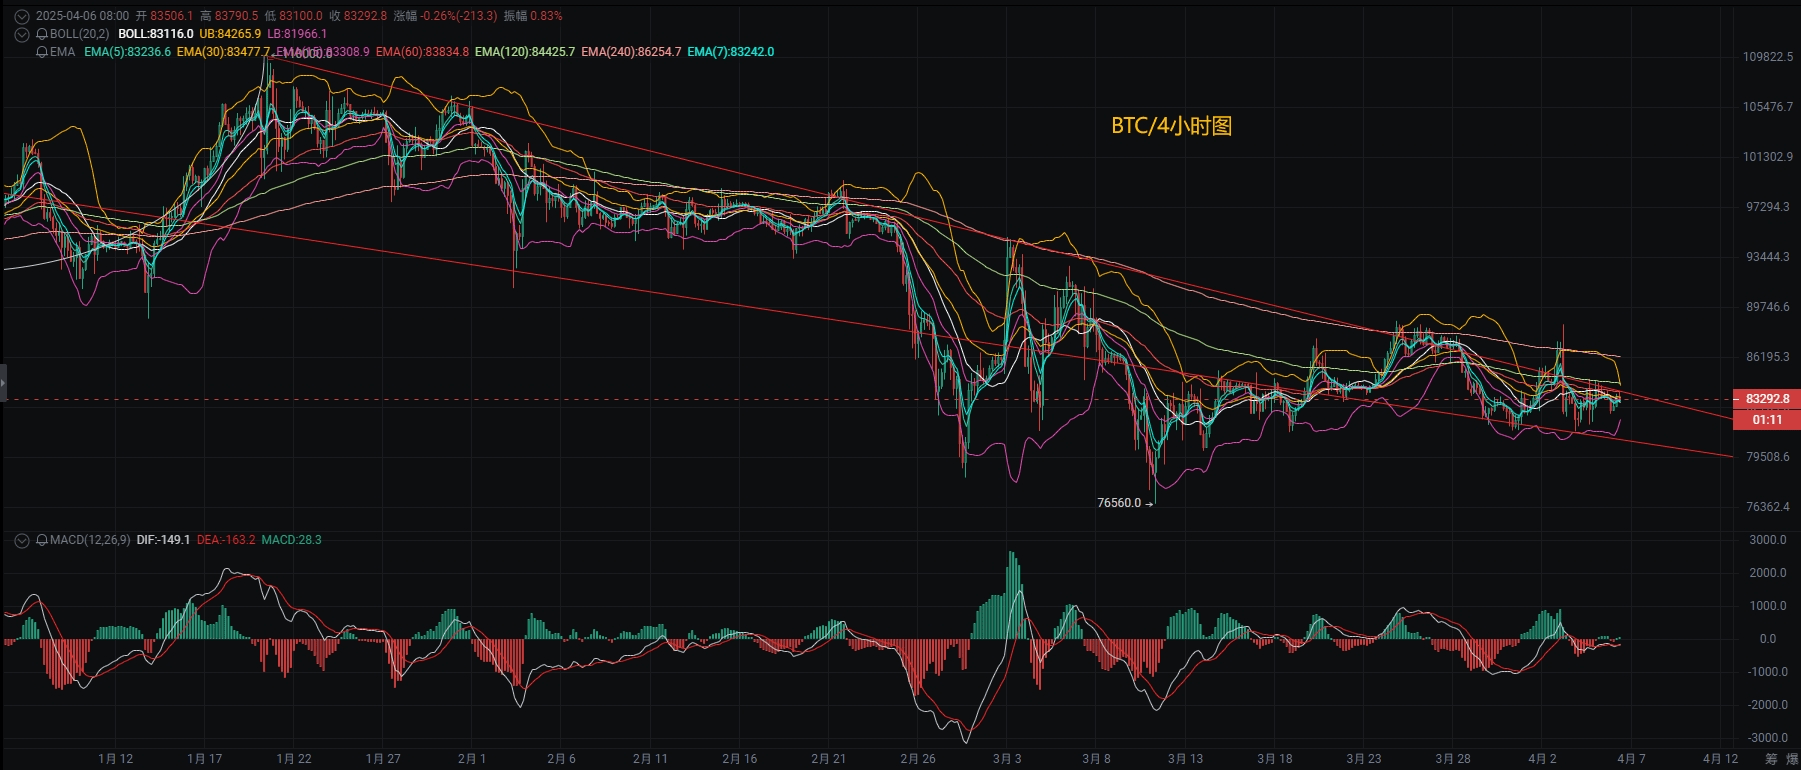
• Core volatility range: Bitcoin is currently oscillating around $81,500-$84,500, with the 4-hour level testing the upper resistance zone of $84,300-$84,500 multiple times without success, while the lower support zone of $81,200-$81,500 has not been effectively broken, forming a balanced pattern of 'pressure above, support below'.
• K-line pattern: The 4-hour chart continuously shows long shadows, indicating fierce bull-bear competition; the 1-hour level has formed a short-term consolidation platform around $83,300, but the rebound highs are gradually decreasing ($84,422→$83,800→$83,500), indicating continued weakening of bullish momentum.
2. Technical indicator signals
• MACD: The DIF and DEA lines at the 4-hour and 1-hour levels are close to merging, and the MACD histogram has narrowed to near the zero axis, indicating a lack of clear directional momentum in the market.
• Moving average system: EMA7 ($83,355) and EMA30 ($83,063) are merging and suppressing the price at the 4-hour level, EMA120 ($85,200) is still in a downward trend, forming long-term pressure.
• Trading volume verification: Recent trading volume is significantly below the 5-day average (MAVOL5), on April 6, Bitcoin's single-day trading volume was only 492.8, down 35% from the previous day, shrinking volatility indicates a risk of a trend change.
Two, key support and resistance levels
1. Bull-bear watershed
• Upper pressure:
◦ Short-term pressure: $83,800-$84,500 (4-hour EMA30 + previous high trapped area)
◦ Strong resistance: $85,000-$86,000 (daily Bollinger upper band + January downtrend line)
• Lower support:
◦ Short-term defense: $81,500-$82,000 (4-hour concentrated position area + psychological level)
◦ Key defense line: $80,000-$80,500 (CME futures gap + institutional cost support)
Three, trading strategy and risk control suggestions
1. High sell low buy in the range
• Short opportunities:
◦ Entry area: $83,500-$84,300 for gradual short position accumulation, stop-loss set above $84,500
◦ Target range: First target $82,200 (4-hour low), second target $81,500 (centralized position)
• Bullish defense:
◦ Long testing area: $81,200-$81,800 for light position layout, stop-loss at $80,500 (must exit if breaking key support)
◦ Rebound target: $83,000-$83,500 (EMA7 and EMA30 convergence resistance zone)
2. Breakout following strategy
• Upward breakout: If it stands firmly above $84,500 with volume, retrace to $83,800 to go long, target $85,000-$86,000 (must verify that trading volume increases to over $30 billion)
• Downward breakout: After breaking below $80,000, rebound to $81,000 for shorting, targeting $78,000-$75,000 (on-chain liquidation trigger zone)
3. Weekend special risk control
• Liquidity reduction period (Beijing time 22:00 to the next day 08:00) position control within normal levels of 50%
• Avoid holding one-way positions overnight with a deviation from EMA7 exceeding 1.5%
Four, risk warning
1. False breakout trap: Current shrinking volatility is likely to trigger a 'wick' market. If the price briefly breaks through support/resistance and quickly reverses, timely stop-loss is necessary.
2. On-chain liquidation threshold: If Bitcoin breaks below $80,000, it will trigger approximately 24,000 BTC of long liquidations, equivalent to 18% of the average daily trading volume.
3. Macroeconomic event disturbance: April 10 U.S. CPI data release (expected year-on-year 3.1%), exceeding expectations may trigger volatility spikes
Summary: Bitcoin is currently in a balanced oscillation convergence phase, with short-term operations primarily focusing on shorting at rebound highs and lightly trying longs at support, paying close attention to breakout signals from the $84,500 resistance and $81,500 support. Medium- to long-term investors may wait for the institutional cost zone below $78,000 to position, playing the liquidity recovery brought by a shift in Federal Reserve policy.