 I. Market Status After the Policy Shock
1. Price Recovery and Liquidity Restoration
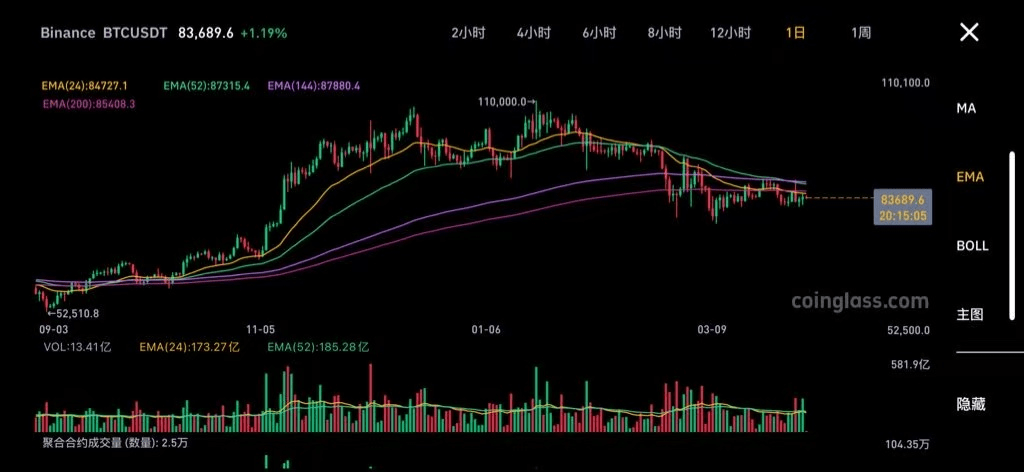
Since the Trump administration announced the "34% tariff policy on China" on April 2, which caused Bitcoin to plummet to $76,000-$77,000, the market has gradually digested the policy risk. As of April 5, the price of Bitcoin has rebounded to a range of $81,000-$83,500, while Ethereum has stabilized near $1,750-$1,850, indicating that short-term panic selling has temporarily eased.
• On-chain Data: Bitcoin short-term holder cost support is concentrated at $80,000-$82,000. On-chain transaction volume in this area increased by 40% compared to the previous day, indicating that some bottom-fishing funds have entered the market.
2. Divergence of Institutional and Retail Investor Behavior
• Institutional Side: Bitcoin spot ETFs such as BlackRock saw a net inflow of $221 million in a single day, and Tether increased its BTC holdings by $700 million in Q1, indicating long-term funds buying on dips.
• Retail Side: Altcoin market funds saw a stampede-like outflow due to adjustments in exchange leverage rules, with some turning to BTC/ETH for safe haven. However, contract open interest has decreased by 35% from its peak, and leverage risk has been somewhat mitigated.
II. Key Technical Signals and Bull-Bear Game
1. Bitcoin Core Volatility Range
• Support Level: Short-term focus on $82,500-$83,000 (4-hour EMA30 + concentrated chip area). If it is lost, it may explore the psychological threshold of $80,000.
• Resistance Level: $86,000-$88,000 is a strong pressure area (January downtrend line + trapped selling pressure). A breakout requires daily trading volume to increase to over $30 billion.
2. Ethereum Technical Fix Demand
• Support Level: $1,760-$1,780 (daily level support + whale order area). A break below this level may trigger an on-chain liquidation wave.
• Resistance Level: $1,900-$1,930 (20-day moving average + DeFi staking unlock pressure). A firm hold may initiate a rebound to $2,000.
3. Indicator Divergence Signals
• MACD Daily Chart: Bitcoin DIF and DEA formed a golden cross below the zero axis, but the histogram volume is only 30% of the previous rebound, posing a "weak rebound" risk.
• ETH/BTC Exchange Rate: Currently at 0.0213, close to a five-year low. A break below 0.021 may trigger a systemic sell-off in altcoins.
III. Funding Dynamics and Market Sentiment
1. Main Funds Flow
• Stablecoin Injections: USDC daily minting volume surged by $1.2 billion, and the USDT market value exceeded $110 billion, providing potential buying support for the market.
• Whale Movements: Ethereum whales placed orders for 21,958 ETH (worth approximately $80.9 million) at $1,894, with high-leverage long positions reaching $152 million, betting on a short-term rebound.
2. Sentiment Indicator Recovery
• Fear & Greed Index: Recovered from 20 (Extreme Fear) on April 2nd to 35 (Fear), but still below the neutral threshold.
• Options Market: Bitcoin put option premium has dropped to -8%, indicating weakened demand for short hedging.
IV. Risk Warning and Operational Strategy
1. Short-term Risk Events
• Macro Disruptions: US CPI data released on April 10 (expected 3.1% YoY). If it exceeds expectations, it may rekindle concerns about interest rate hikes.
• On-chain Liquidation Threshold: If Bitcoin falls below $80,000, it will trigger the forced liquidation of approximately 24,000 BTC (worth $1.9 billion) in long positions.
2. Operation Suggestion
• Bitcoin:
◦ Long positions: Lightly test long positions at $82,000-$83,000, stop loss at $80,500, target $85,000-$86,000.
◦ Short positions: Try shorting in batches at $84,300-$85,000, stop loss at $86,500, target $81,500-$80,000.
• Ethereum:
◦ Breakout Strategy: Buy on retest after holding firm at $1,880, target $1,920-$2,000; exit and observe if it breaks below $1,750.
V. Summary
The current market is in a volatile recovery phase after the policy shock. The core volatility range for Bitcoin is $80,000-$86,000, and for Ethereum, it is $1,750-$1,930. Operationally, it is recommended to mainly sell high and buy low, cautiously follow breakthroughs, and focus on preventing volatility spikes before and after the CPI data. Long-term investors can pay attention to institutional bottom-fishing opportunities below $78,000 for Bitcoin (MicroStrategy's cost area).