February closed in red for the third time in BTC's history and the second time in ETH's history. We've left behind a February that ended with sharp declines, making many investors uneasy with its movements at the top. As we enter March, when quarters will close, important news and data await us. During these days of high-impact data on prices, numerous factors are at play, including war, tariffs, economic conditions, and inflation. Expectations have increased with Trump's announcement of important news tomorrow. Additionally, the White House will host a crypto summit on March 7.

Bitcoin
Last week's decline broke the narrow price movement within the month. Although monthly implied volatility remained lower, recent movements have increased volatility expectations. Despite breaking below the important 90k support, it climbed back above with March's opening.

Looking at March data, we can expect monthly average volatility of 33% and weekly of 15%. This suggests a price range from the monthly opening at 84k between 56k and 112k, and from today's weekly opening between 80k and 109k. The 88k region can be monitored as a pivot.


While $11 billion worth of contracts were purchased for March 28, the Max Pain price is 85k. The Put/Call Ratio at 0.45 indicates quite bullish expectations. The Funding Fee has also turned positive again.

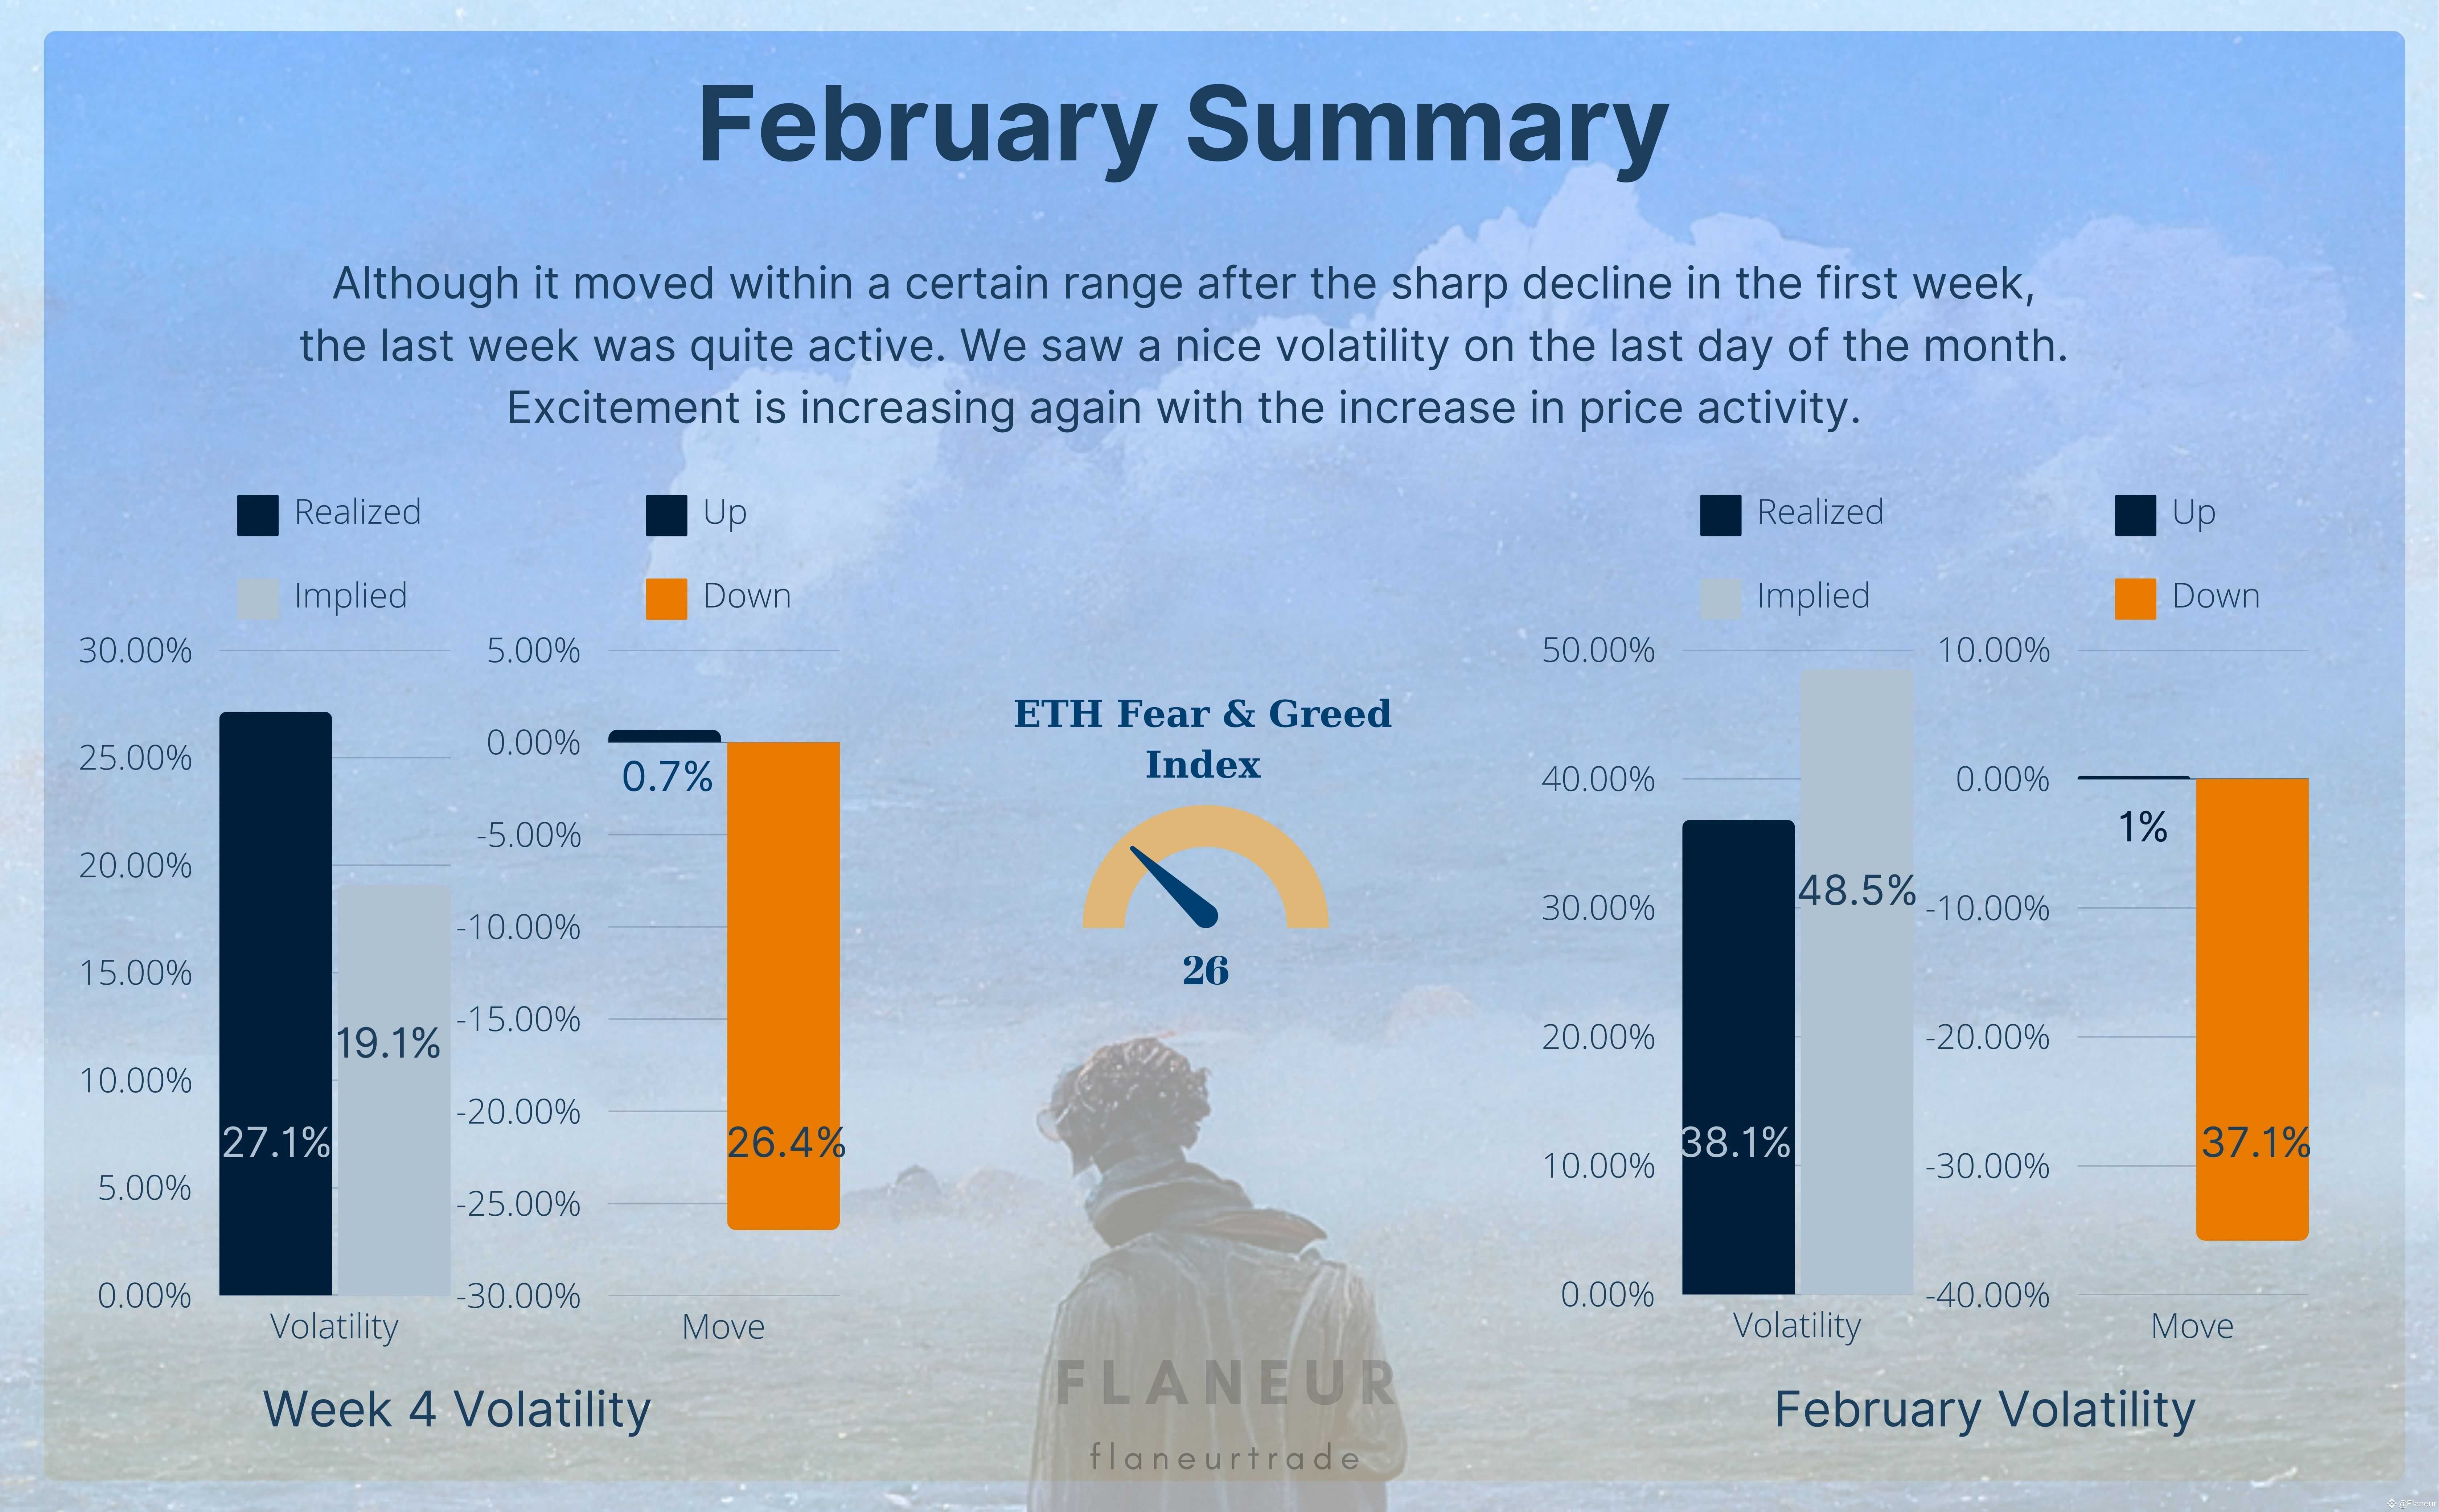
ETH experienced a 36% drop after the monthly opening, followed by range movement between 2500-2850. With last week's decline, the 2075 region again served as support. It approached implied volatility with 38% monthly volatility.
March presents a handicap. In March 2017, its rise from $15 to $55 created 250% volatility. This is significant enough to mislead our data. Therefore, I'll share and graph the ratios excluding 2017's data. After this adjustment, monthly average volatility is 66%, weekly approximately 22%. Excluding 2017, the monthly average becomes 40%, weekly 17.5. Monthly 66% Implied volatility range shows $750-3700, 40% shows $1340-3140, and weekly shows 1965-3160. The 2550 region can be monitored as a pivot.


For March 28, $2 billion worth of contracts were purchased, with Max Pain price at $2800. The Put/Call Ratio at 0.34 indicates very bullish expectations. DVOL shows a 68% increase.

ETHBTC
Though testing the 0.3 region, it continues its downward trend. I believe we shouldn't see closures below the expanding channel. Perhaps the movement providing ETH's high volatility could come through ETHBTC chart movements. We might see much sharper movements with price moving up or down. I consider 0.0195 and 0.03 as important support and resistance areas that should work during sharp movements.

#USCryptoReserve #MarketRebound #BTCRebundsBack #CMEsolanaFutures