Hello everyone. As we leave July behind with significant gains, it's time to examine the potential movements and critical data that August will bring. After BTC's new peak in July and ETH's notable rise, markets are seeking a new balance. So, what awaits us in August with its intense macroeconomic and geopolitical agenda?
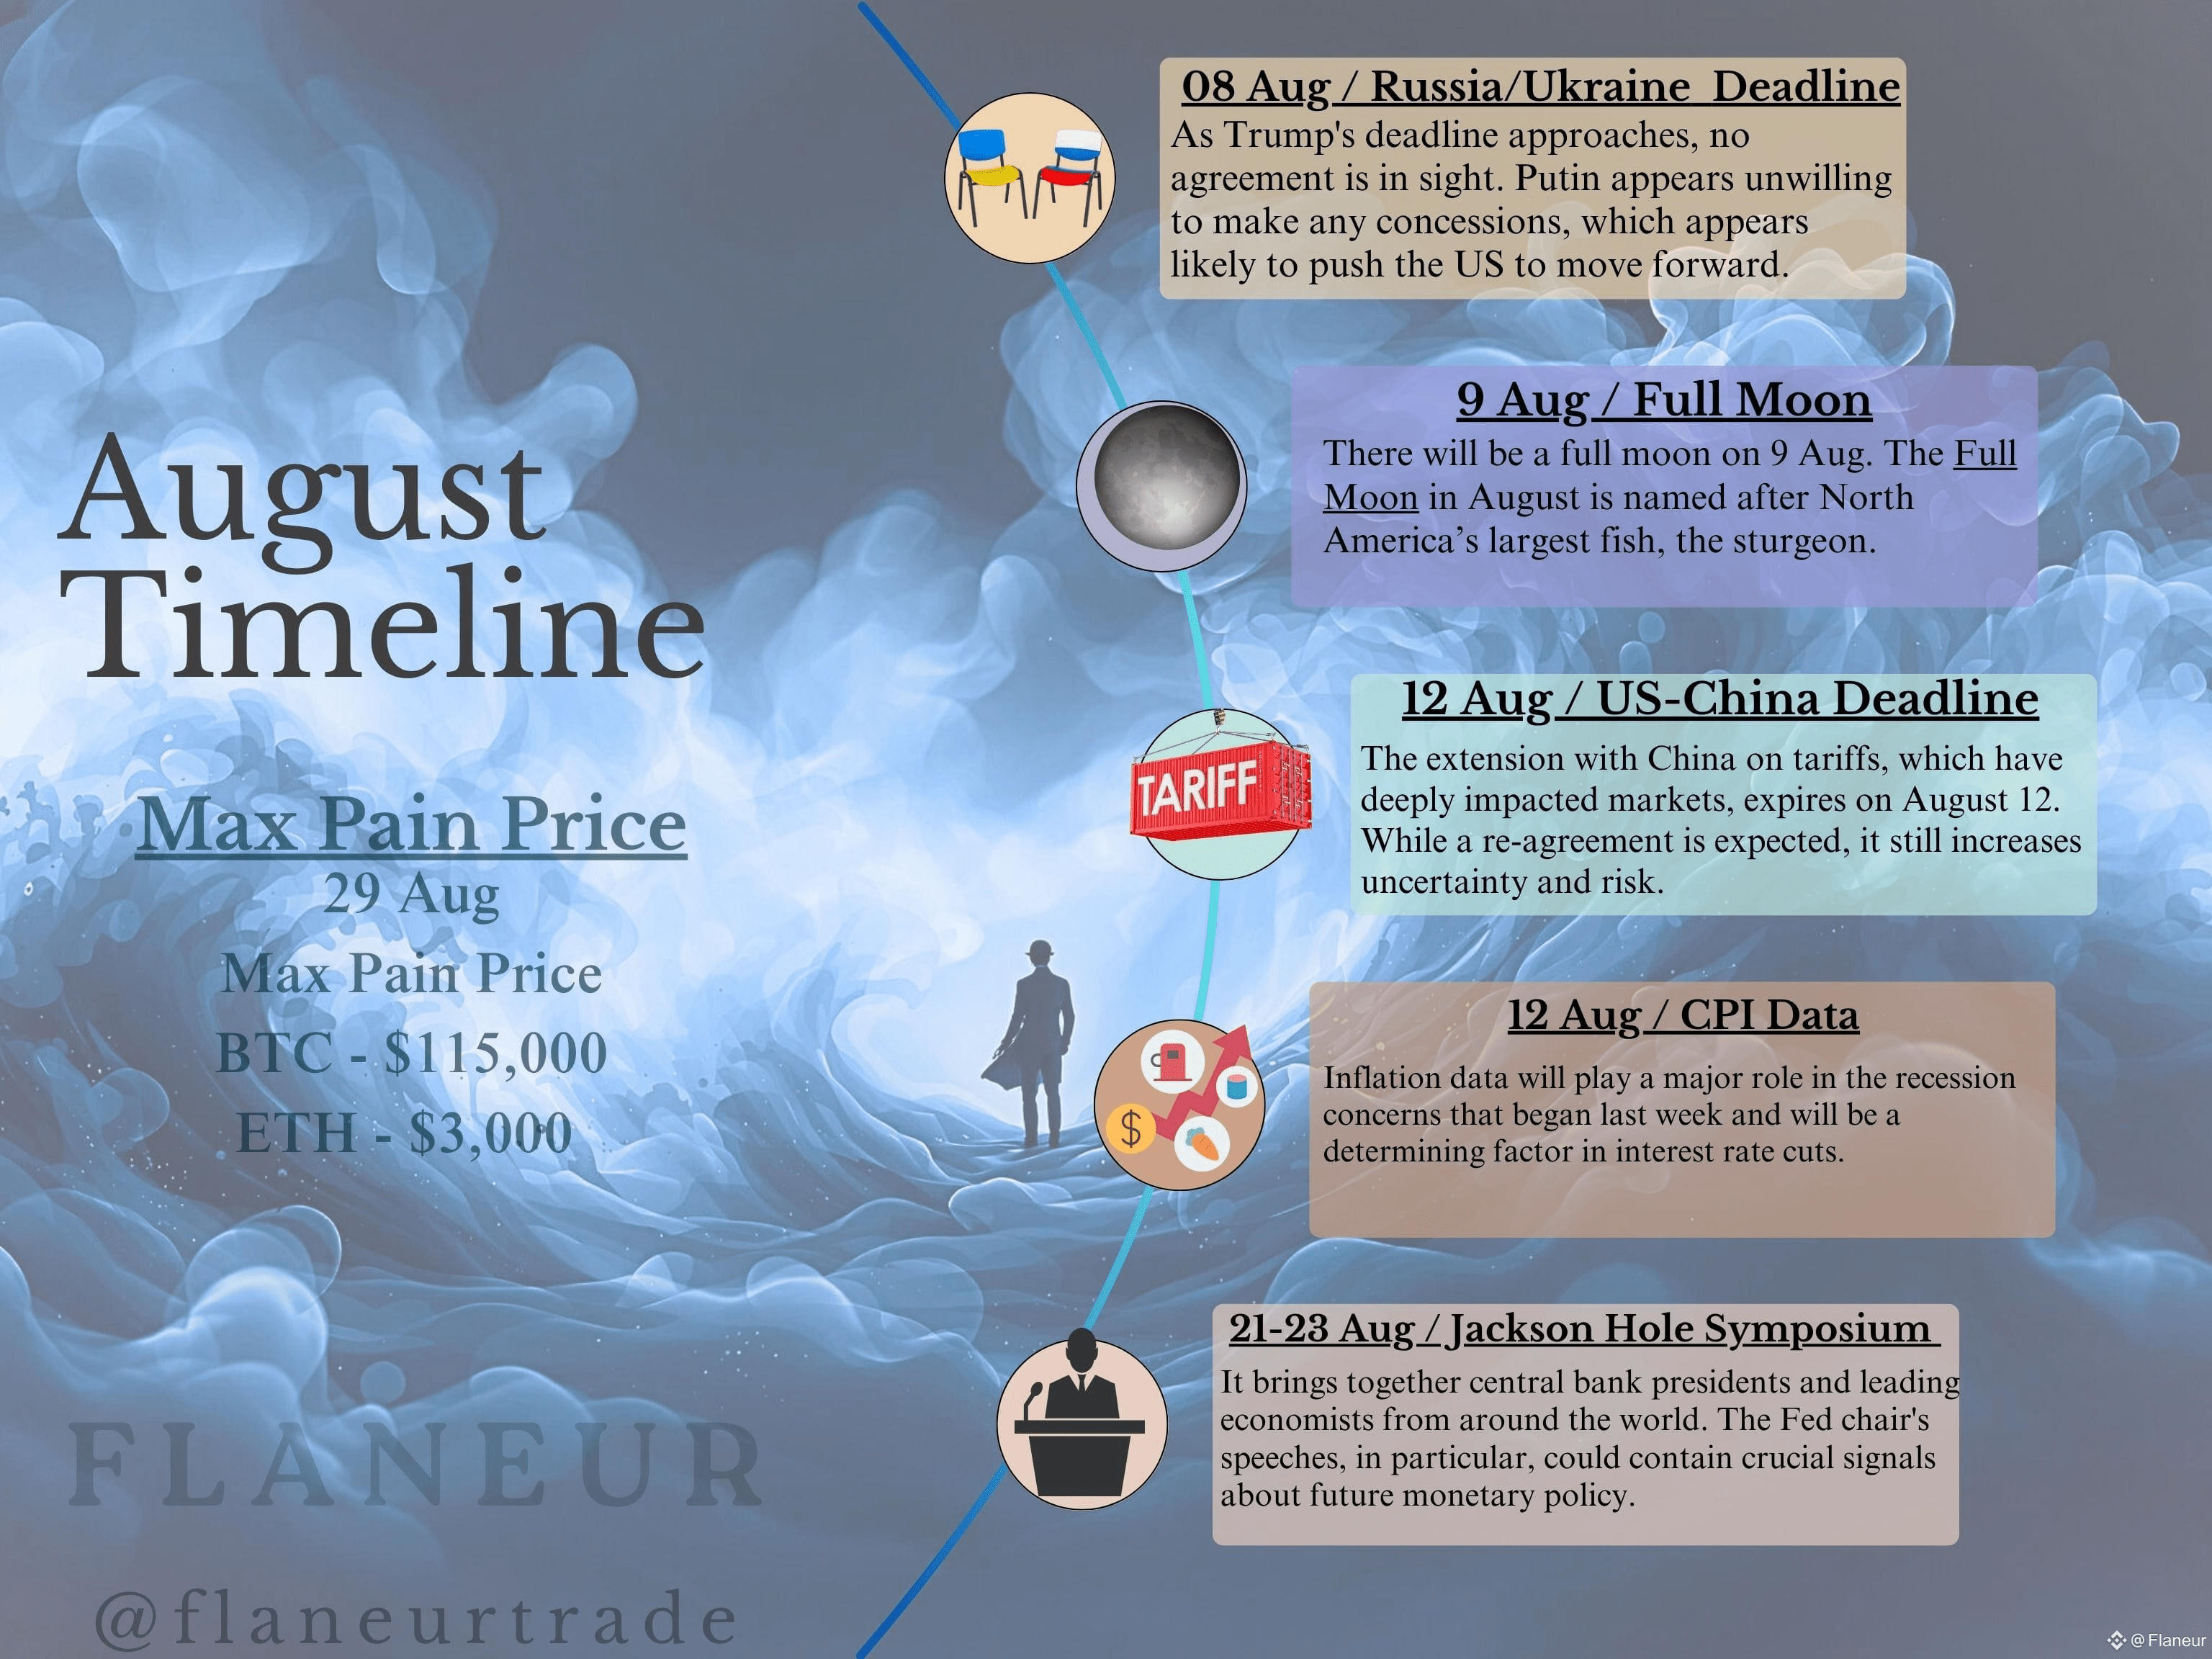
August's calendar is packed with important dates that could trigger volatility in the markets. The deadlines regarding Russia/Ukraine tensions on August 8th and US-China tariff tensions on August 12th could directly affect global risk appetite. The month's most critical data will be the US CPI data to be announced on August 12th. This data will play a decisive role in FED's interest rate policies with the signals it gives about inflation's trajectory. At the end of the month, the Jackson Hole Symposium, scheduled for August 21-23, will be closely watched for the messages central bank governors and leading economists give regarding monetary policy.
Bitcoin (BTC)
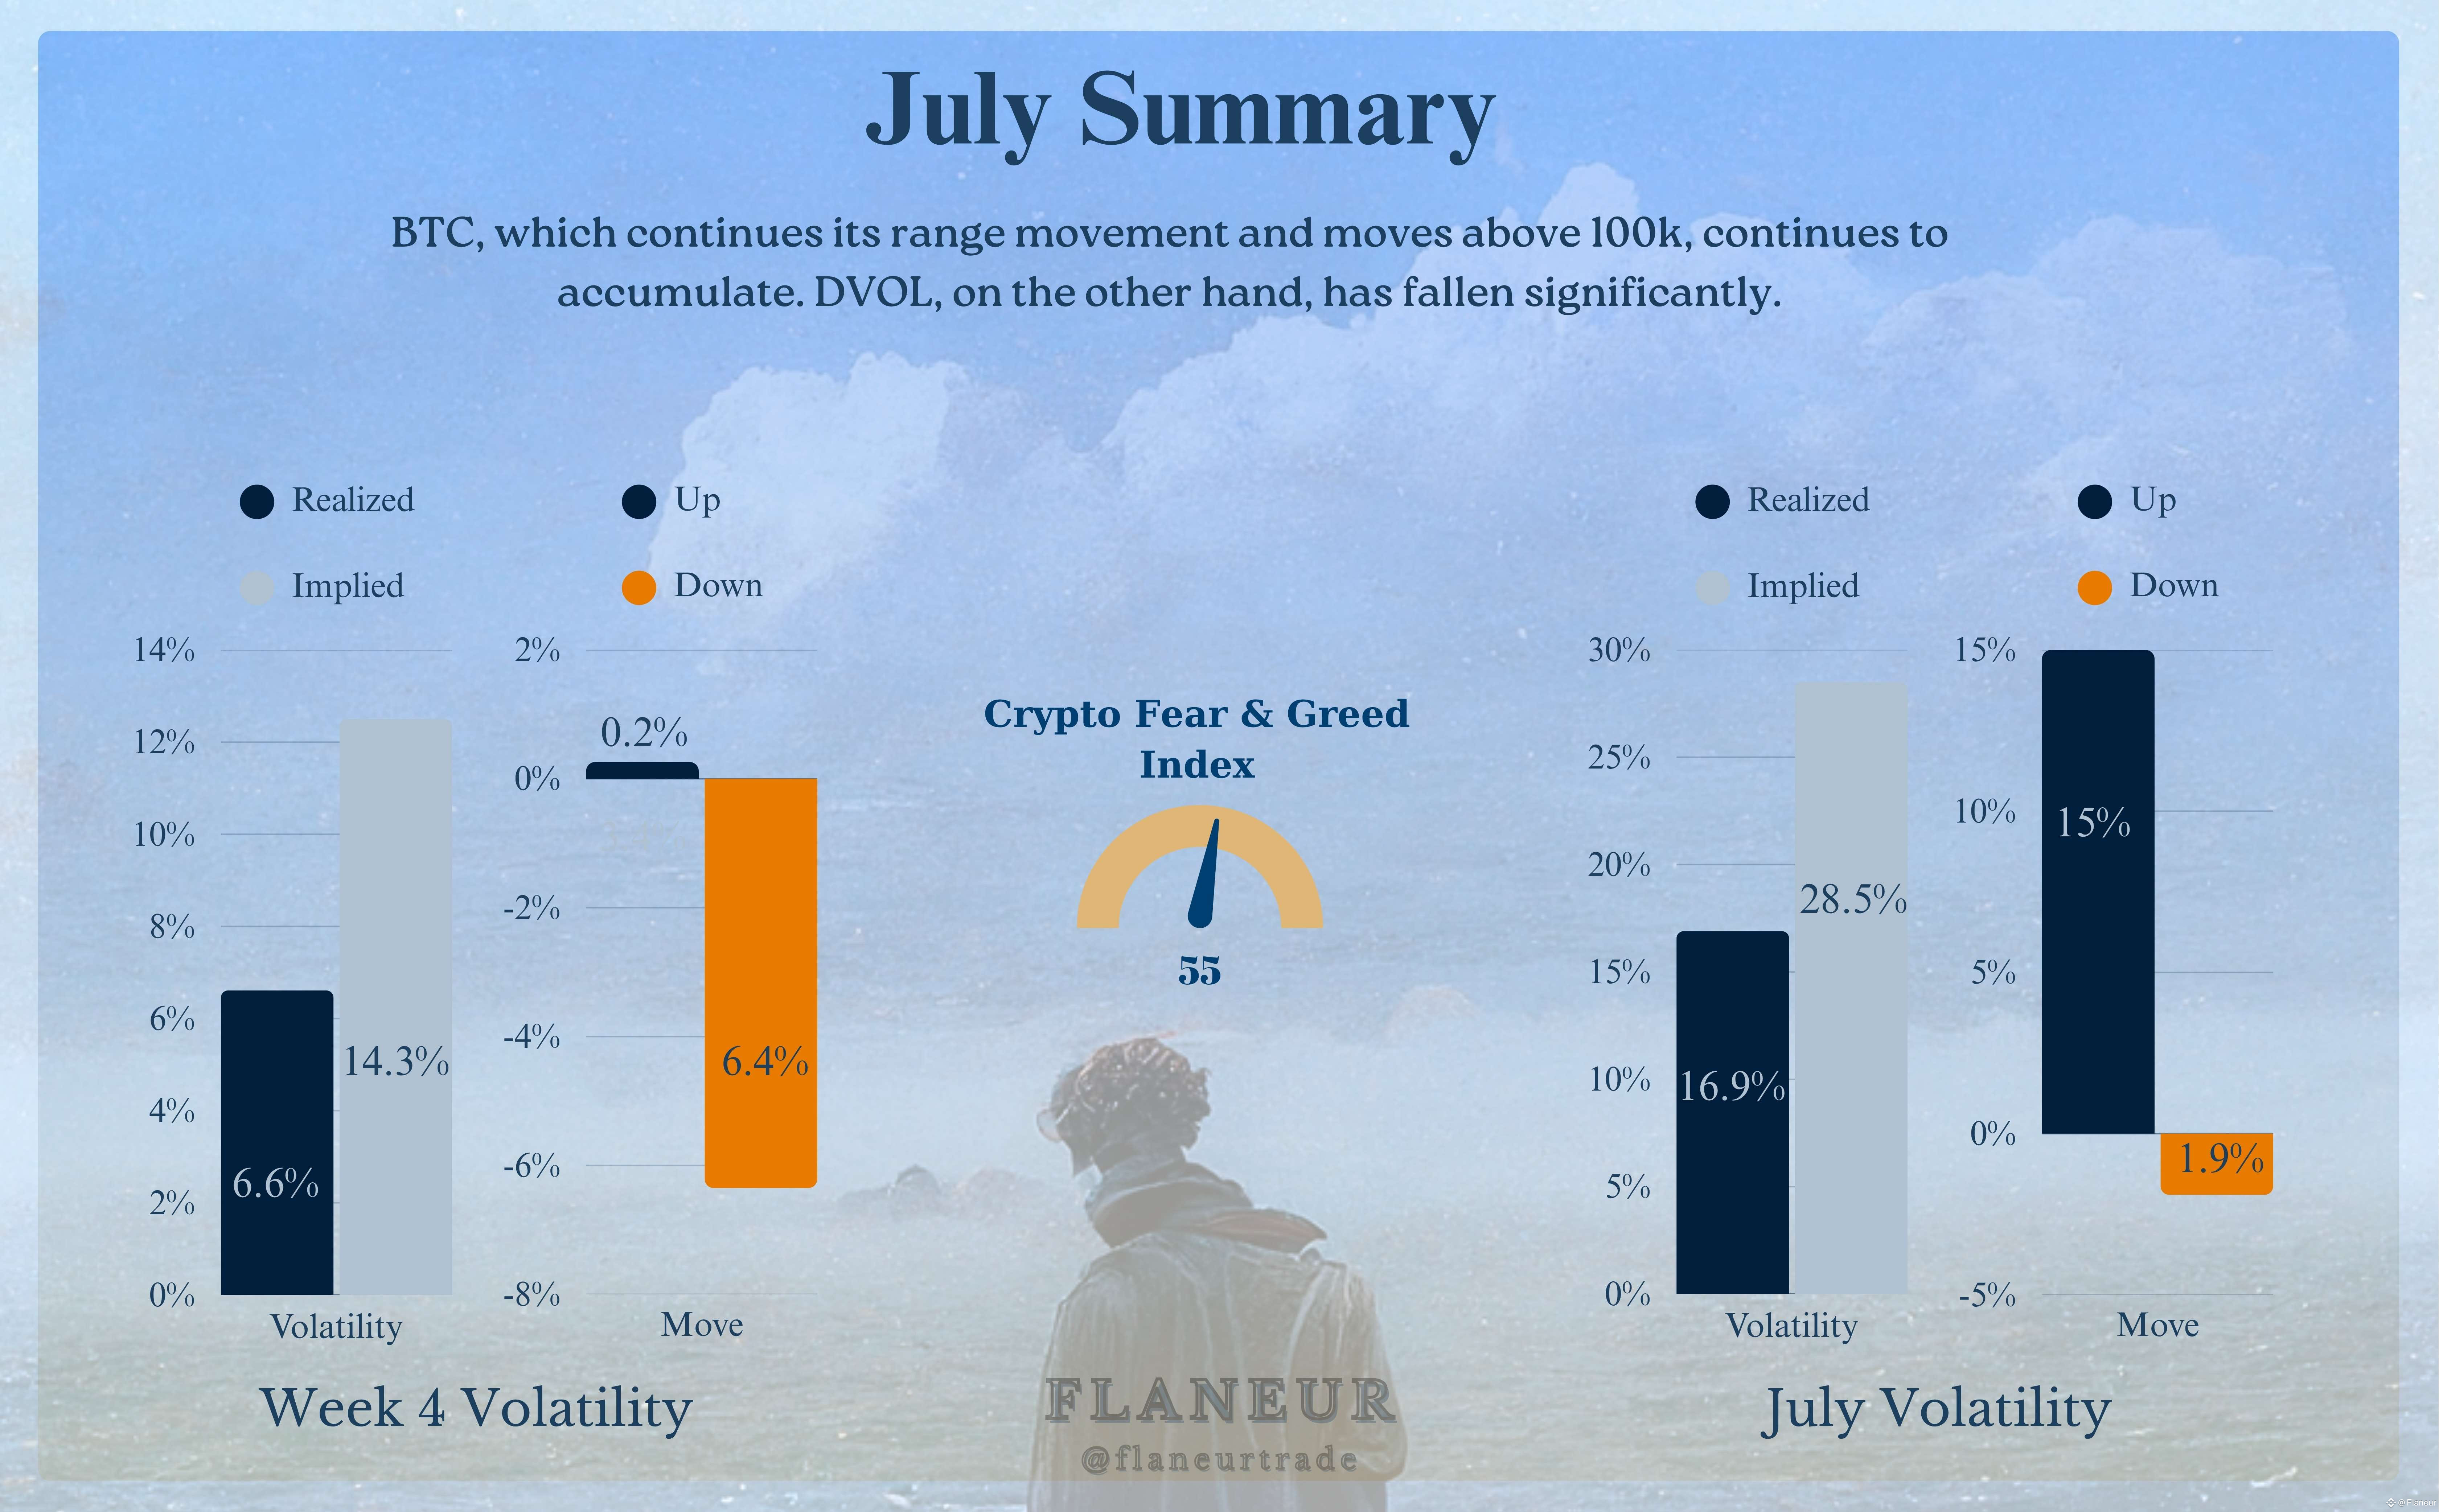
BTC closed July with an 8% rise and a new ATH. However, despite this rise, a significant decrease in volatility was observed throughout the month. July's overall volatility was 17%, while the Crypto Fear and Greed Index at 53 indicates some market uncertainty.
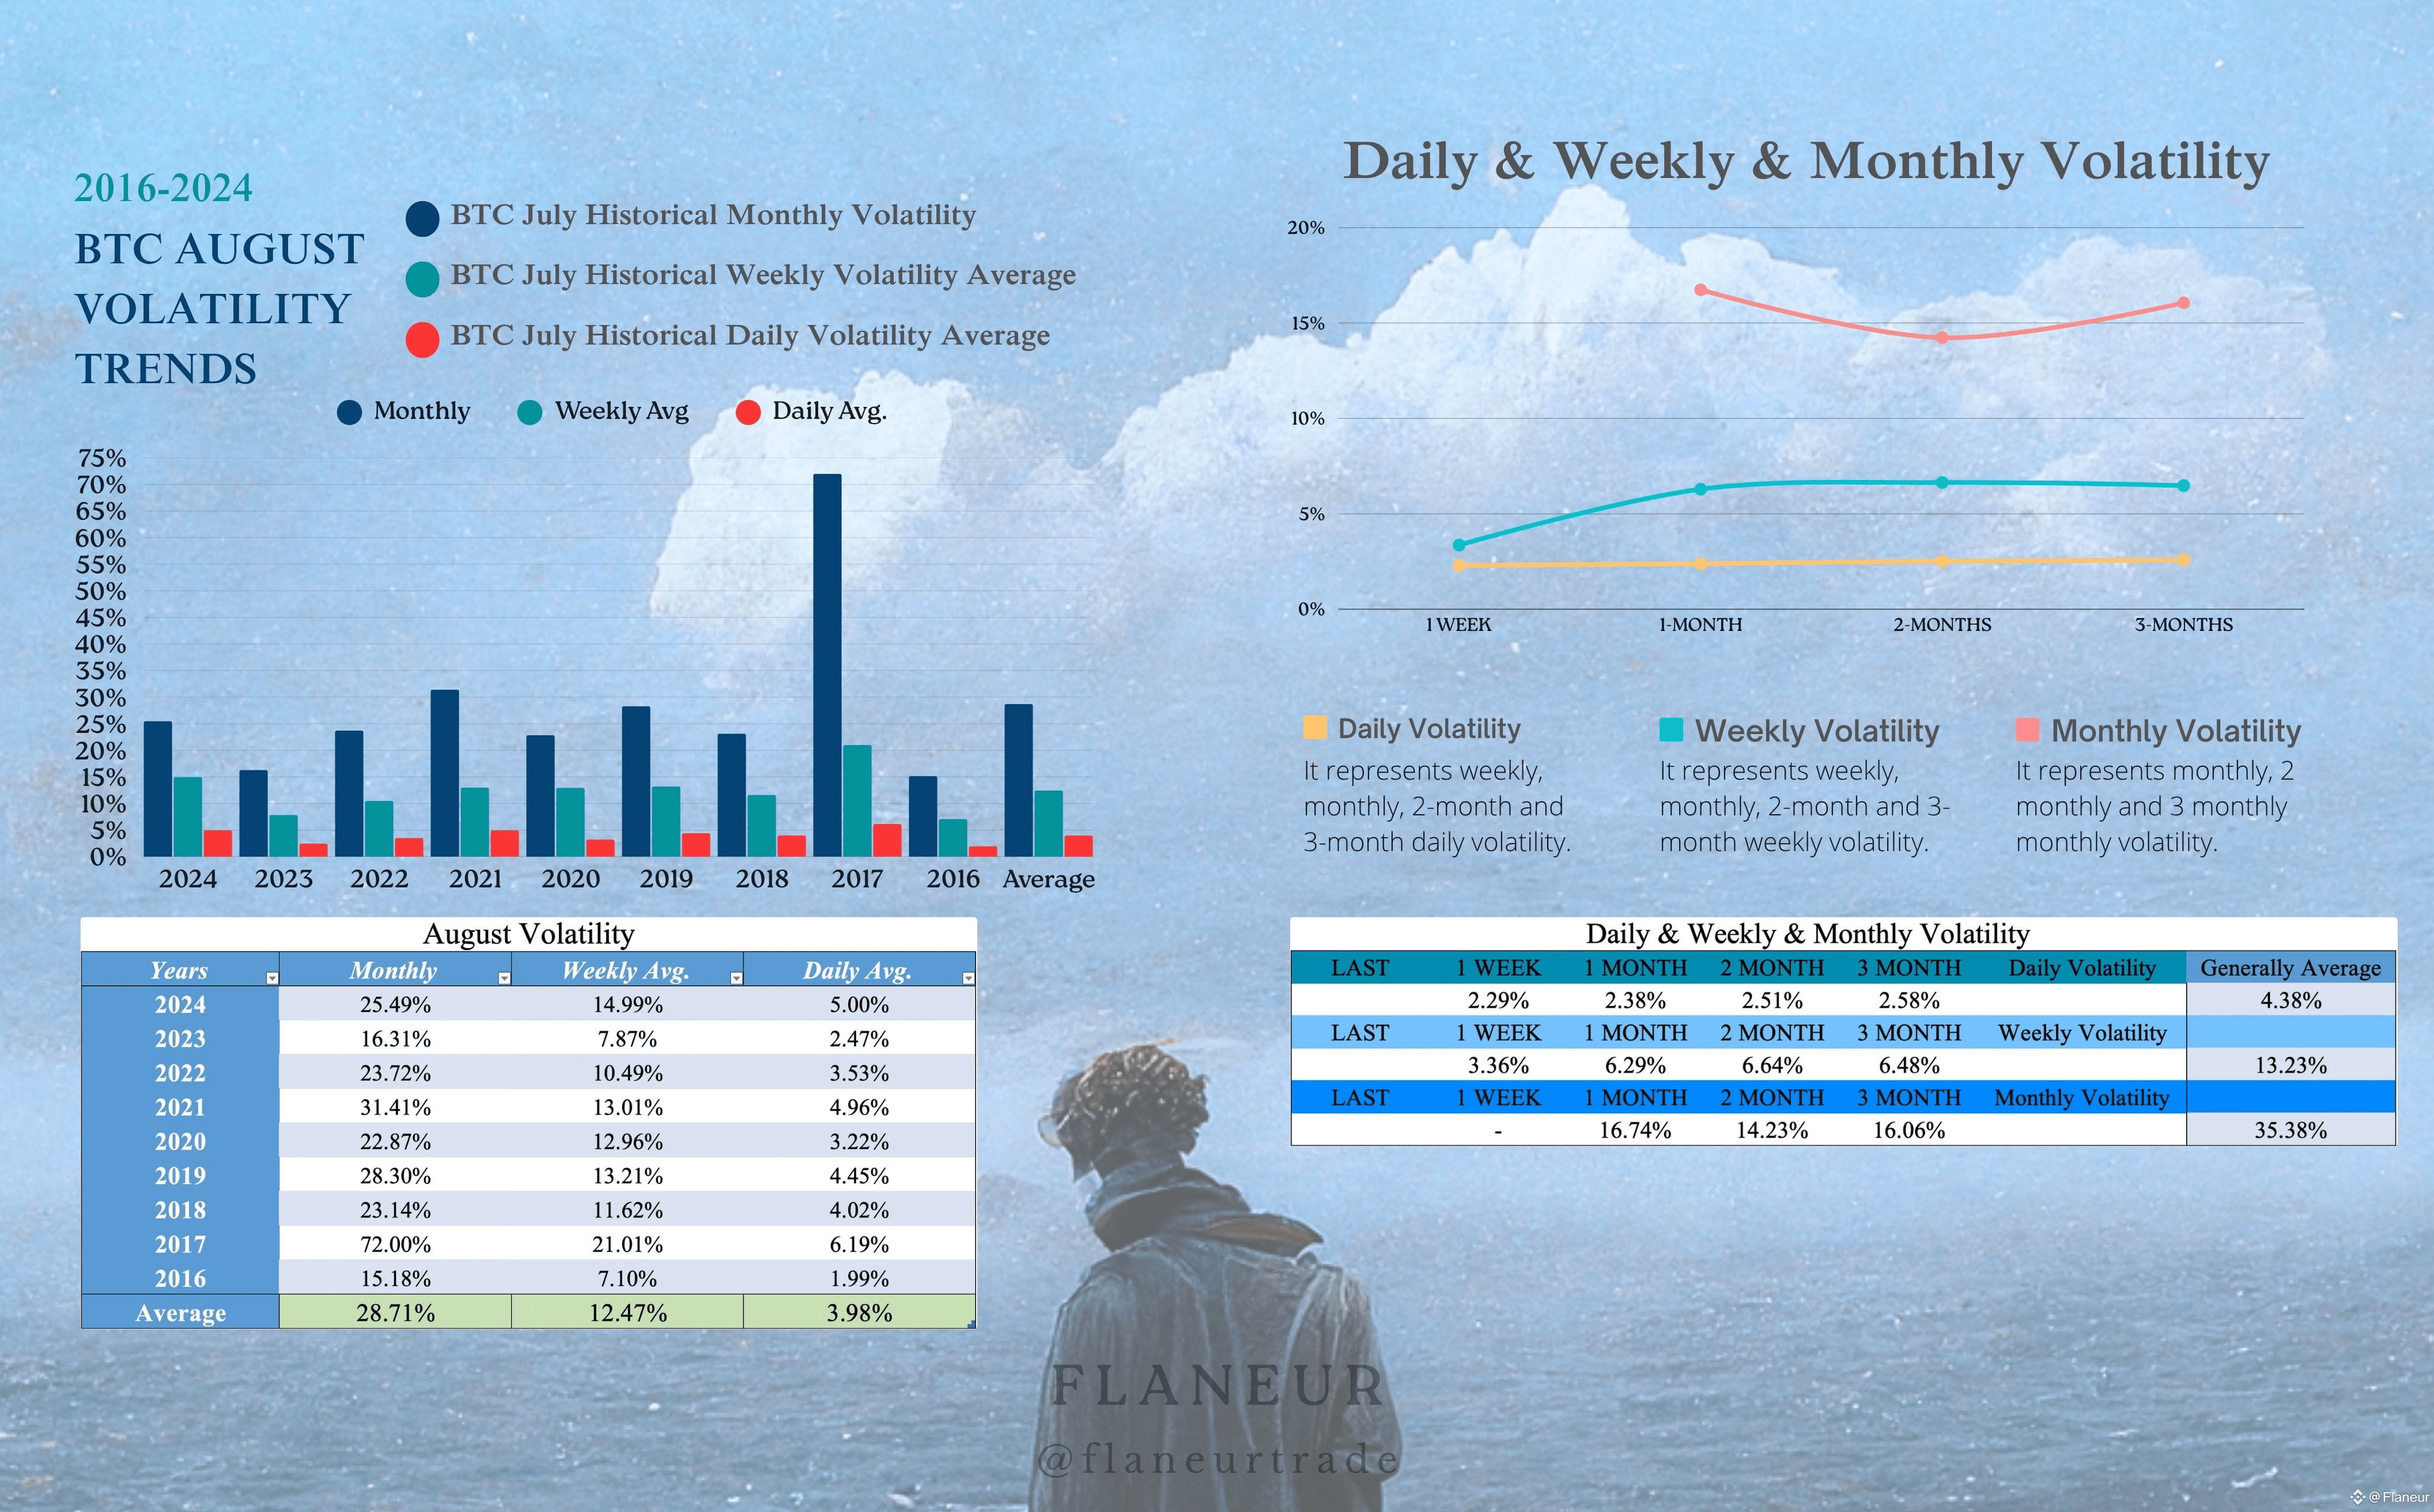
Looking at historical data for August, BTC's monthly average volatility is around 29%, weekly average 12%. This gives a monthly price band of 83k-148k, and weekly 100k-128k.
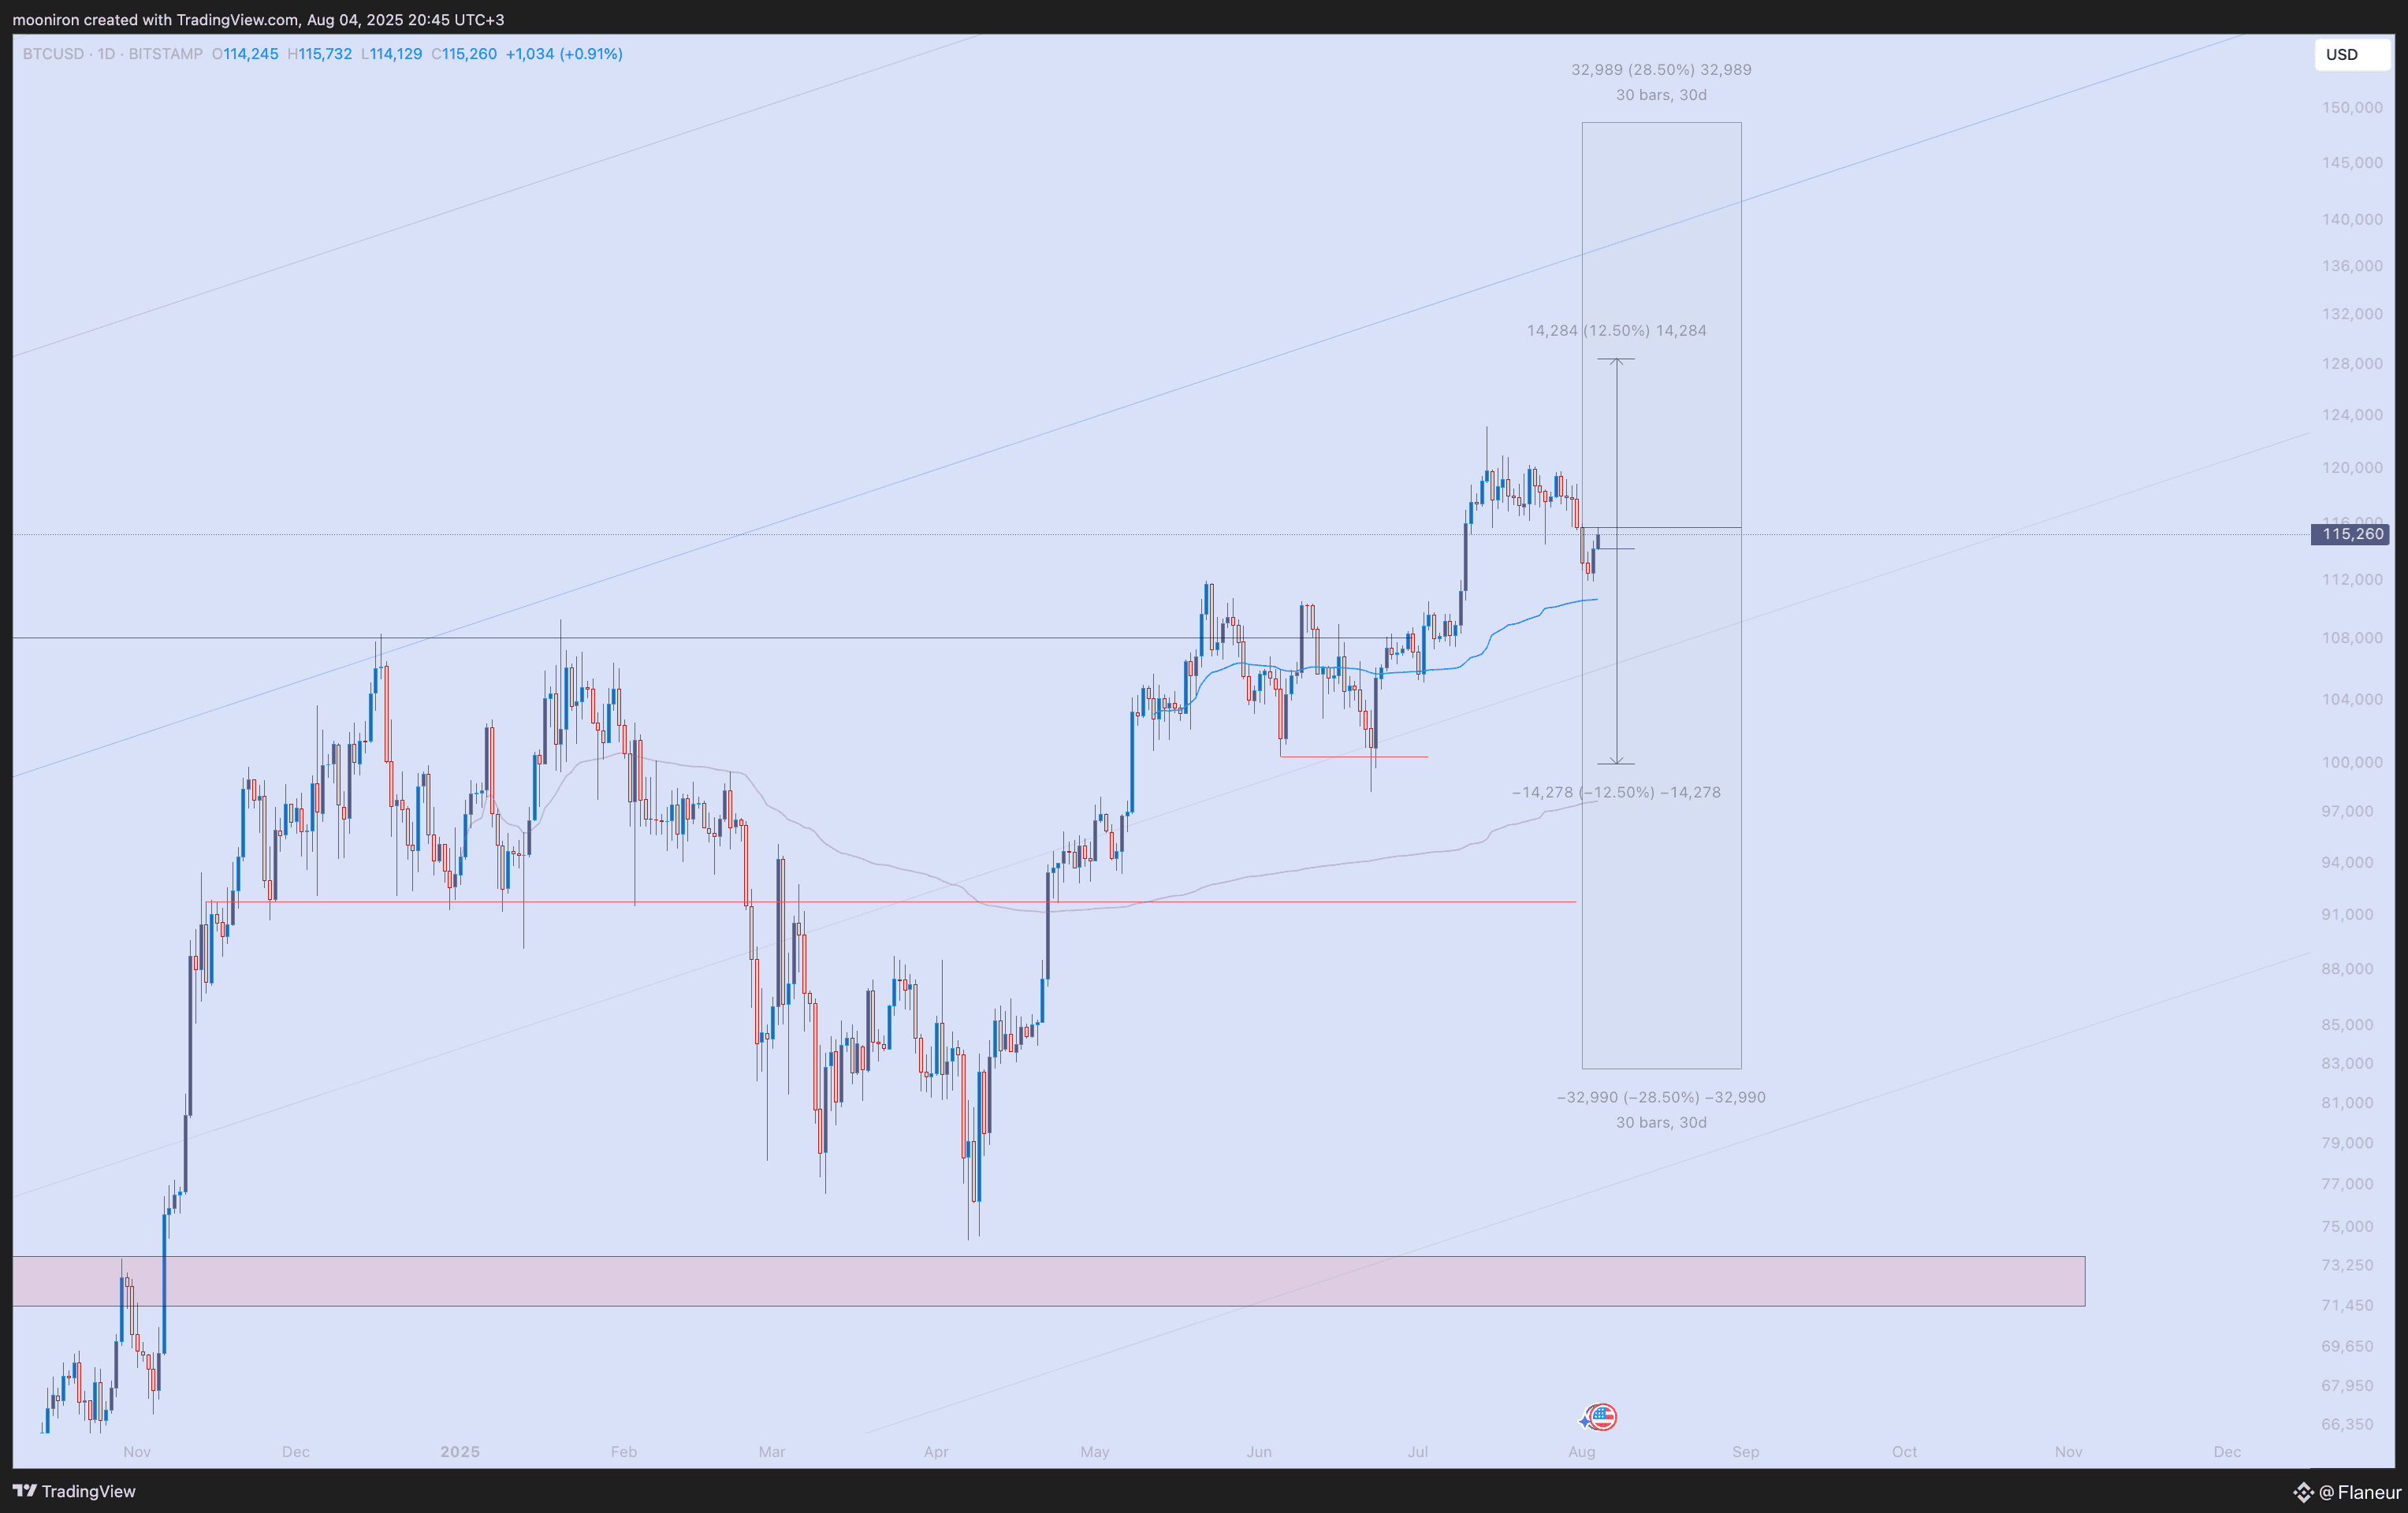
However, the recent low volatility trend and August's potential to be generally calmer suggest we might see a more compressed movement this month too. In this context, a pullback to the $110,000-$112,000 region in a possible retreat can be considered normal. In months when volatility drops this much, selling option contracts is one of the most logical choices.
Looking at options market data:
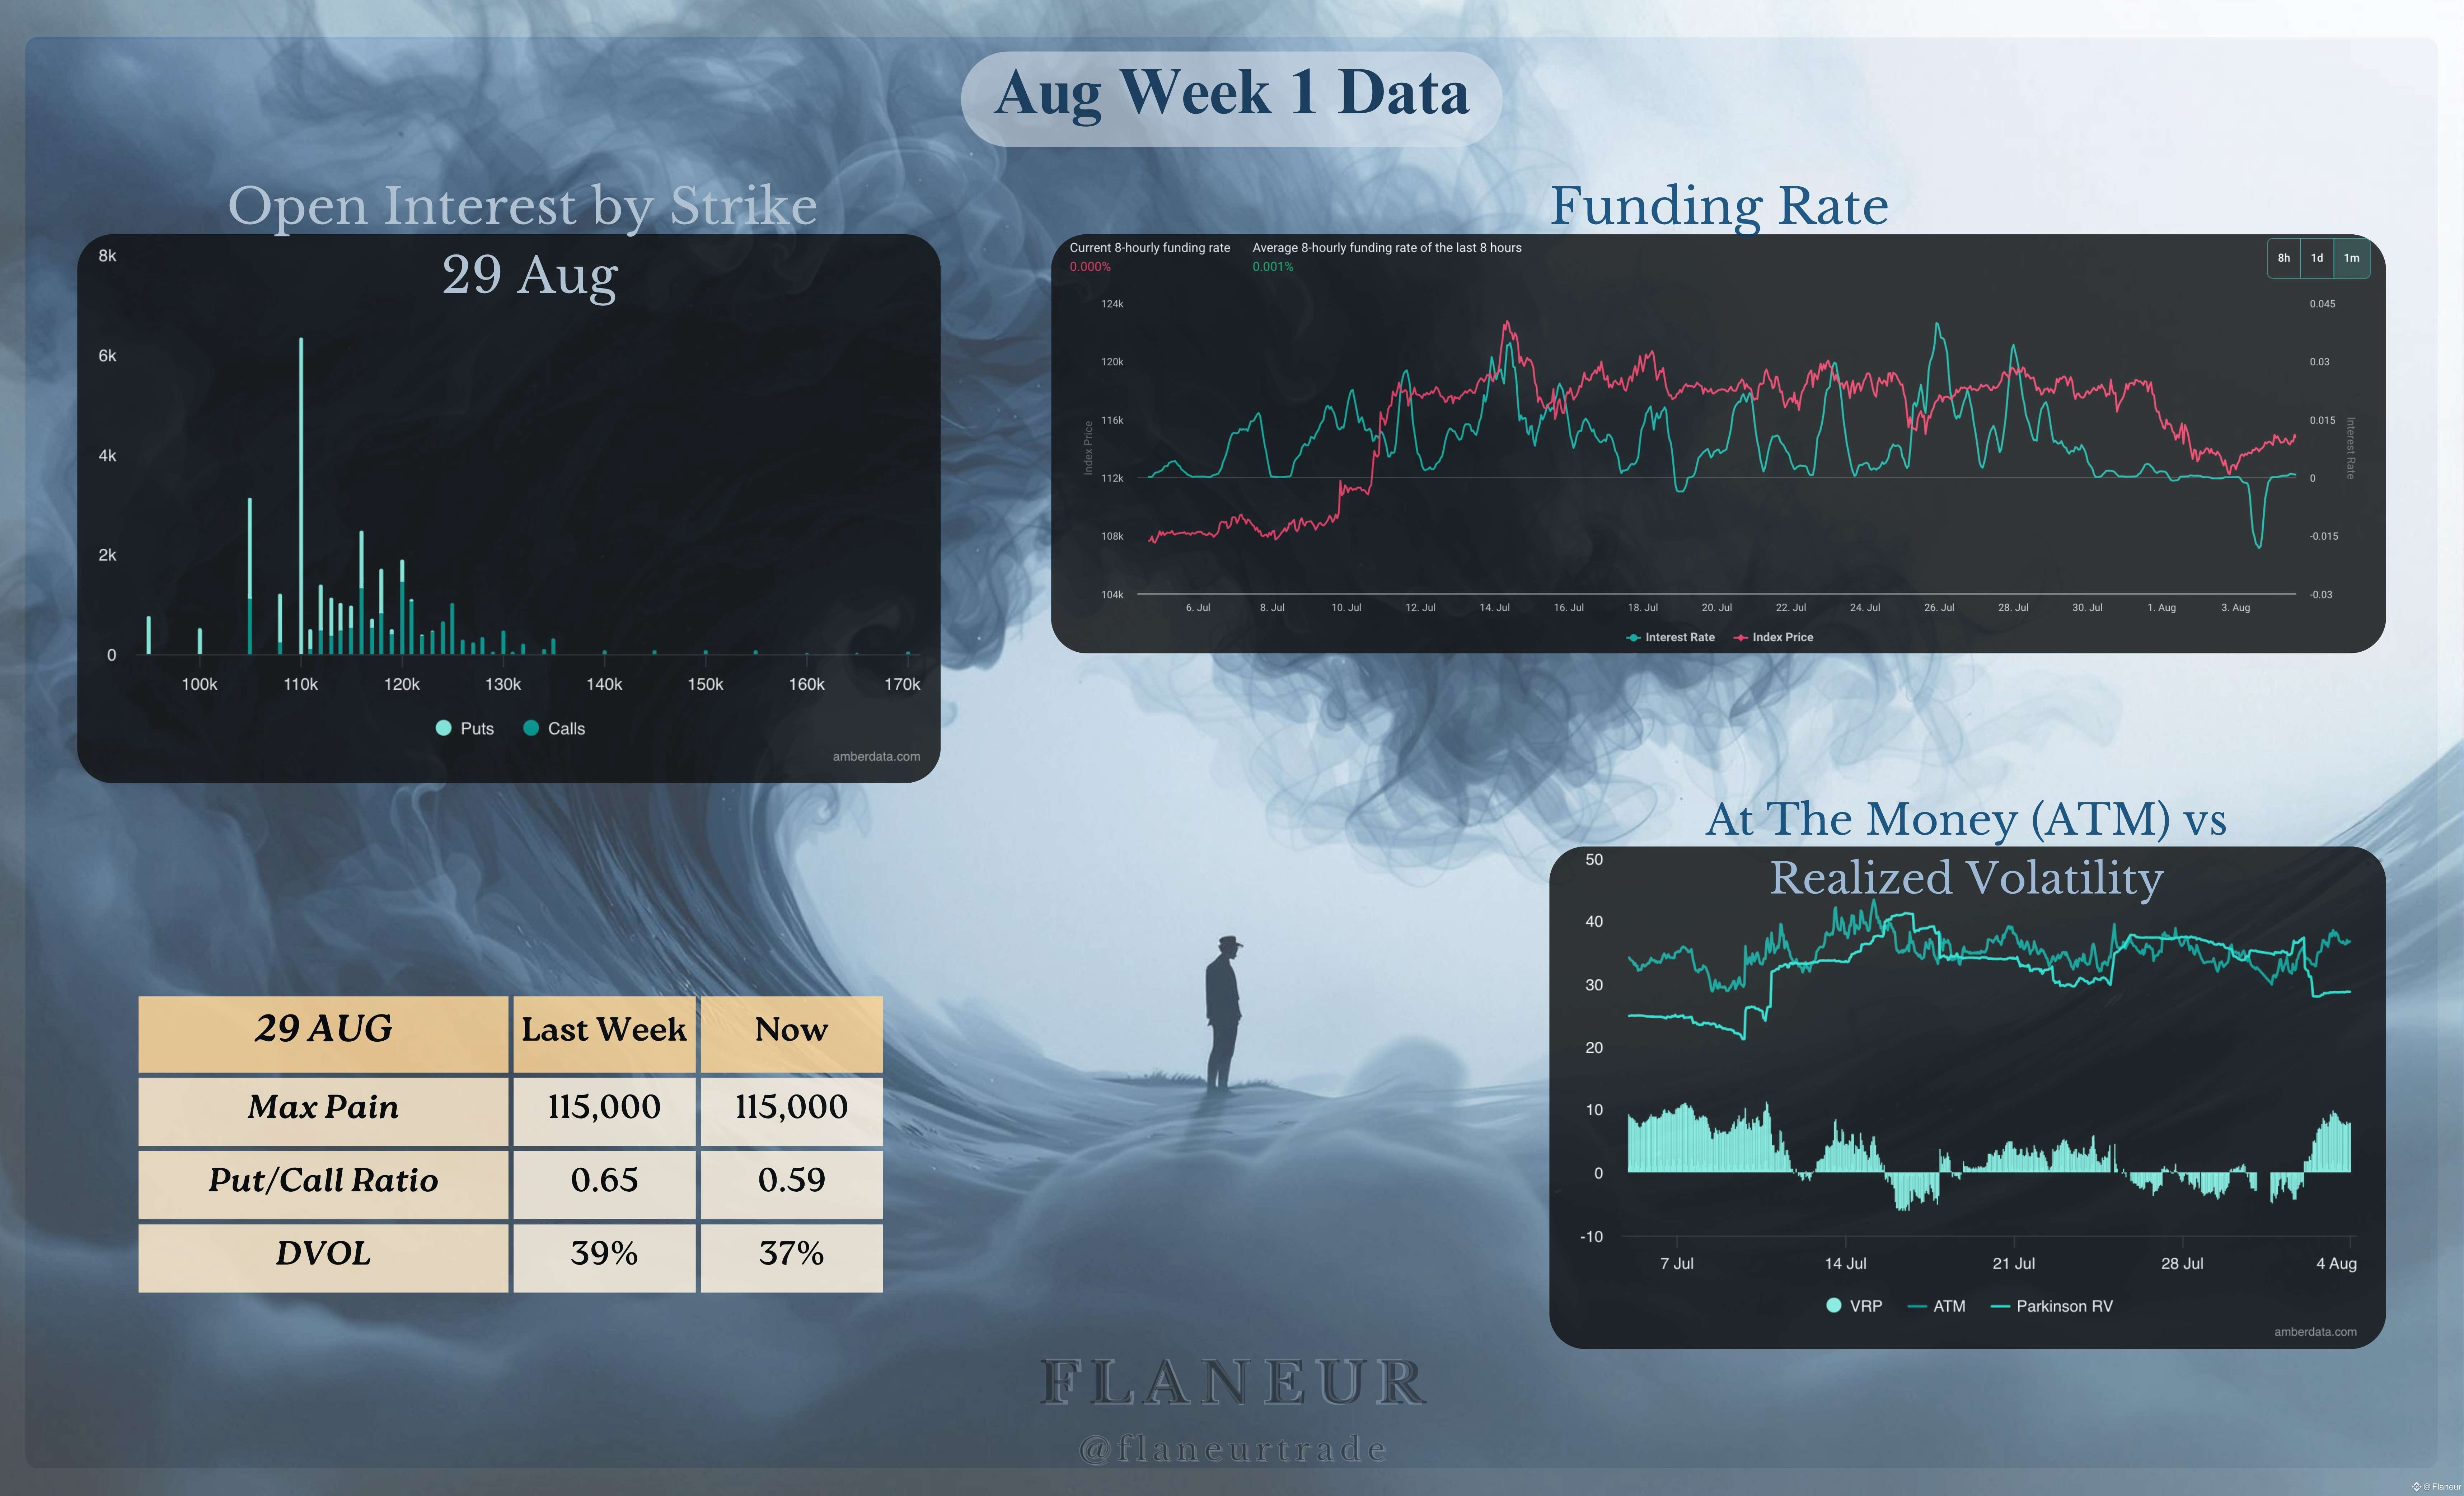
Max Pain: For August 29 expiry contracts, Max Pain price is at $115,000, similar to monthly opening
Put/Call Ratio: The ratio has declined to 0.59, showing decreased demand for put options and increasing market optimism
DVOL (Derivative Volatility): DVOL declining from 39% to 37% confirms continued low volatility expectations for the near term. We'll revisit this topic at the end of the article
Funding Rate: Funding rates are moving at neutral levels, indicating no excessive long or short position accumulation and a waiting stance
Additionally, in August 8th contracts, BTC's 110k strike contracts have seen significantly high demand with a Put/Call ratio of 1.20, showing quite bearish expectations. For ETH, 3500 strike put contracts are in high demand with a P/C ratio of 1.10.
Ethereum (ETH)
ETH literally put on a show in July. Recording approximately a 59% jump during the month, ETH closed with a 49% rise. During this process, quite high volatility of 63% was recorded. With the recent correction, the Fear and Greed Index is at 58, positioned between neutral and greed.
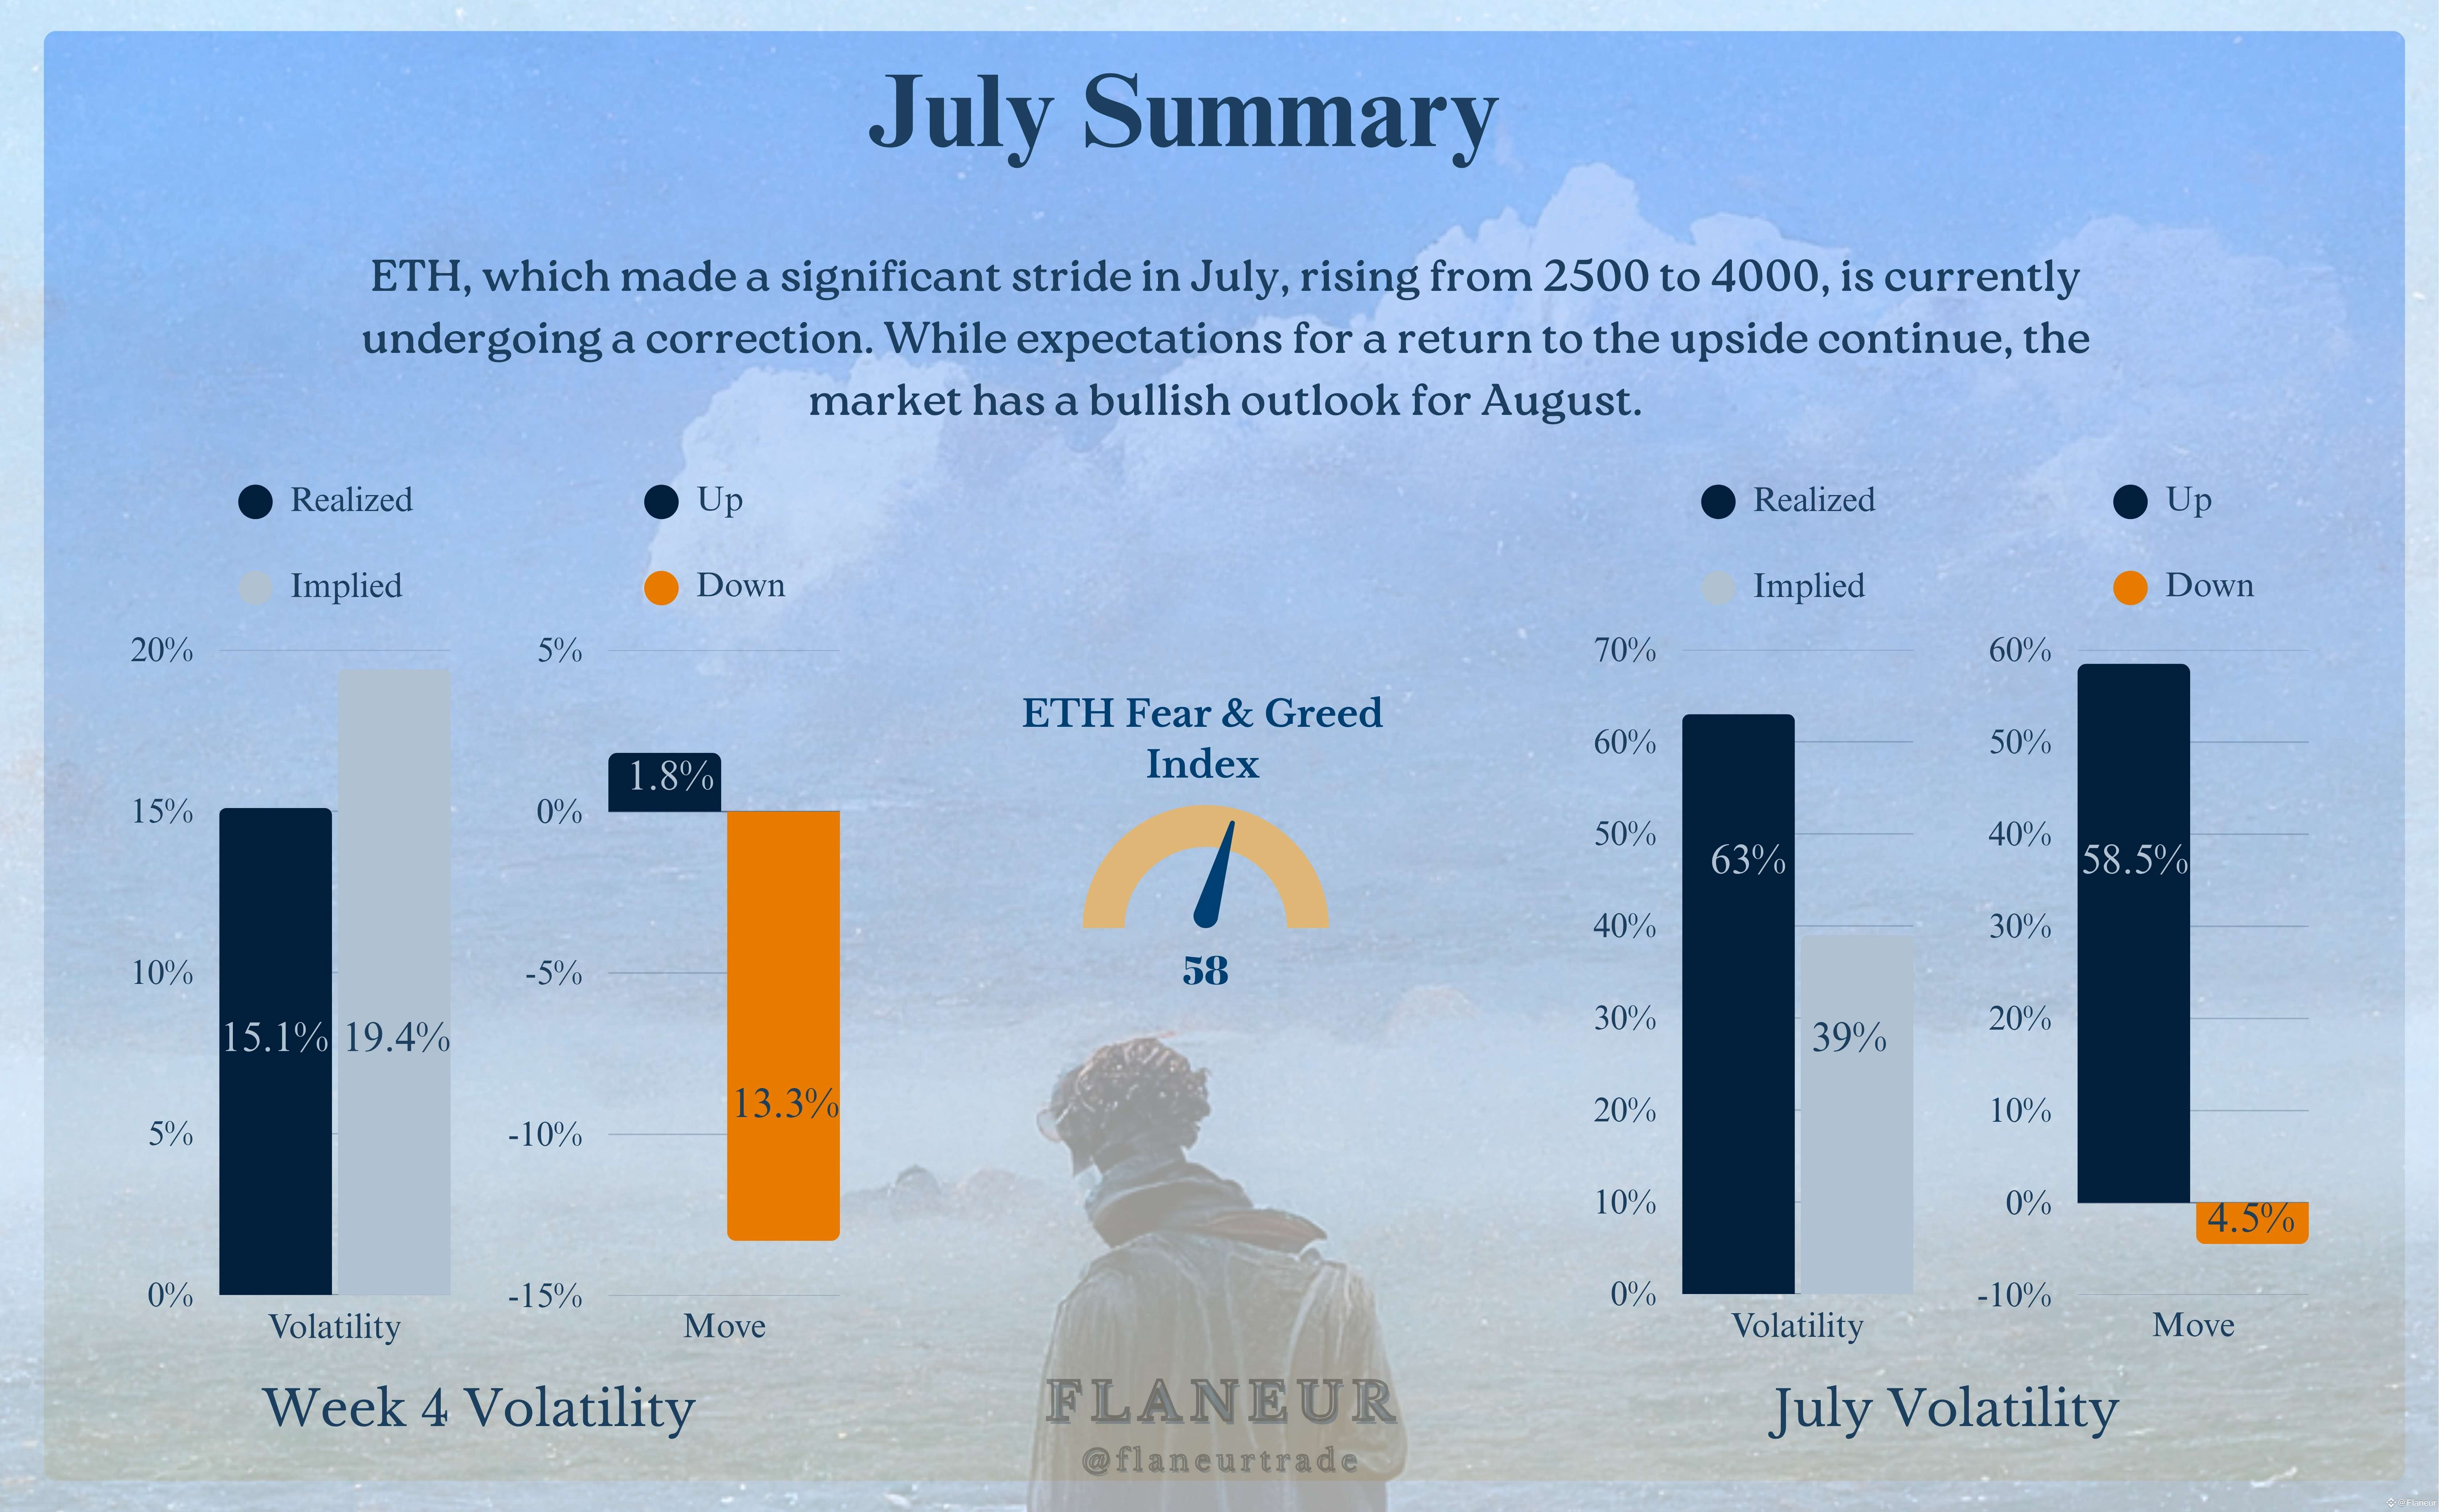
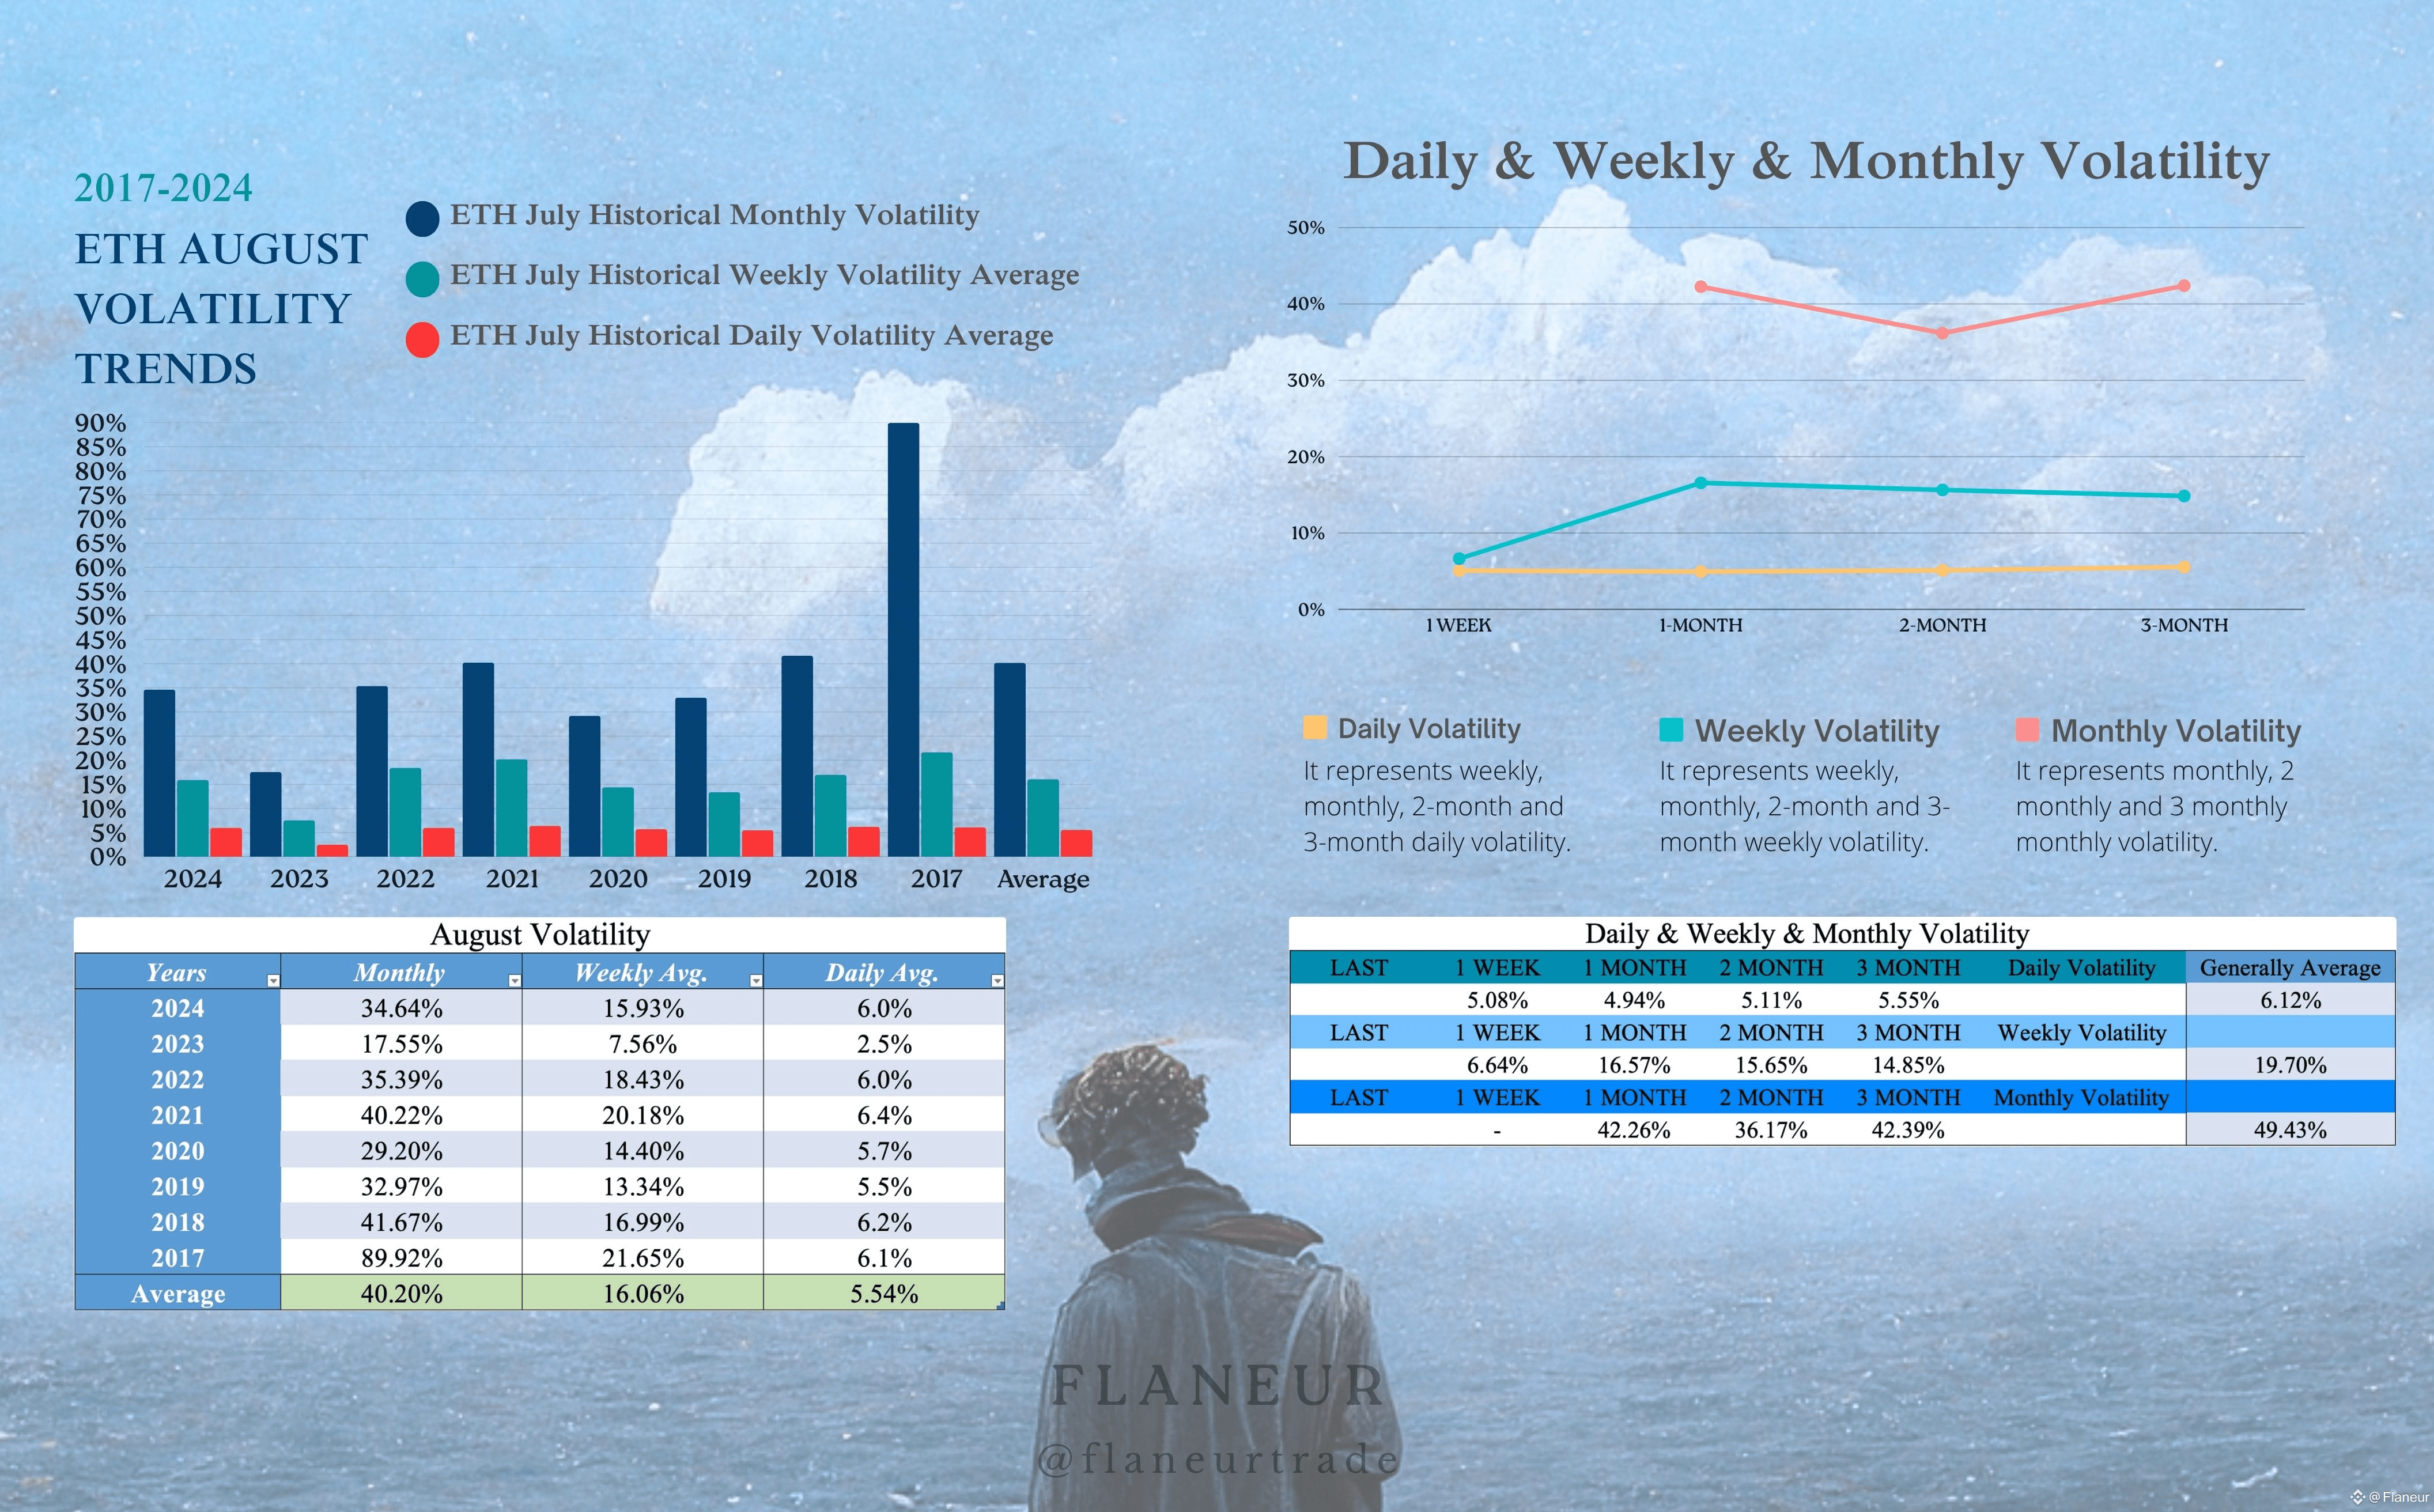
For ETH, August historical averages point to higher volatility compared to BTC, with monthly 40% indicating a 5200-2200 range, and weekly 16% indicating a 2950-4050 price range. For scalpers, with a daily average of 5.5%, nice intraday trades can be caught.
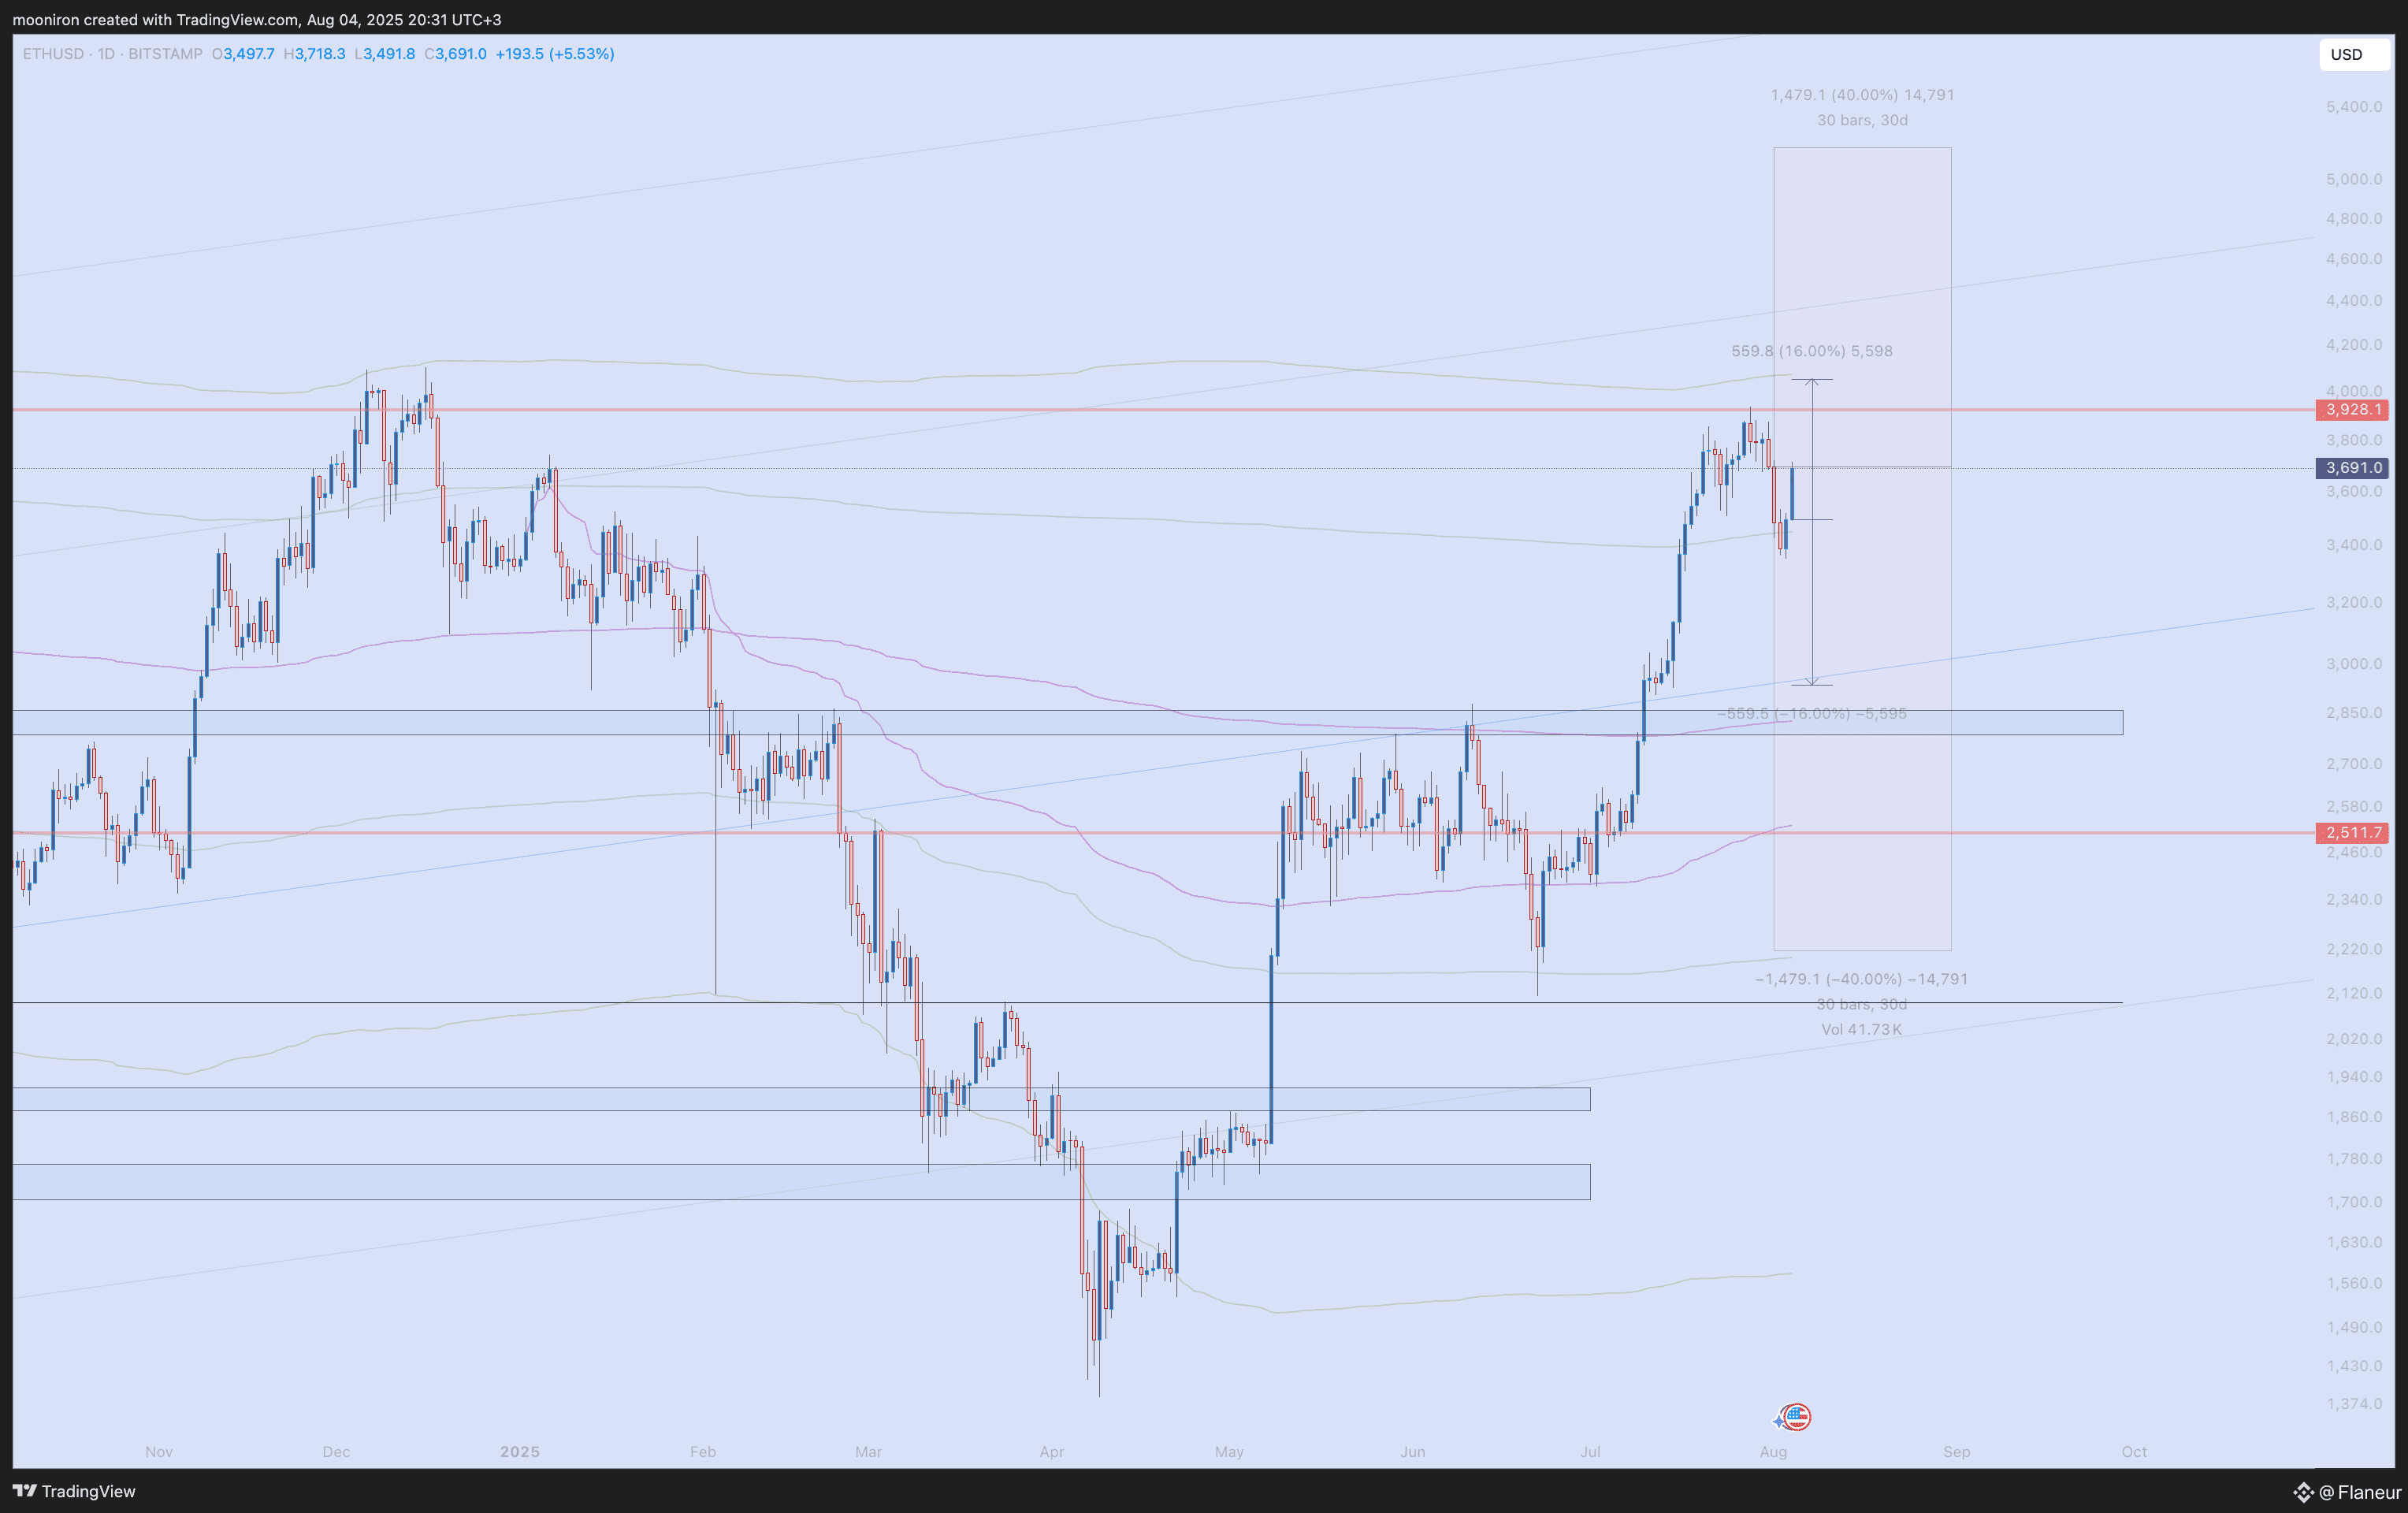
After this sharp rise, two scenarios stand out for August: First, experiencing some cooling along with BTC and a correction movement toward the $3,000-$3,100 region. Second, taking advantage of BTC's sideways movement and attempting new peaks with money flowing to altcoins. My expectation is that prices will move more sideways and correctively throughout the month, with potential activity concentrating toward the end of the month.
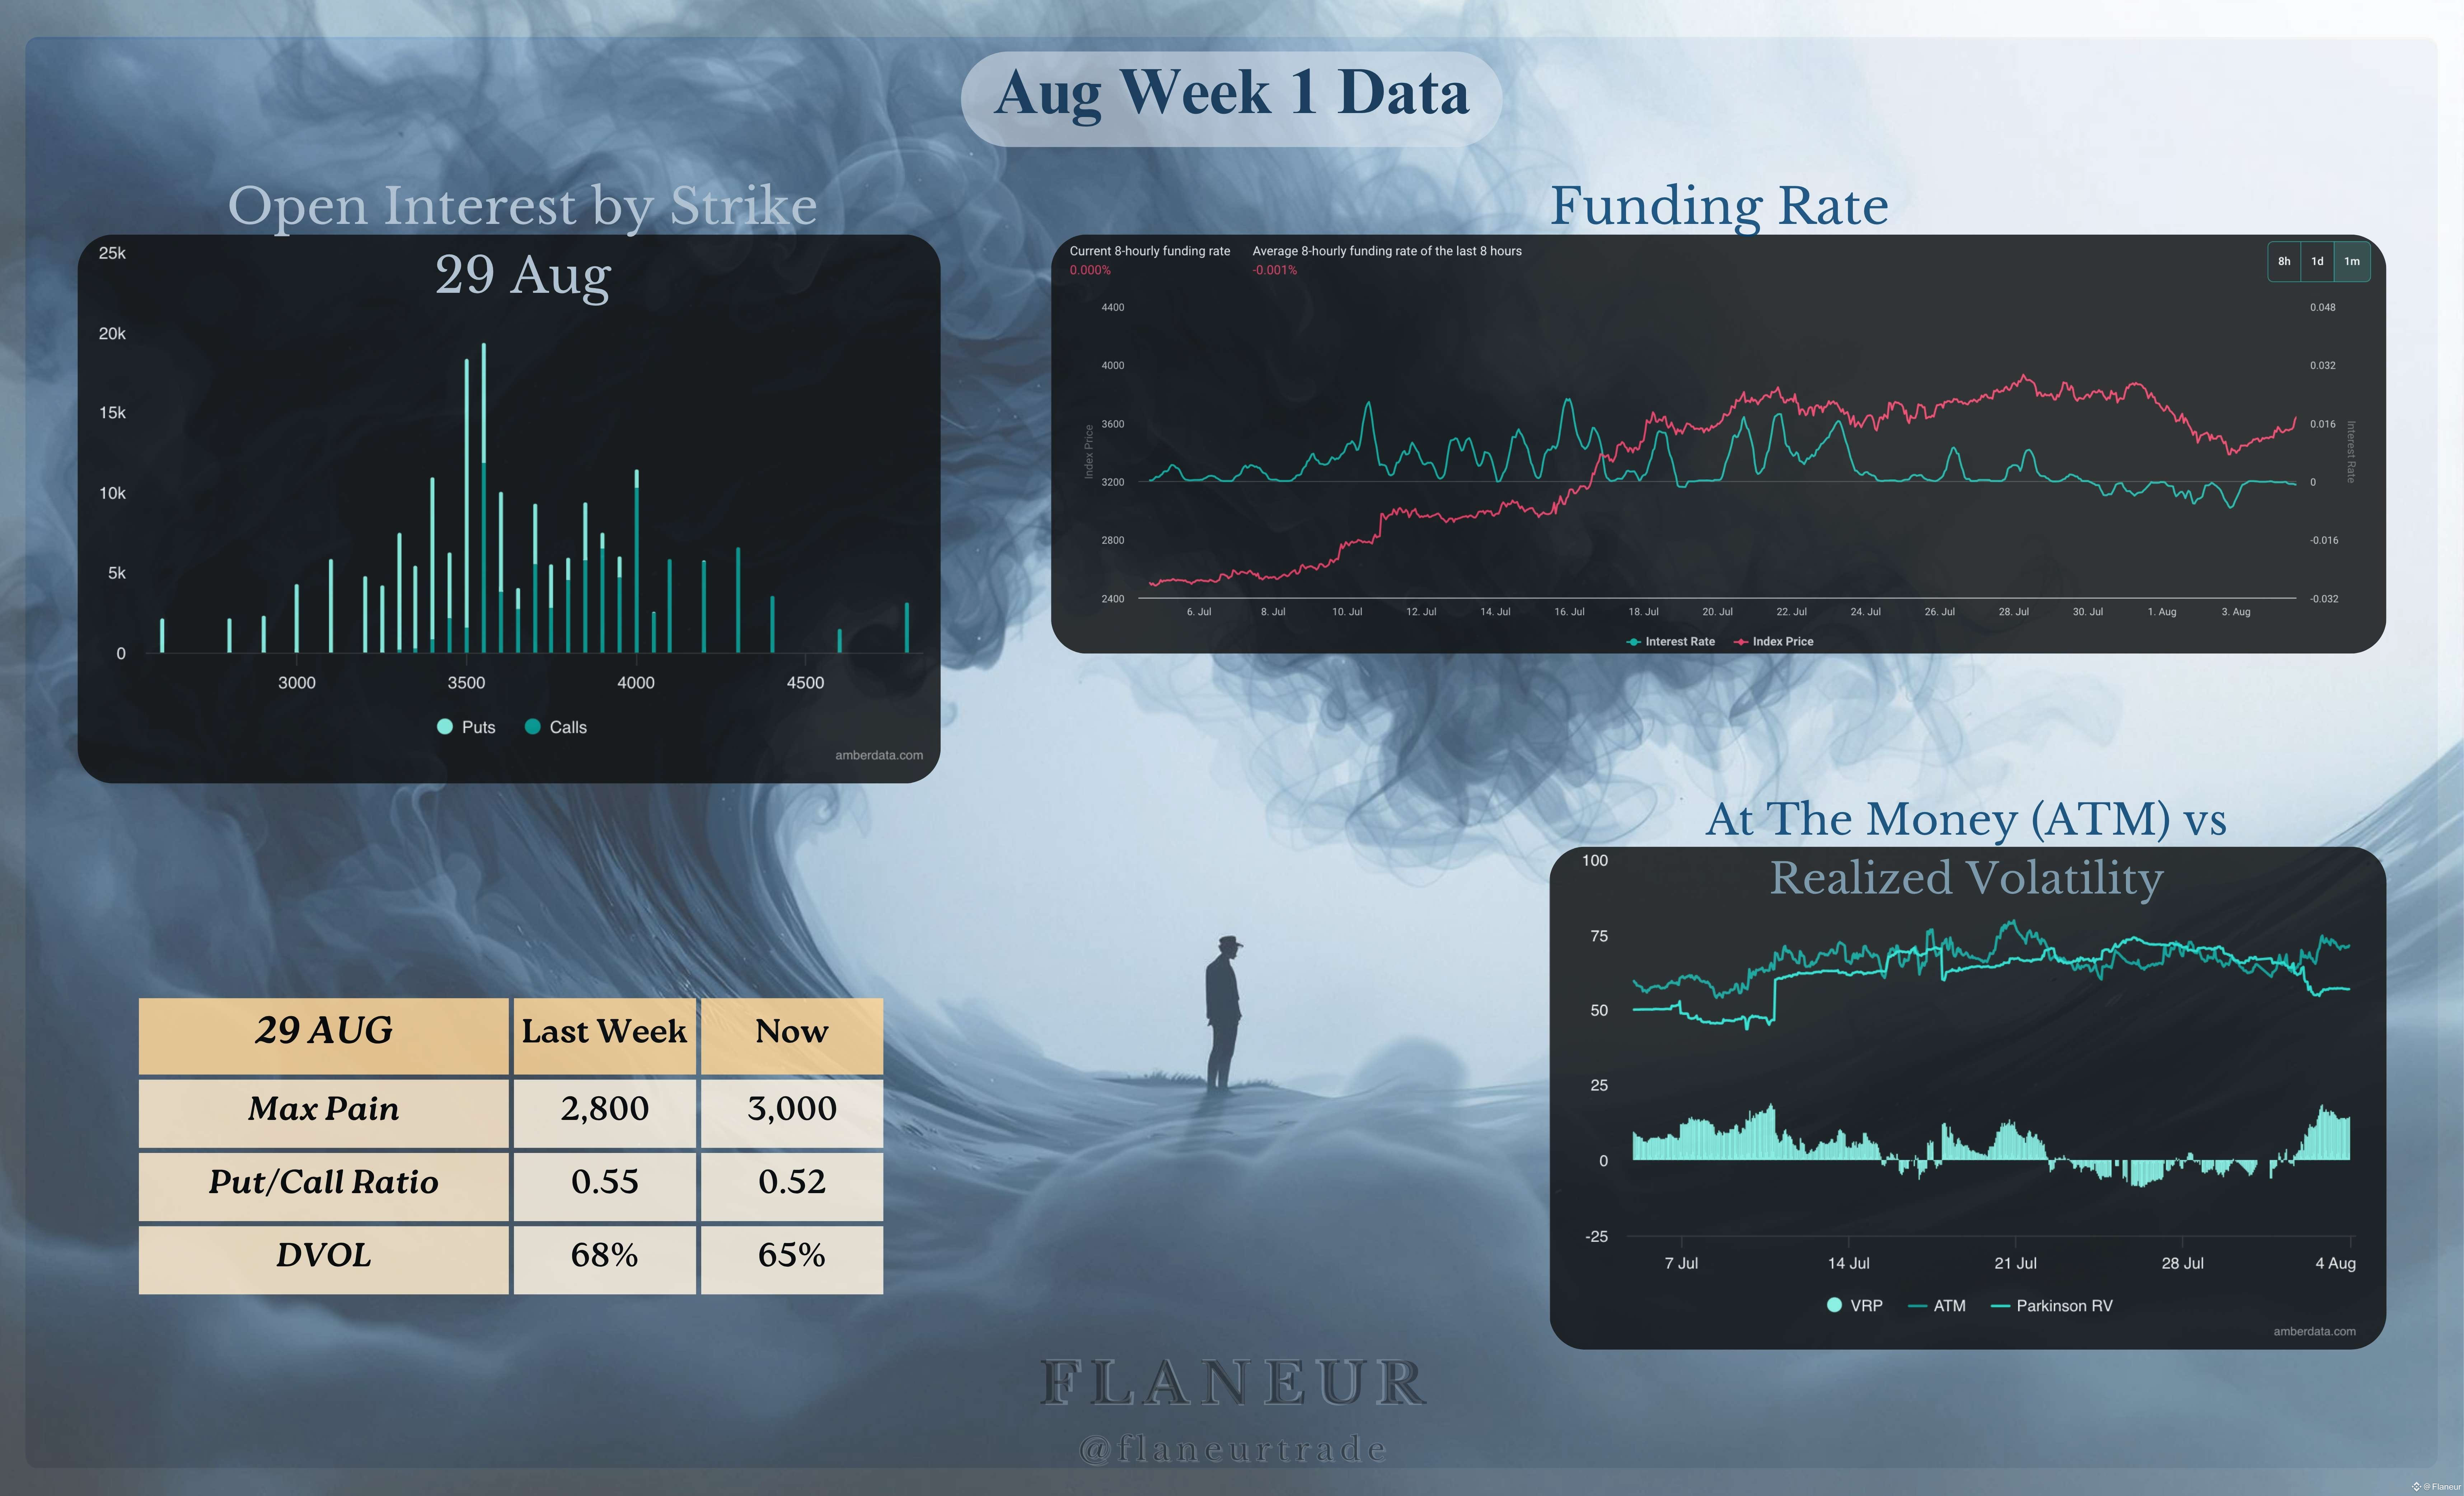
Options market and other data are as follows:
Max Pain: For August 29 expiry contracts, Max Pain price is at $3,000, an important support level
Put/Call Ratio: At 0.52, this ratio shows that bullish expectations for ETH are stronger compared to BTC and the market is quite optimistic
DVOL (Derivative Volatility): Though declining from 68% to 65%, it's still at a very high level compared to BTC. This shows the options market keeps volatility expectations alive for ETH, though there's some general pullback.
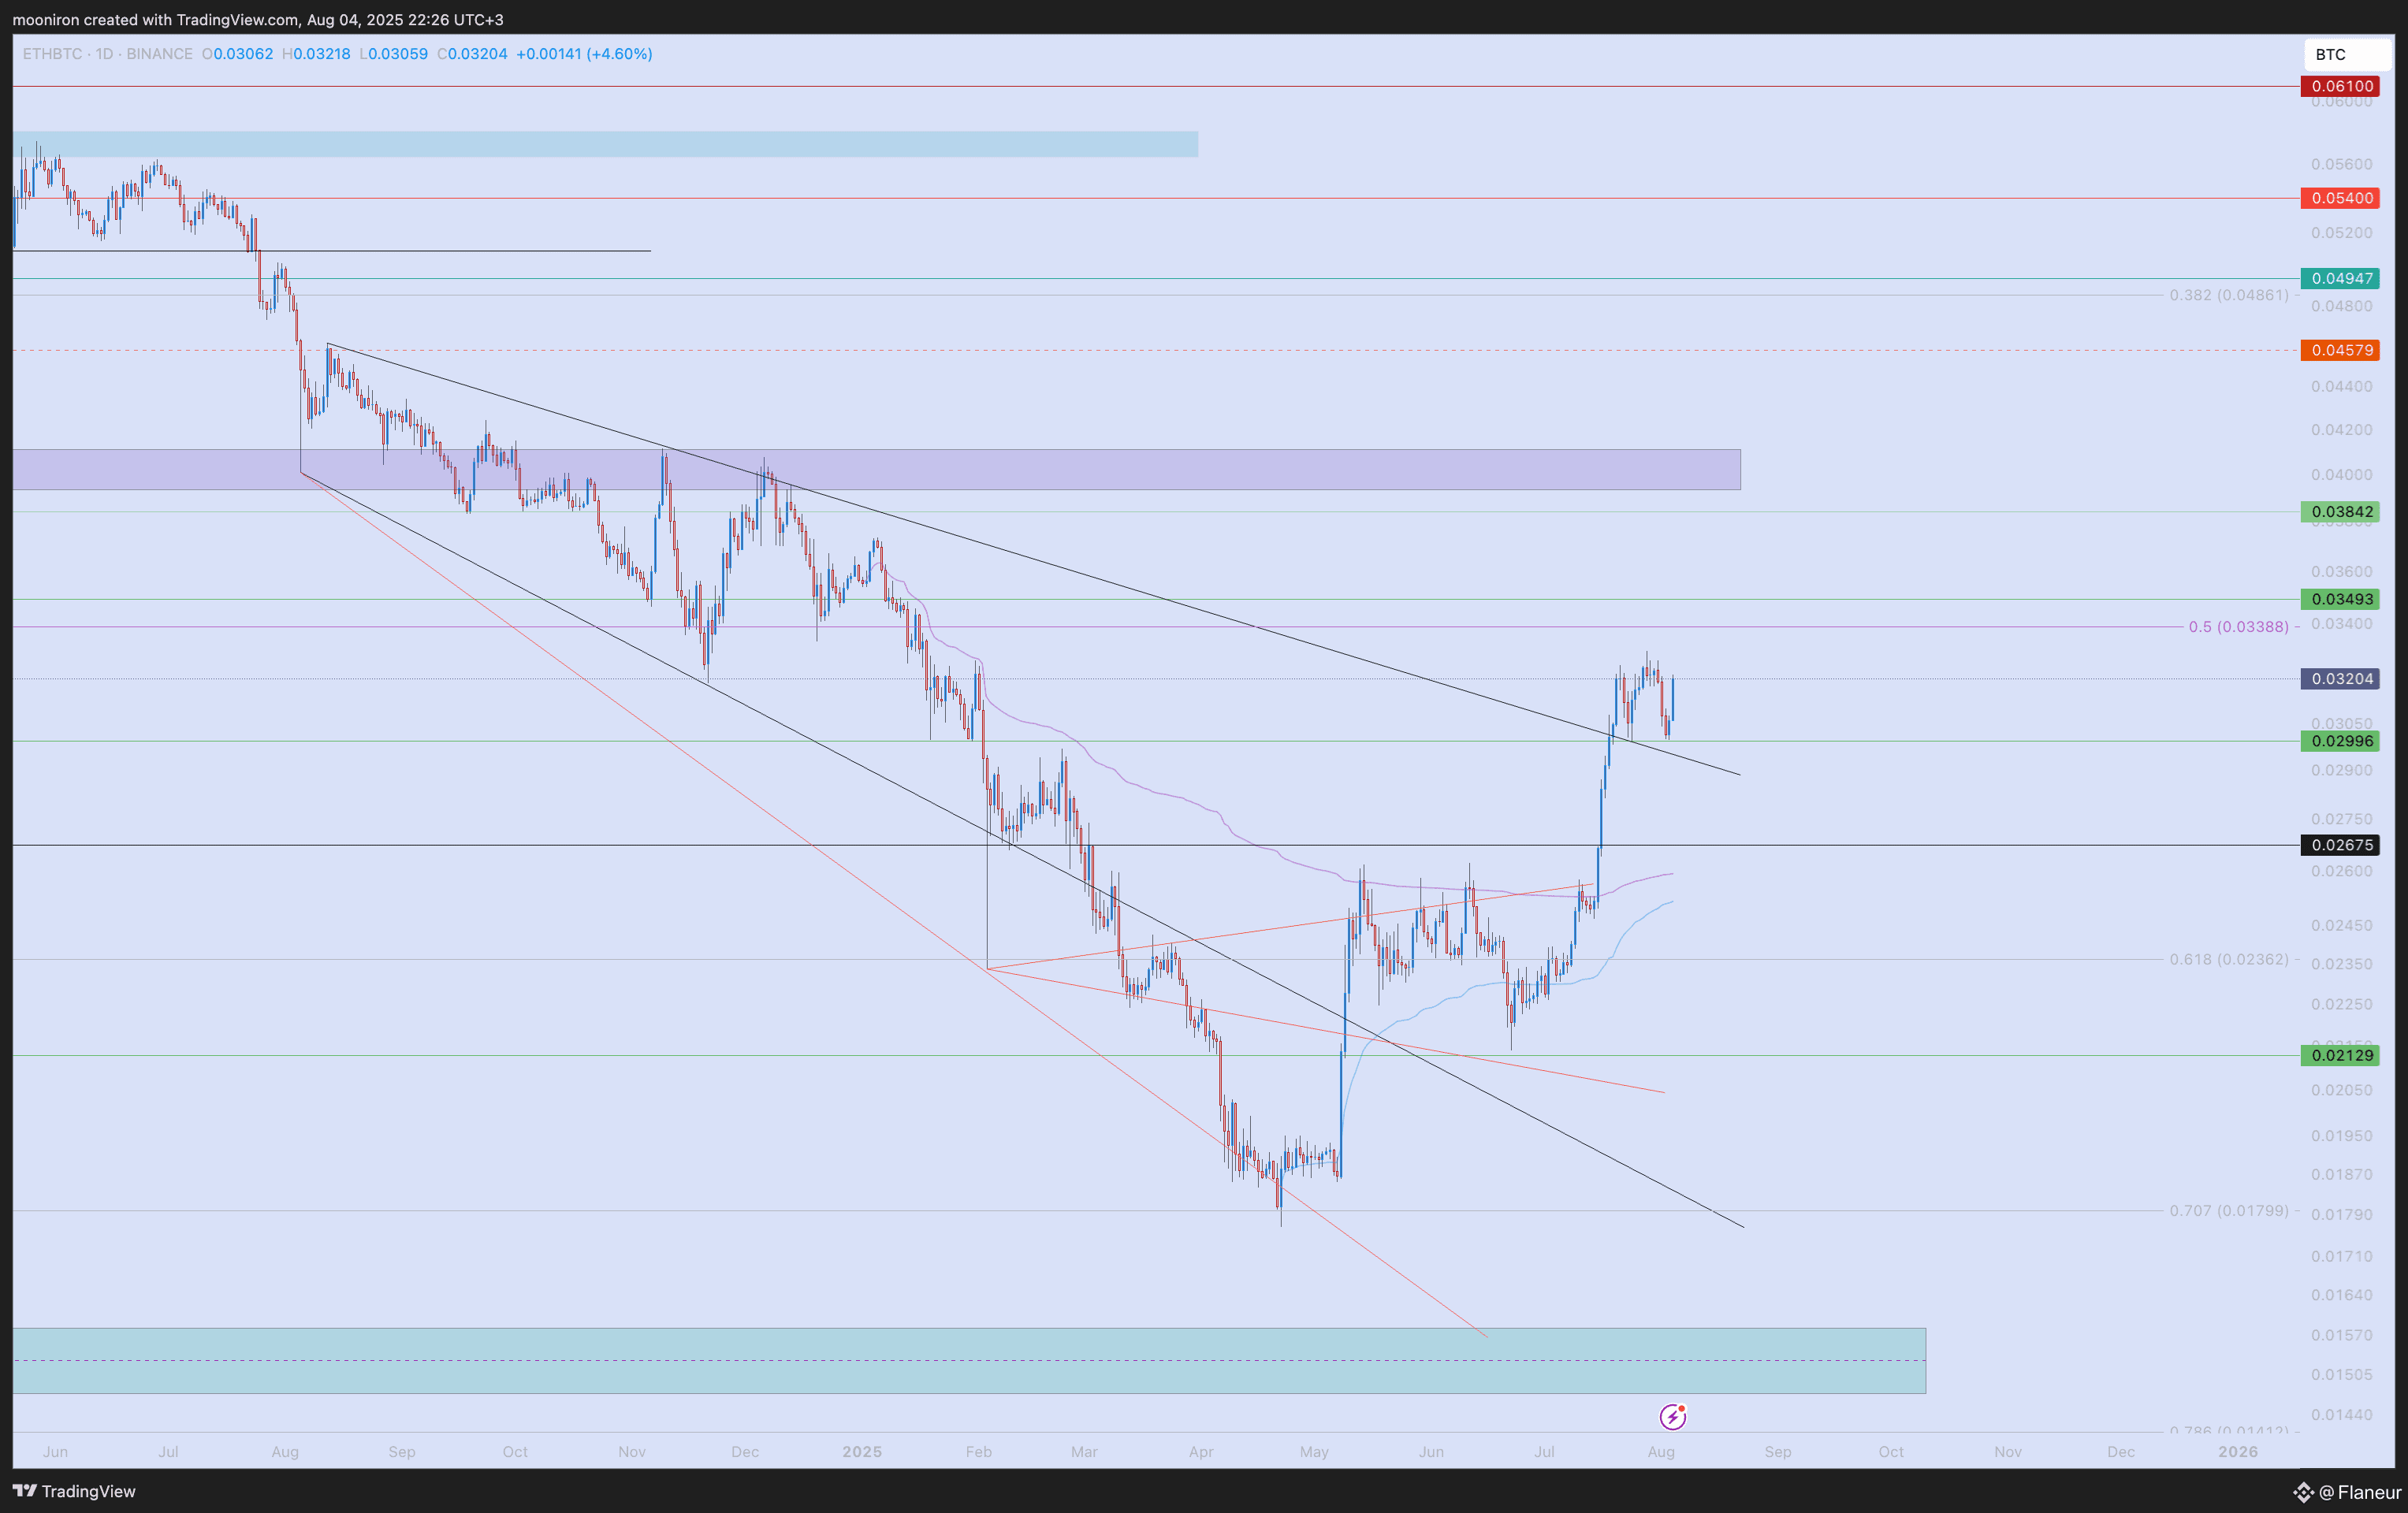
ETHBTC
Experienced a pullback from 0.033 to 0.03 and found good support here, but I don't think it has the strength to make new peaks. I think it wouldn't be wrong to expect some pullbacks. I think the 0.026-28 region is a very good area for buying.
DVOL and the Emerging Calm Before the Storm
DVOL, the implied volatility index for cryptocurrencies, gives us a very important signal about the market's mood. Similar to the VIX index in traditional markets, DVOL measures options market players' expectations for future price movements.
BTC's DVOL index is moving at near-historic lows (37%). This shows the market is in excessive complacency and doesn't expect major price fluctuations in the near future. However, financial market history has taught us this: Extremely low volatility is usually a harbinger of extremely high volatility to come. The market is like a compressed spring. When it moves sideways for so long and volatility drops this much, the first break (upward or downward) is usually very sharp and explosive. While it's difficult to predict direction, this whispers that we need to be prepared for a sharp trend beginning in the coming weeks. Also, the biggest advantage of such low volatility is the cheapening of option contracts. As volatility expectations drop, contracts also become cheaper, giving you access to cheaper purchases.
Conclusion
In markets that closed July strongly, August appears to be a month of direction-seeking and finding balance. The historically low volatility observed in BTC resembles the calm before a major storm, while ETH maintains more dynamic and optimistic expectations. Macroeconomic data during the month, especially CPI and messages from the Jackson Hole Symposium, could be triggers that break the market's silence. While options data paint cautiously optimistic expectations on one hand, the "calm before the storm" image created by DVOL on the other shows we need to be prepared for a sharp movement that could happen in any direction at any moment. We'll closely follow developments.
#TrumpTariffs #WhiteHouseDigitalAssetReport #BTCReserveStrategy #EthereumTurns10 #OptionsTrading