Hey everyone. I waited until today to share the weekly and monthly analysis together. With the weekly close yesterday and the new monthly open today, we're leaving Q2 behind and kicking off Q3, a new quarter packed with critical data and events for the crypto markets. After the general stagnation in June, July looks set to be an intense month, both in terms of the macroeconomic calendar and internal market dynamics. Let's dive into what's ahead.
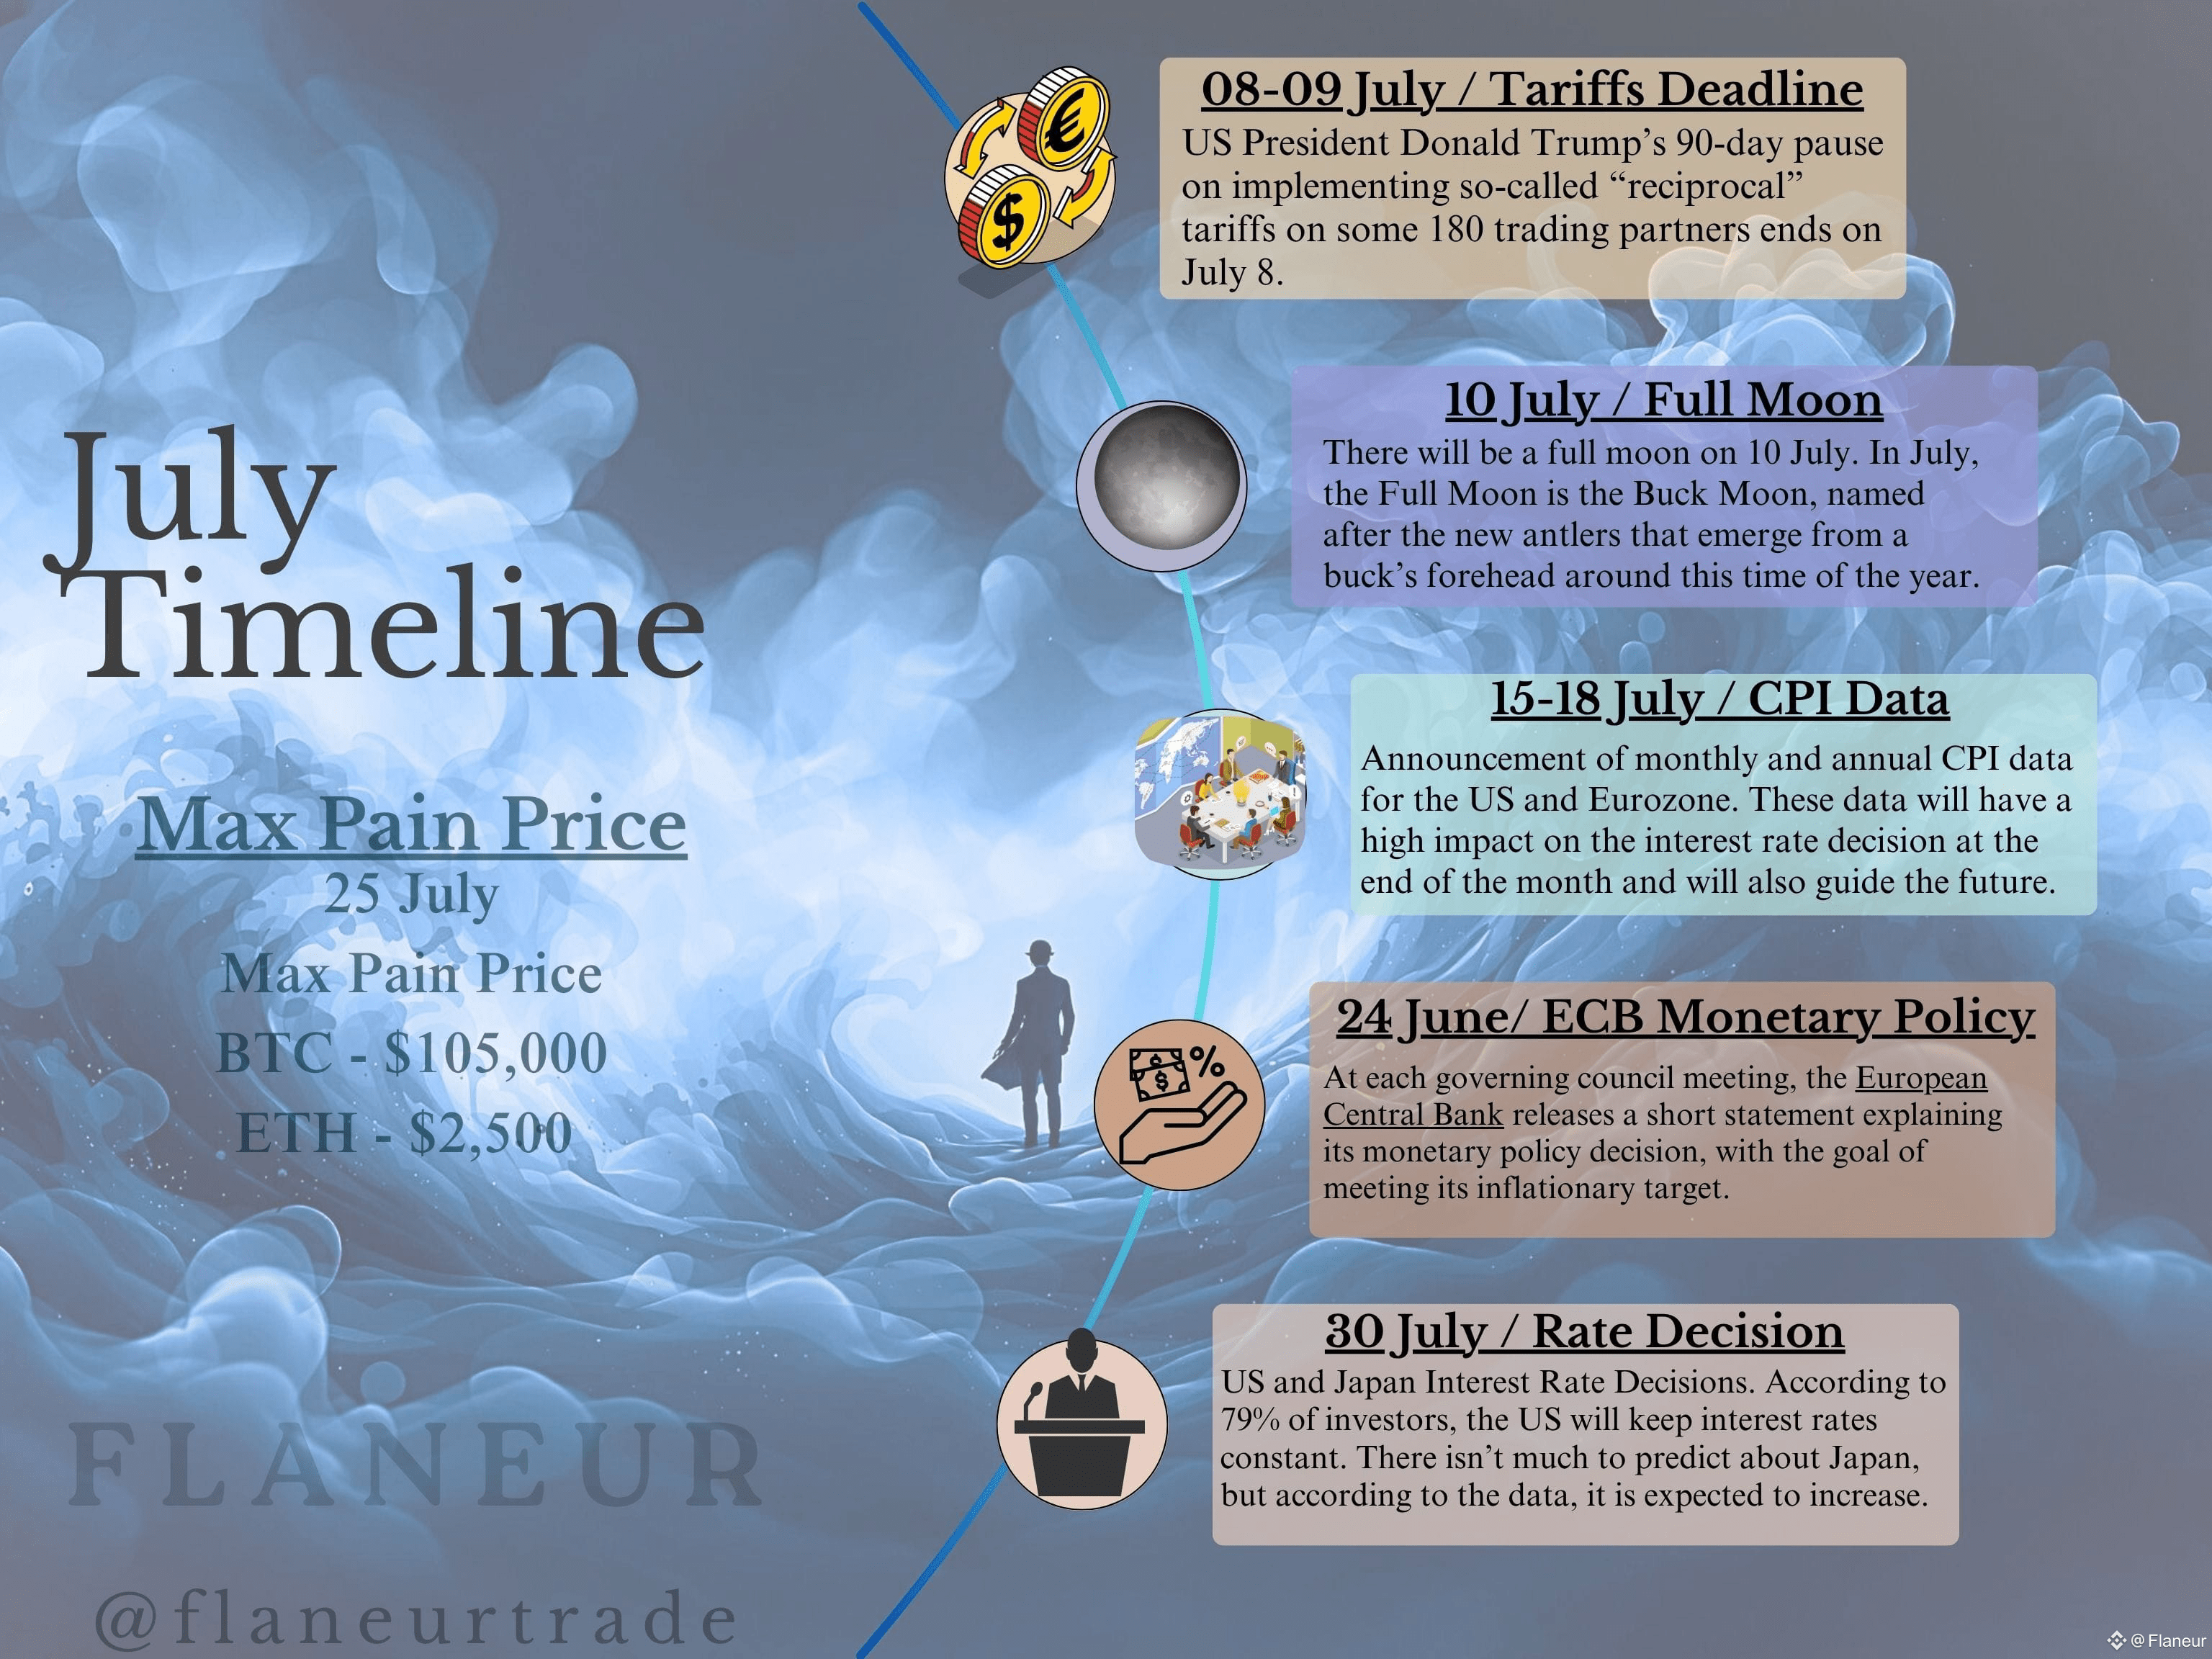
Right at the start of the month, on July 8-9, the US's 90-day pause on implementing so-called "reciprocal" tariffs on 180 trading partners comes to an end. This could create some tension in global markets. The US and Eurozone CPI data, to be released between July 15-18, will be one of the month's most critical events, directly influencing future interest rate decisions by central banks. At the end of the month, on July 30, we'll be watching the interest rate decisions from the US and Japan. An expected rate hike from Japan, in particular, could unleash a new wave of volatility in the markets.
I continue to incorporate historical volatility tables into my analysis. These tables provide a general framework, especially when positioning at the beginning of the month. I'll use this data for my positions across different timeframes. I'll specifically use the daily volatility data for leveraged trades and short-term option positions ahead of major news events.
Bitcoin (BTC)
BTC had a relatively calm June with a total volatility of 11%, failing to break its previous all-time high (ATH). Despite this, closing Q2 with a 30% gain shows that its medium-term strength remains intact.
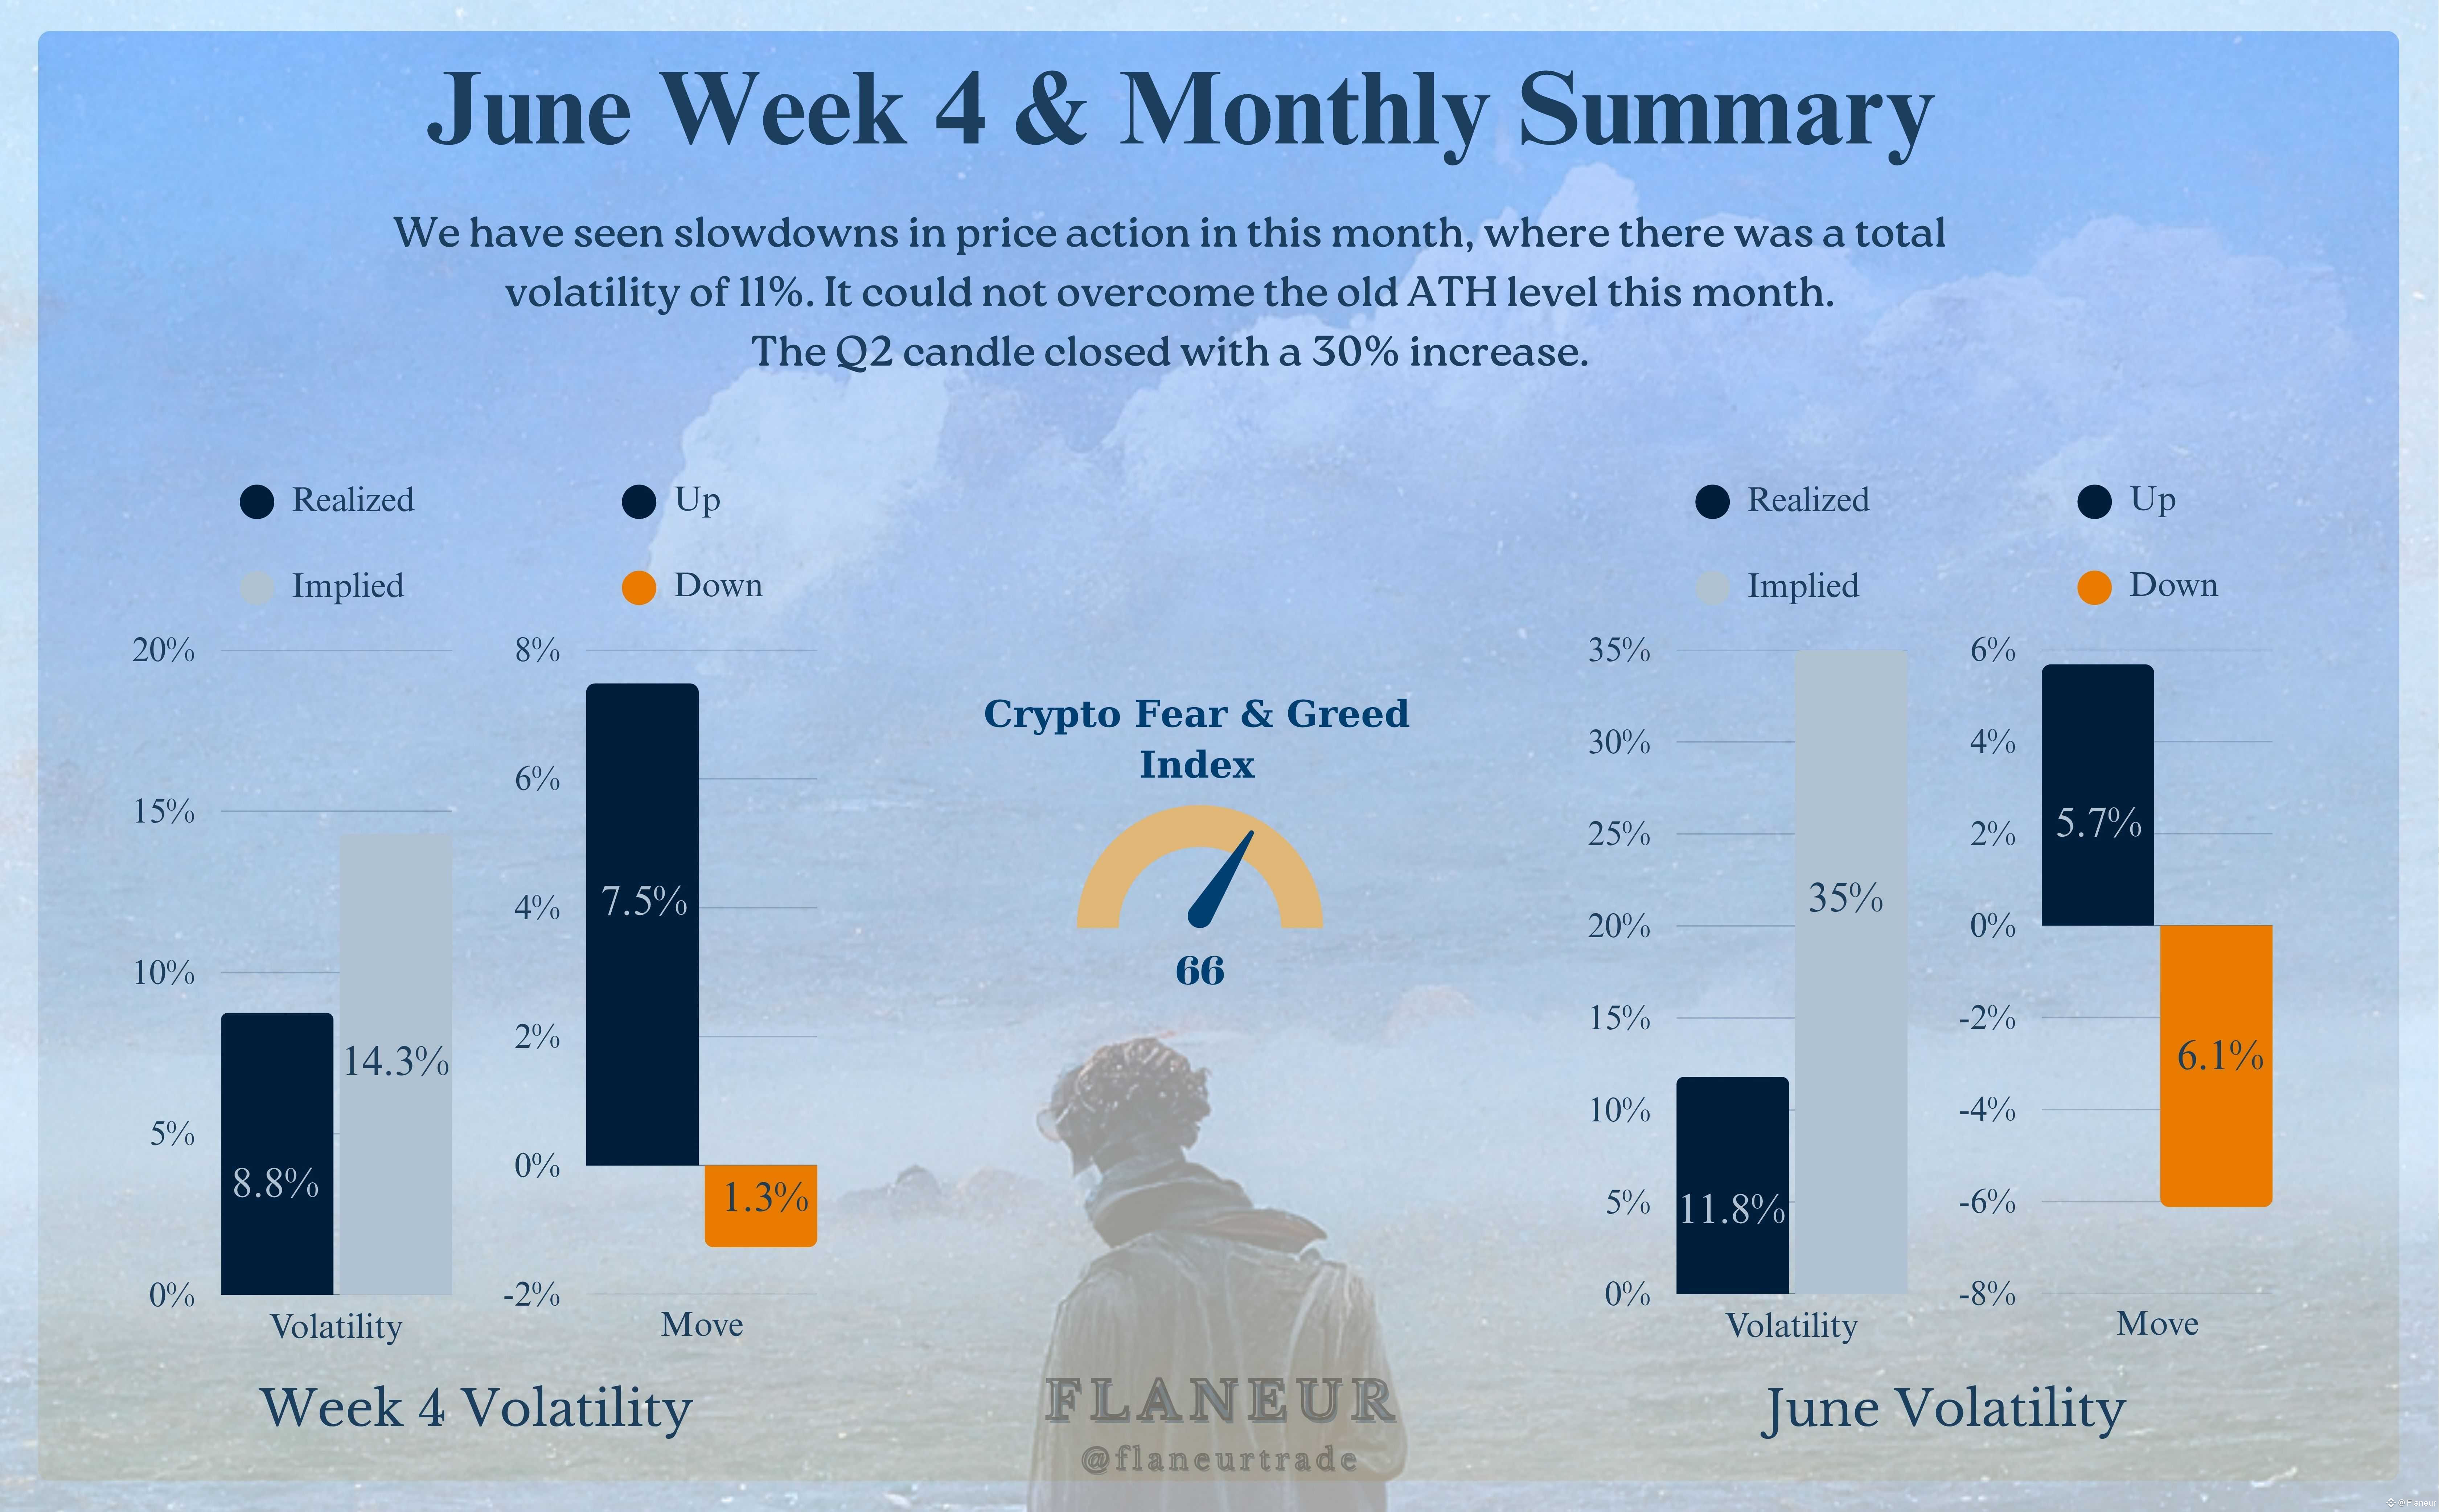
For July, the historical average monthly volatility is around 28.5%. Historically, July has closed in the red four times with losses between 5-10%, but it usually closes green with gains above 10%, often between 10-20%. The general market sentiment, with the Crypto Fear & Greed Index at 66, is on the "Greed" side. However, the slowdown in price action points to some indecision.
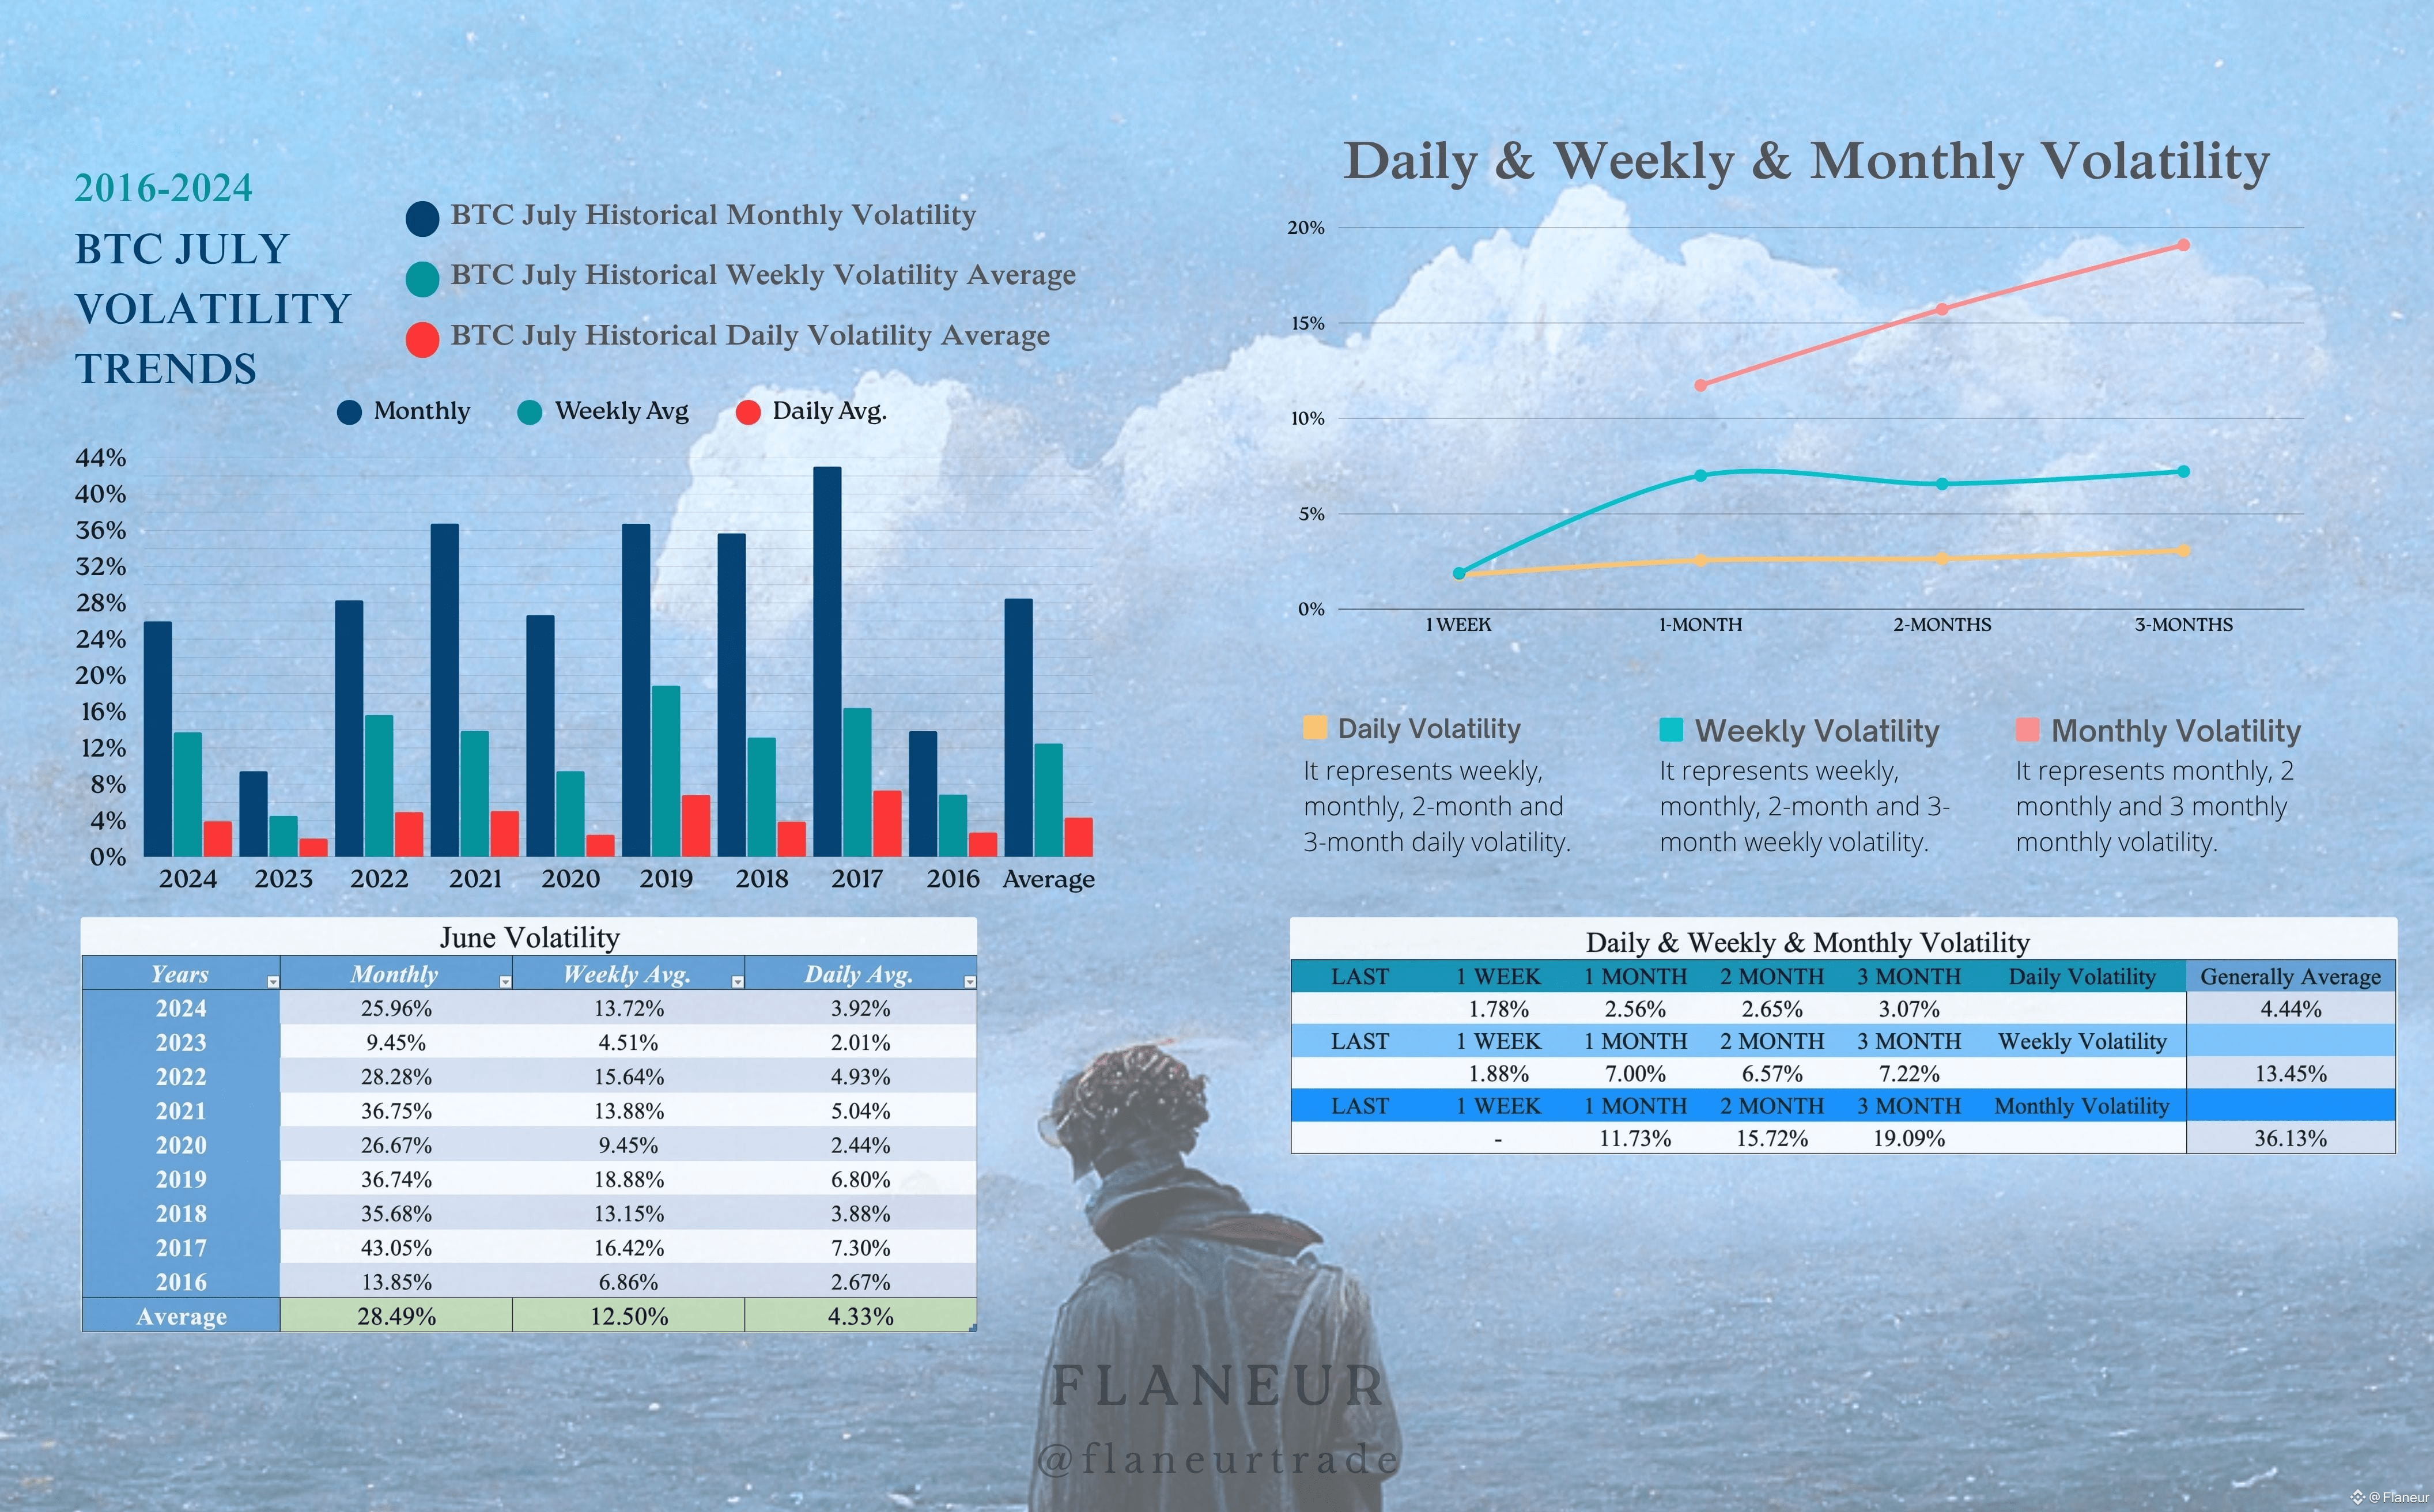
The monthly implied volatility of 28.5% gives us a price range of $76.5k - $138k, while the weekly implied volatility of 12.5% points to a range of $95k - $122k. We can identify the $103k-$104k area as this month's pivot zone, and the $97k-$98k area as the pivot for Q3.
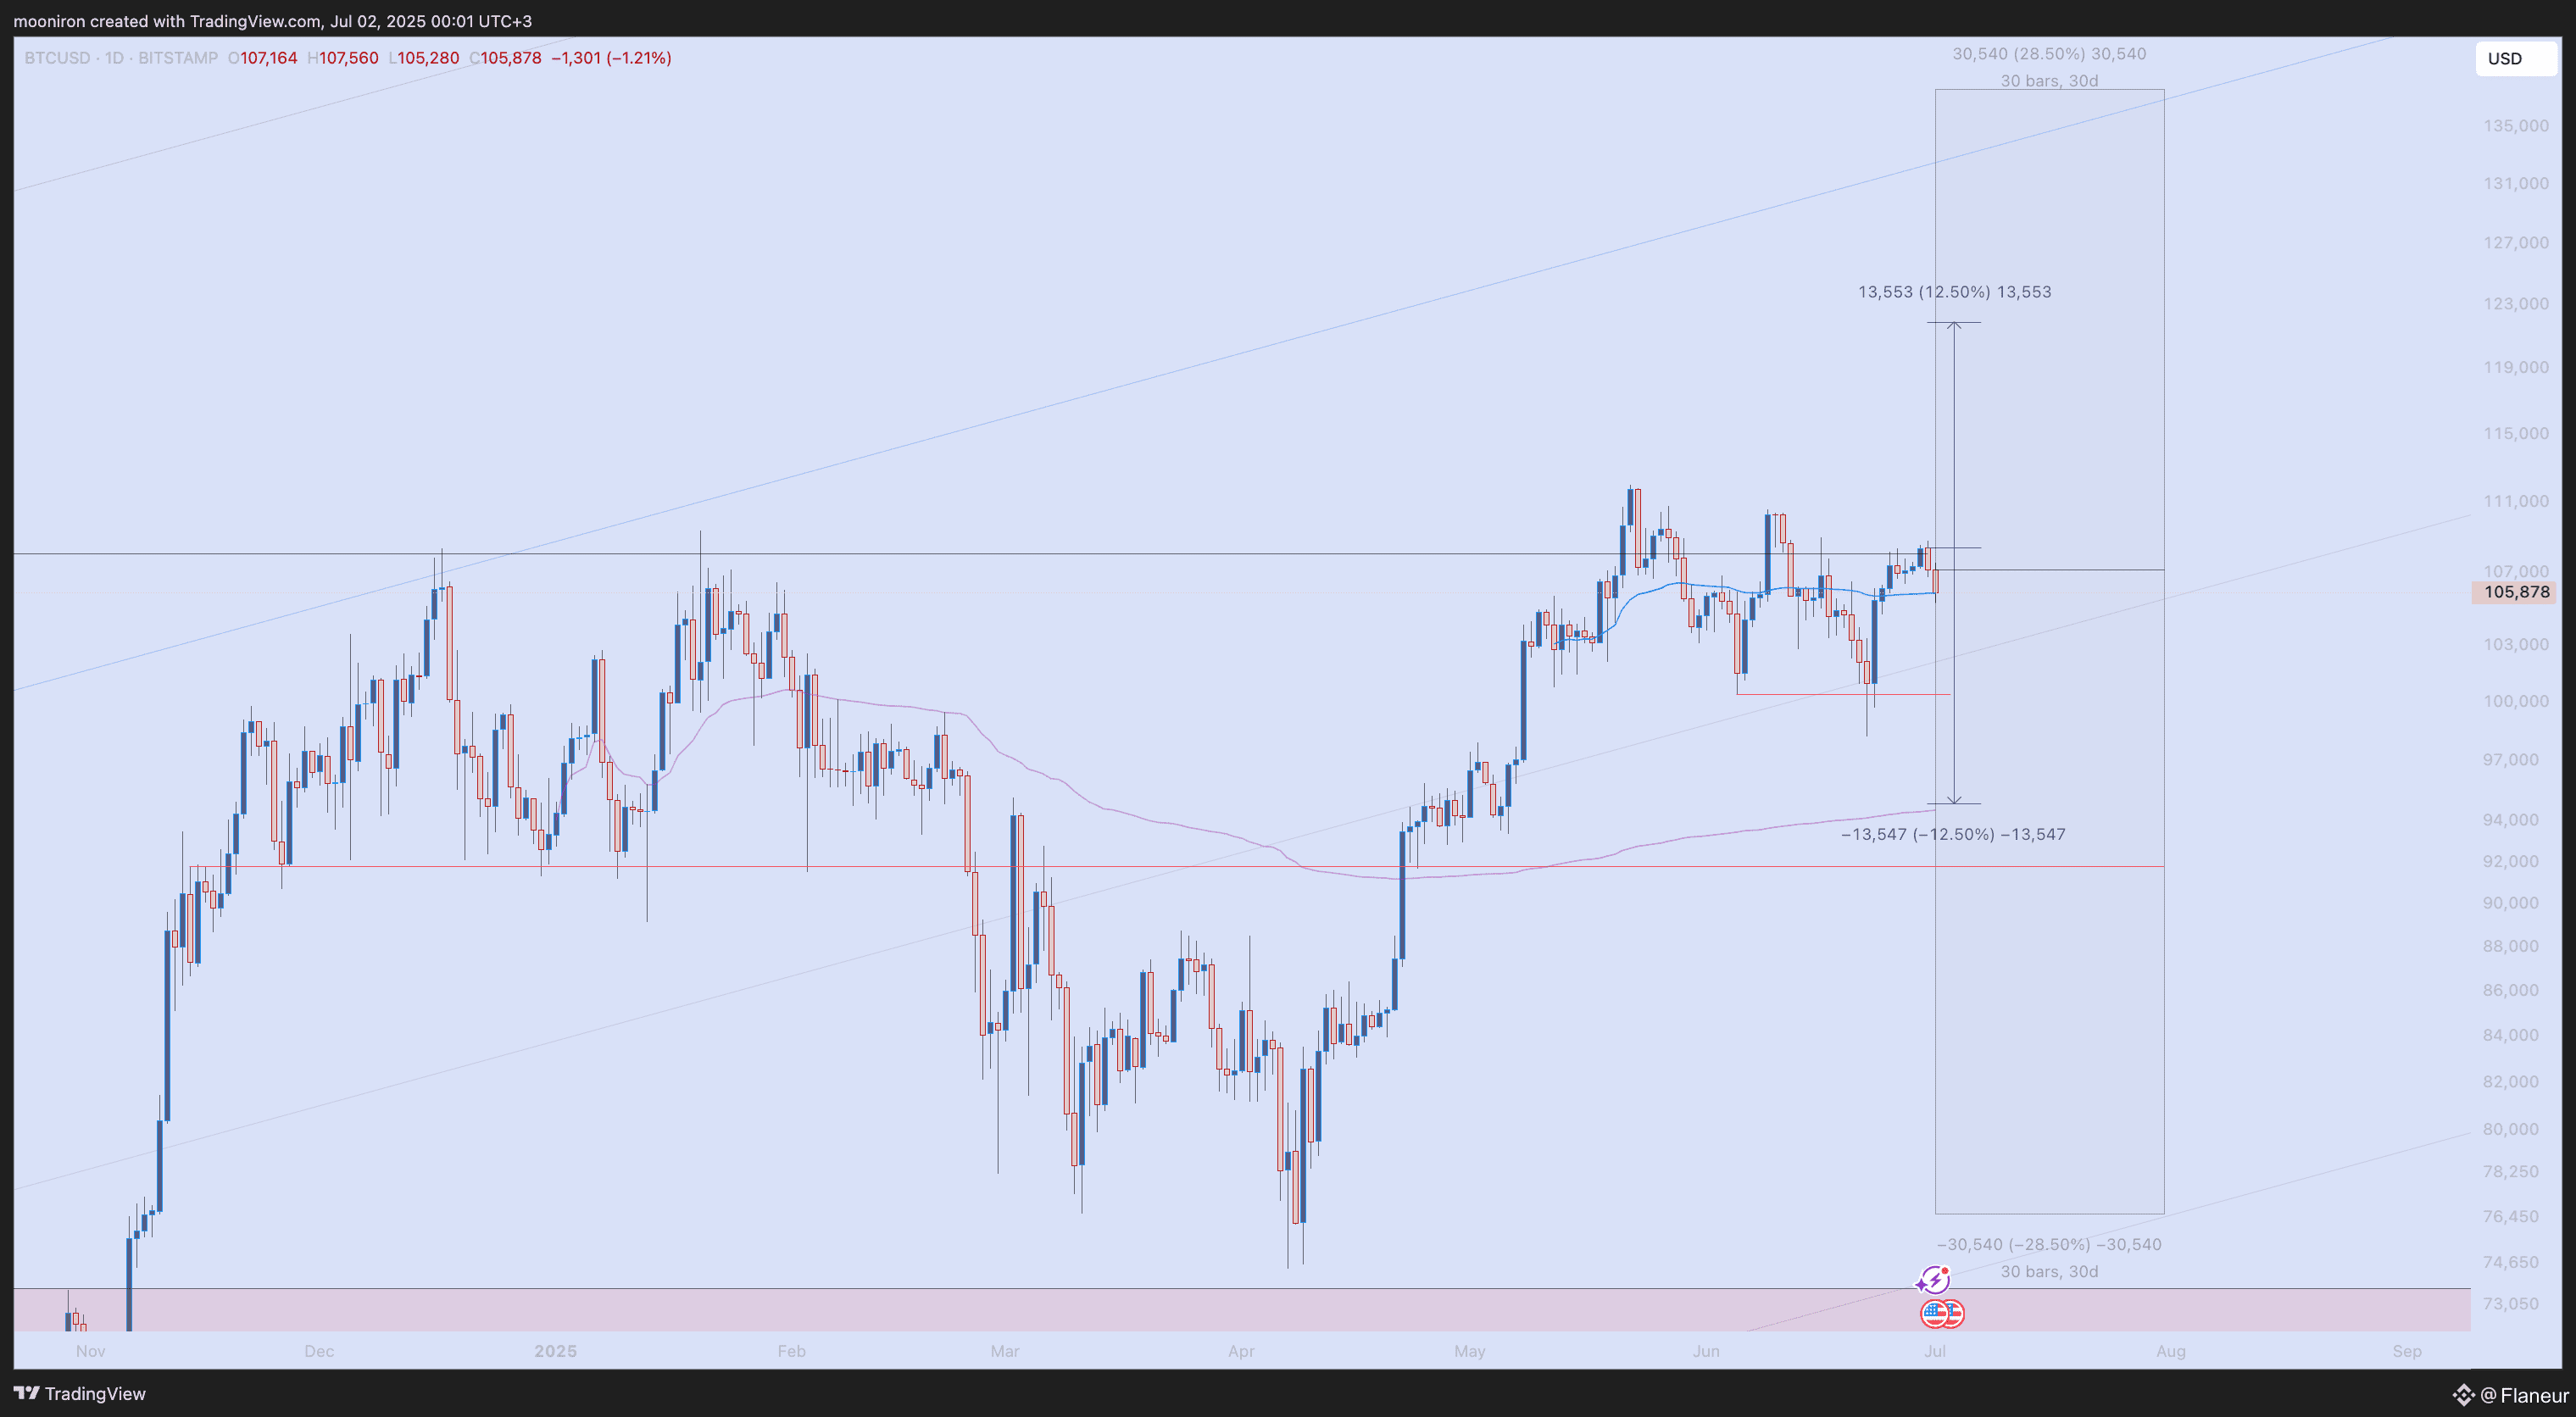
Personally, I don't think BTC has formed a top structure yet, and I believe any downward moves will likely remain as corrections. I see $103k and $99k as significant support levels and plan to open long positions on pullbacks to these areas.
Looking at the options market data:
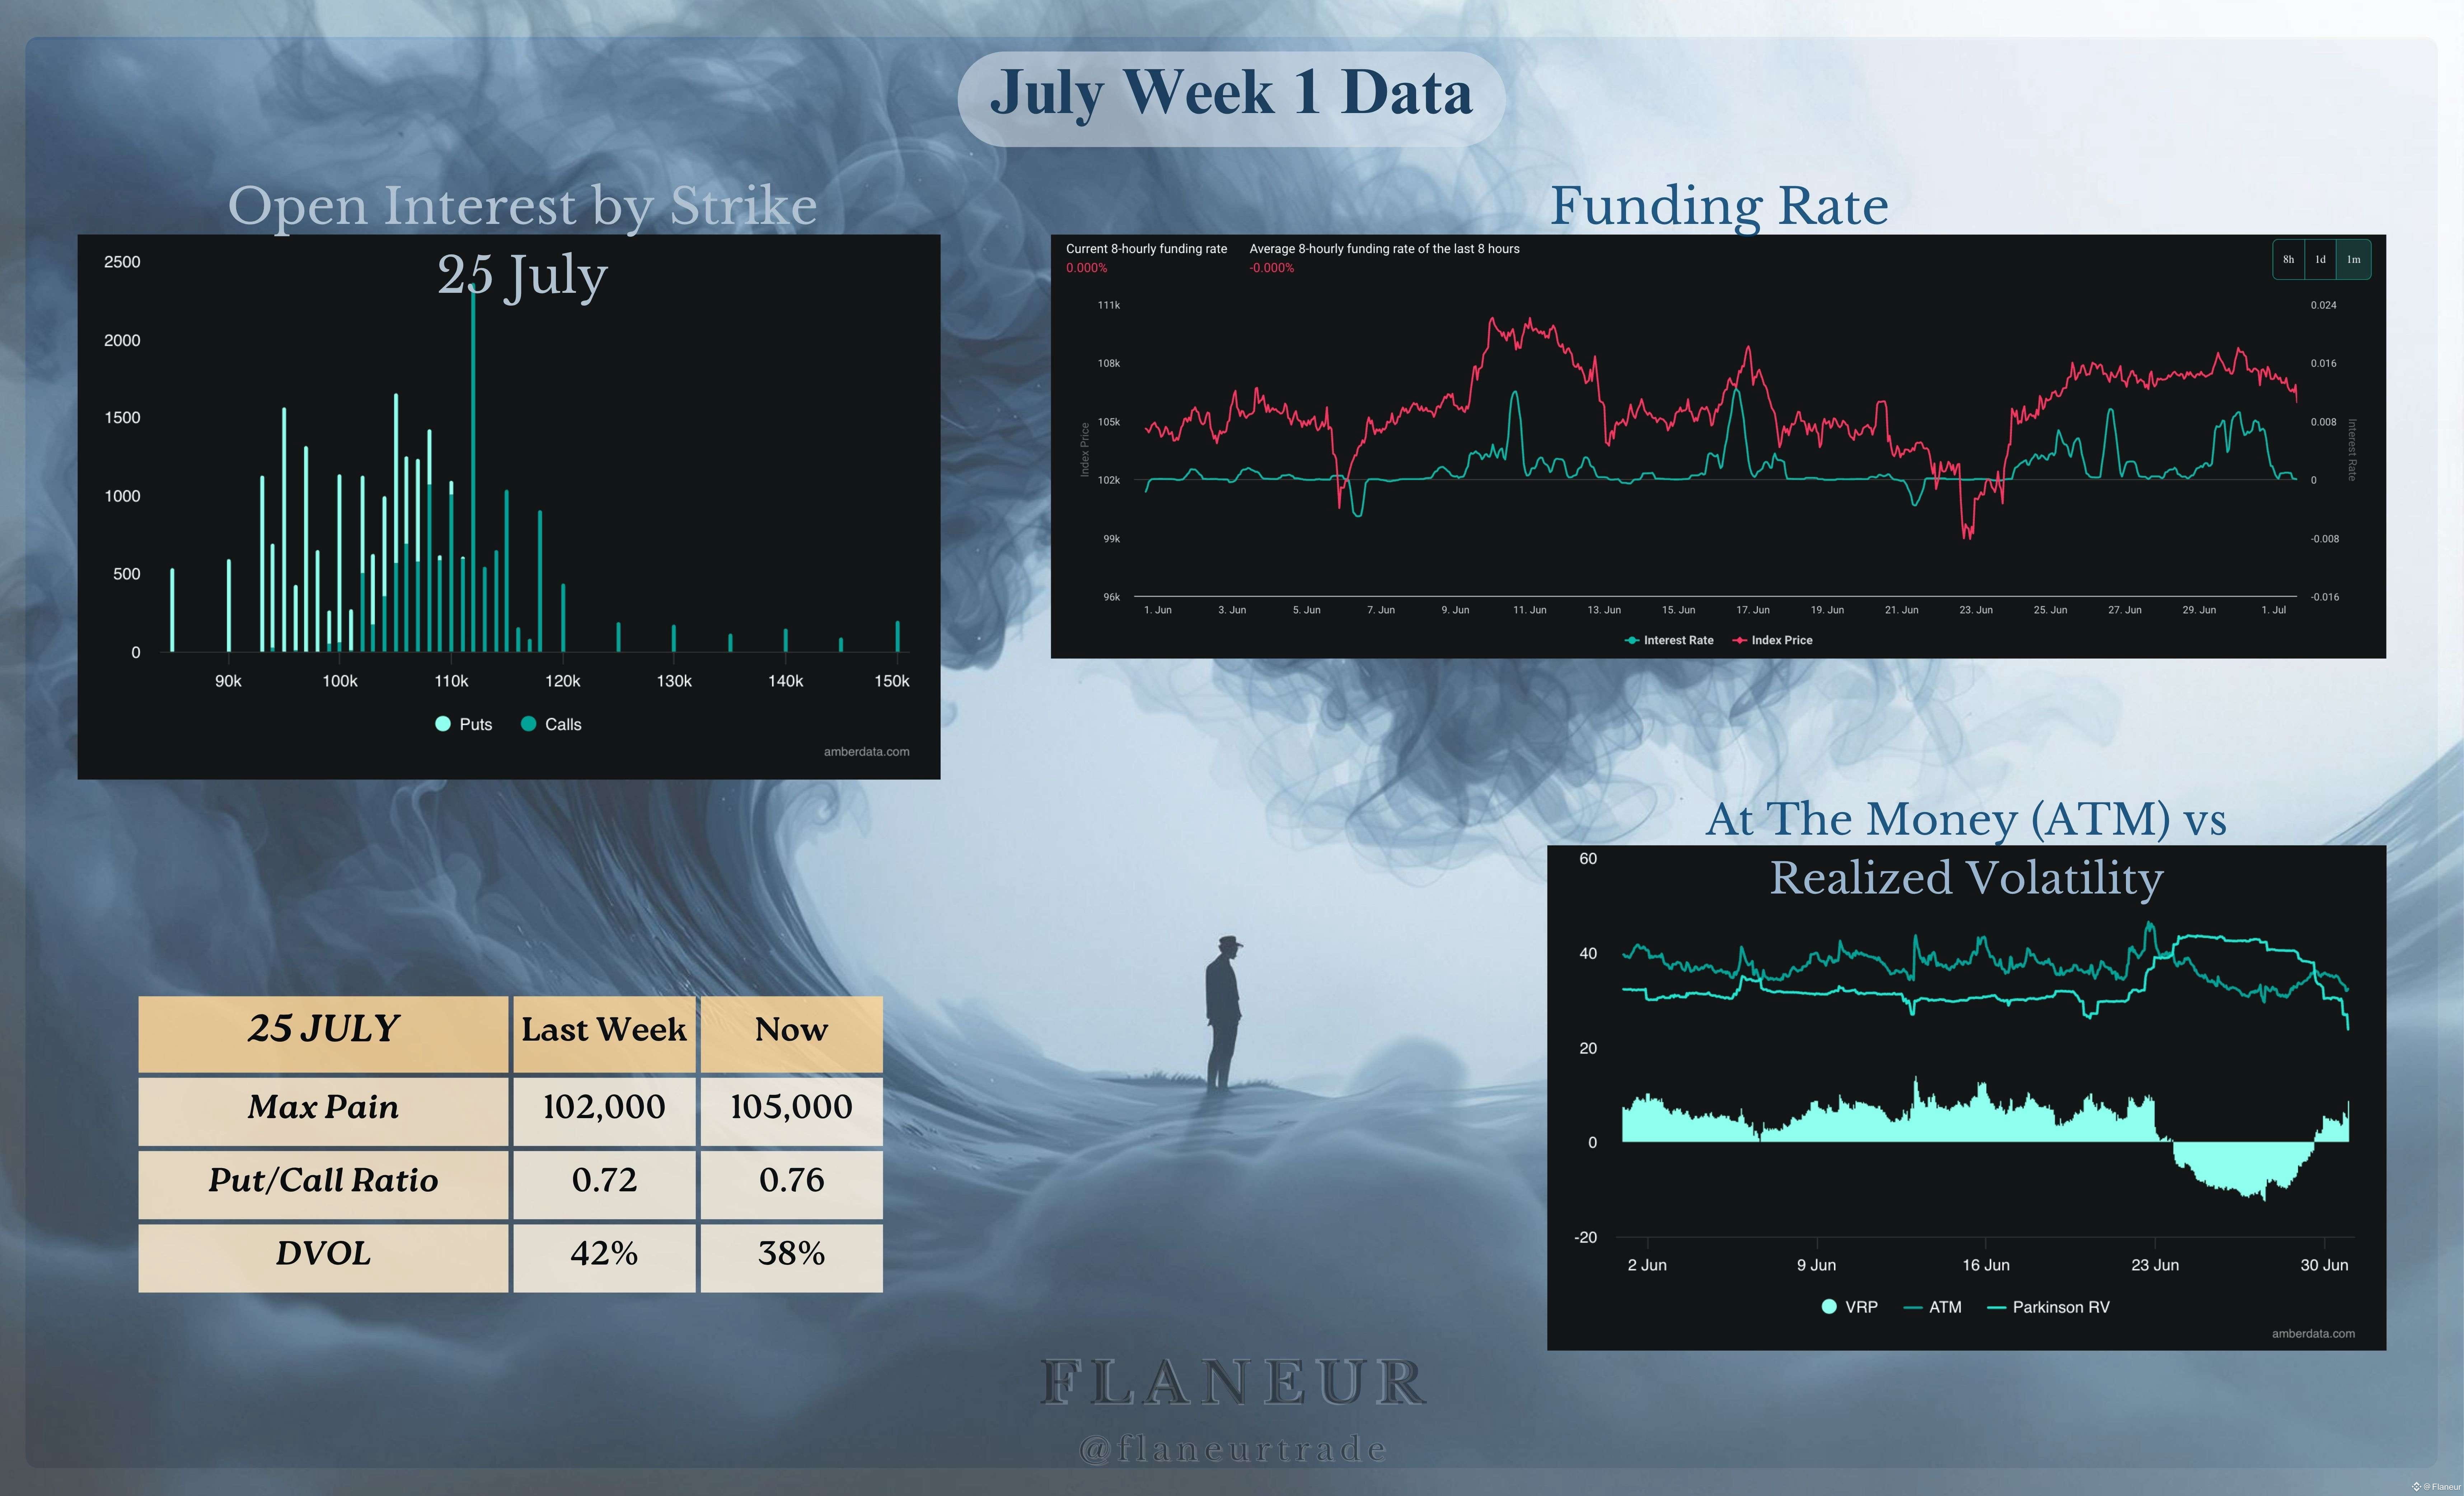
For the July 25 expiry, the Max Pain price has risen from $102,000 last week to $105,000. This suggests the market expects the price to converge around this level at expiration.
The Put/Call Ratio has increased from 0.72 to 0.76, indicating that moderate optimism continues.
DVOL (Derivative Volatility) has dropped from 42% to 38%. While this suggests the expectation of low volatility might continue, I'll touch more on this later.
The Funding Rate is hovering at neutral levels. If the price corrects and the funding rate turns negative, that would be a major buy signal for me.
In the ATM vs. Realized Volatility chart, we see that realized volatility dropped towards the end of June. Although it has recovered from the negative zone with recent ups and downs, it remains subdued. This indicates the market is in a calmer phase but is potentially setting the stage for a sharp move.
Ethereum (ETH)
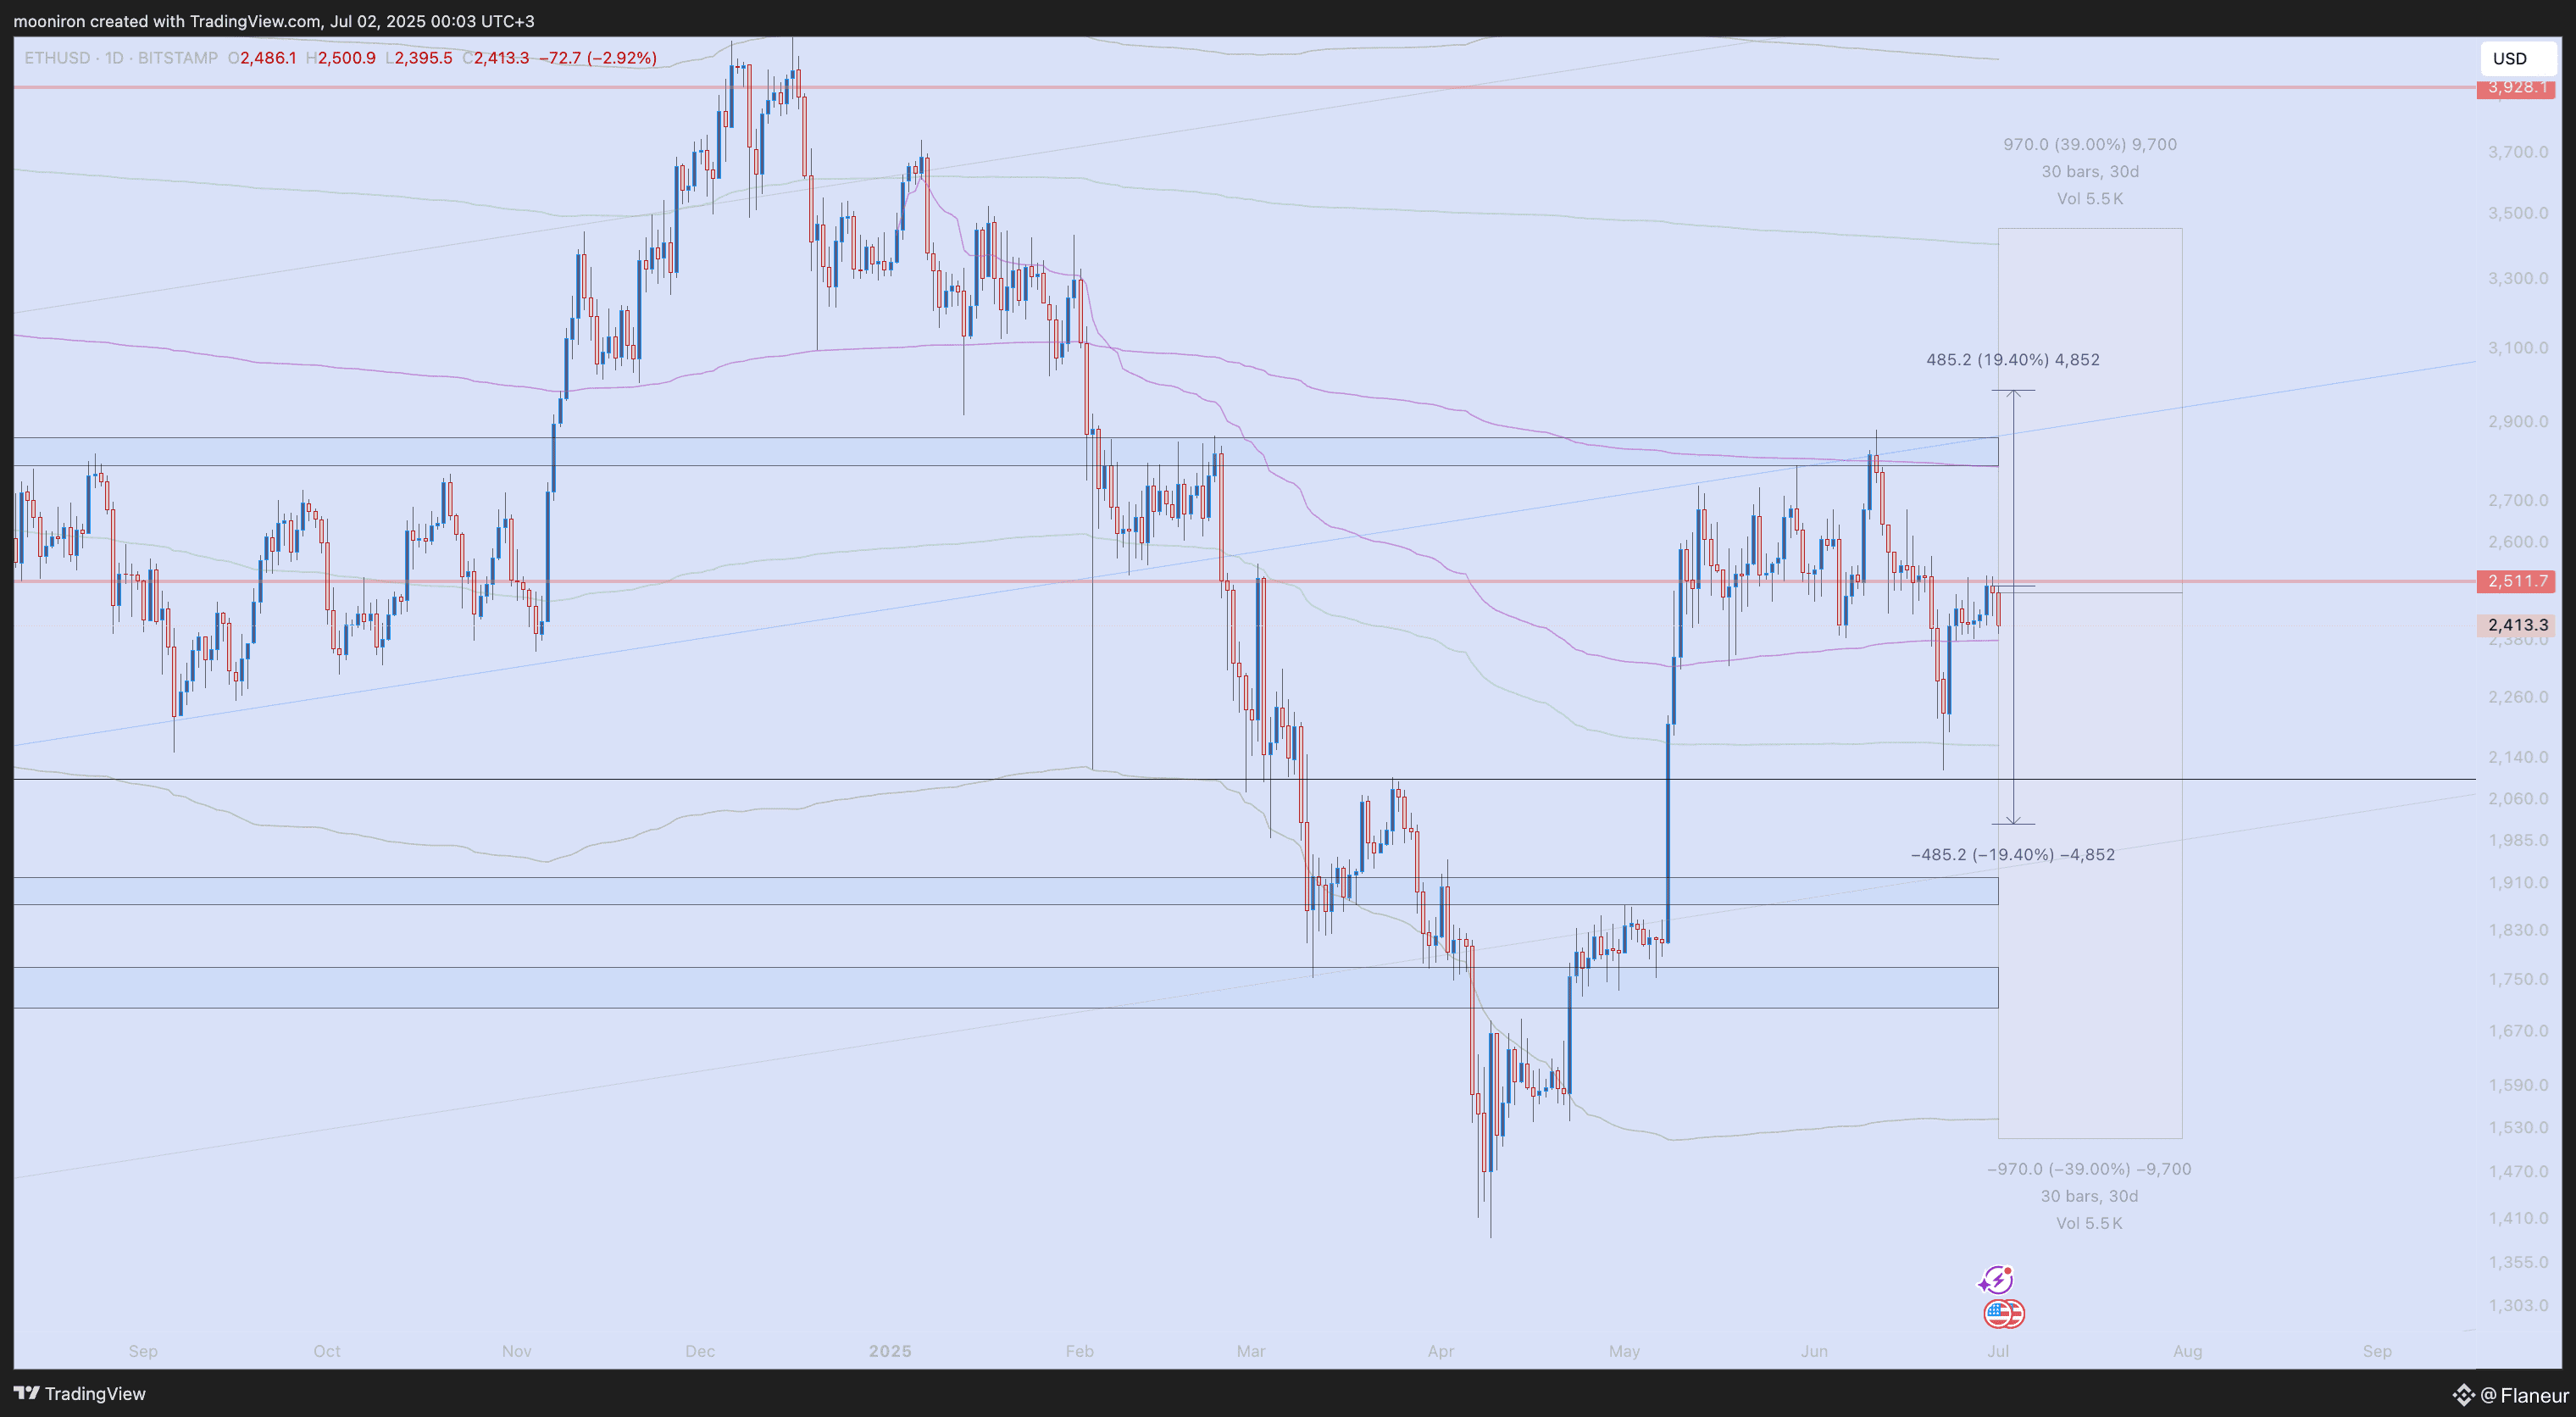
ETH experienced a 13% rise and a 16.3% fall in June, ultimately closing the month with a 3% loss and struggling to break the $2500 zone. However, the Q2 candle, which saw a 24% drop followed by a 58% rally to finally close with a 36% gain, showcases ETH's resilience.
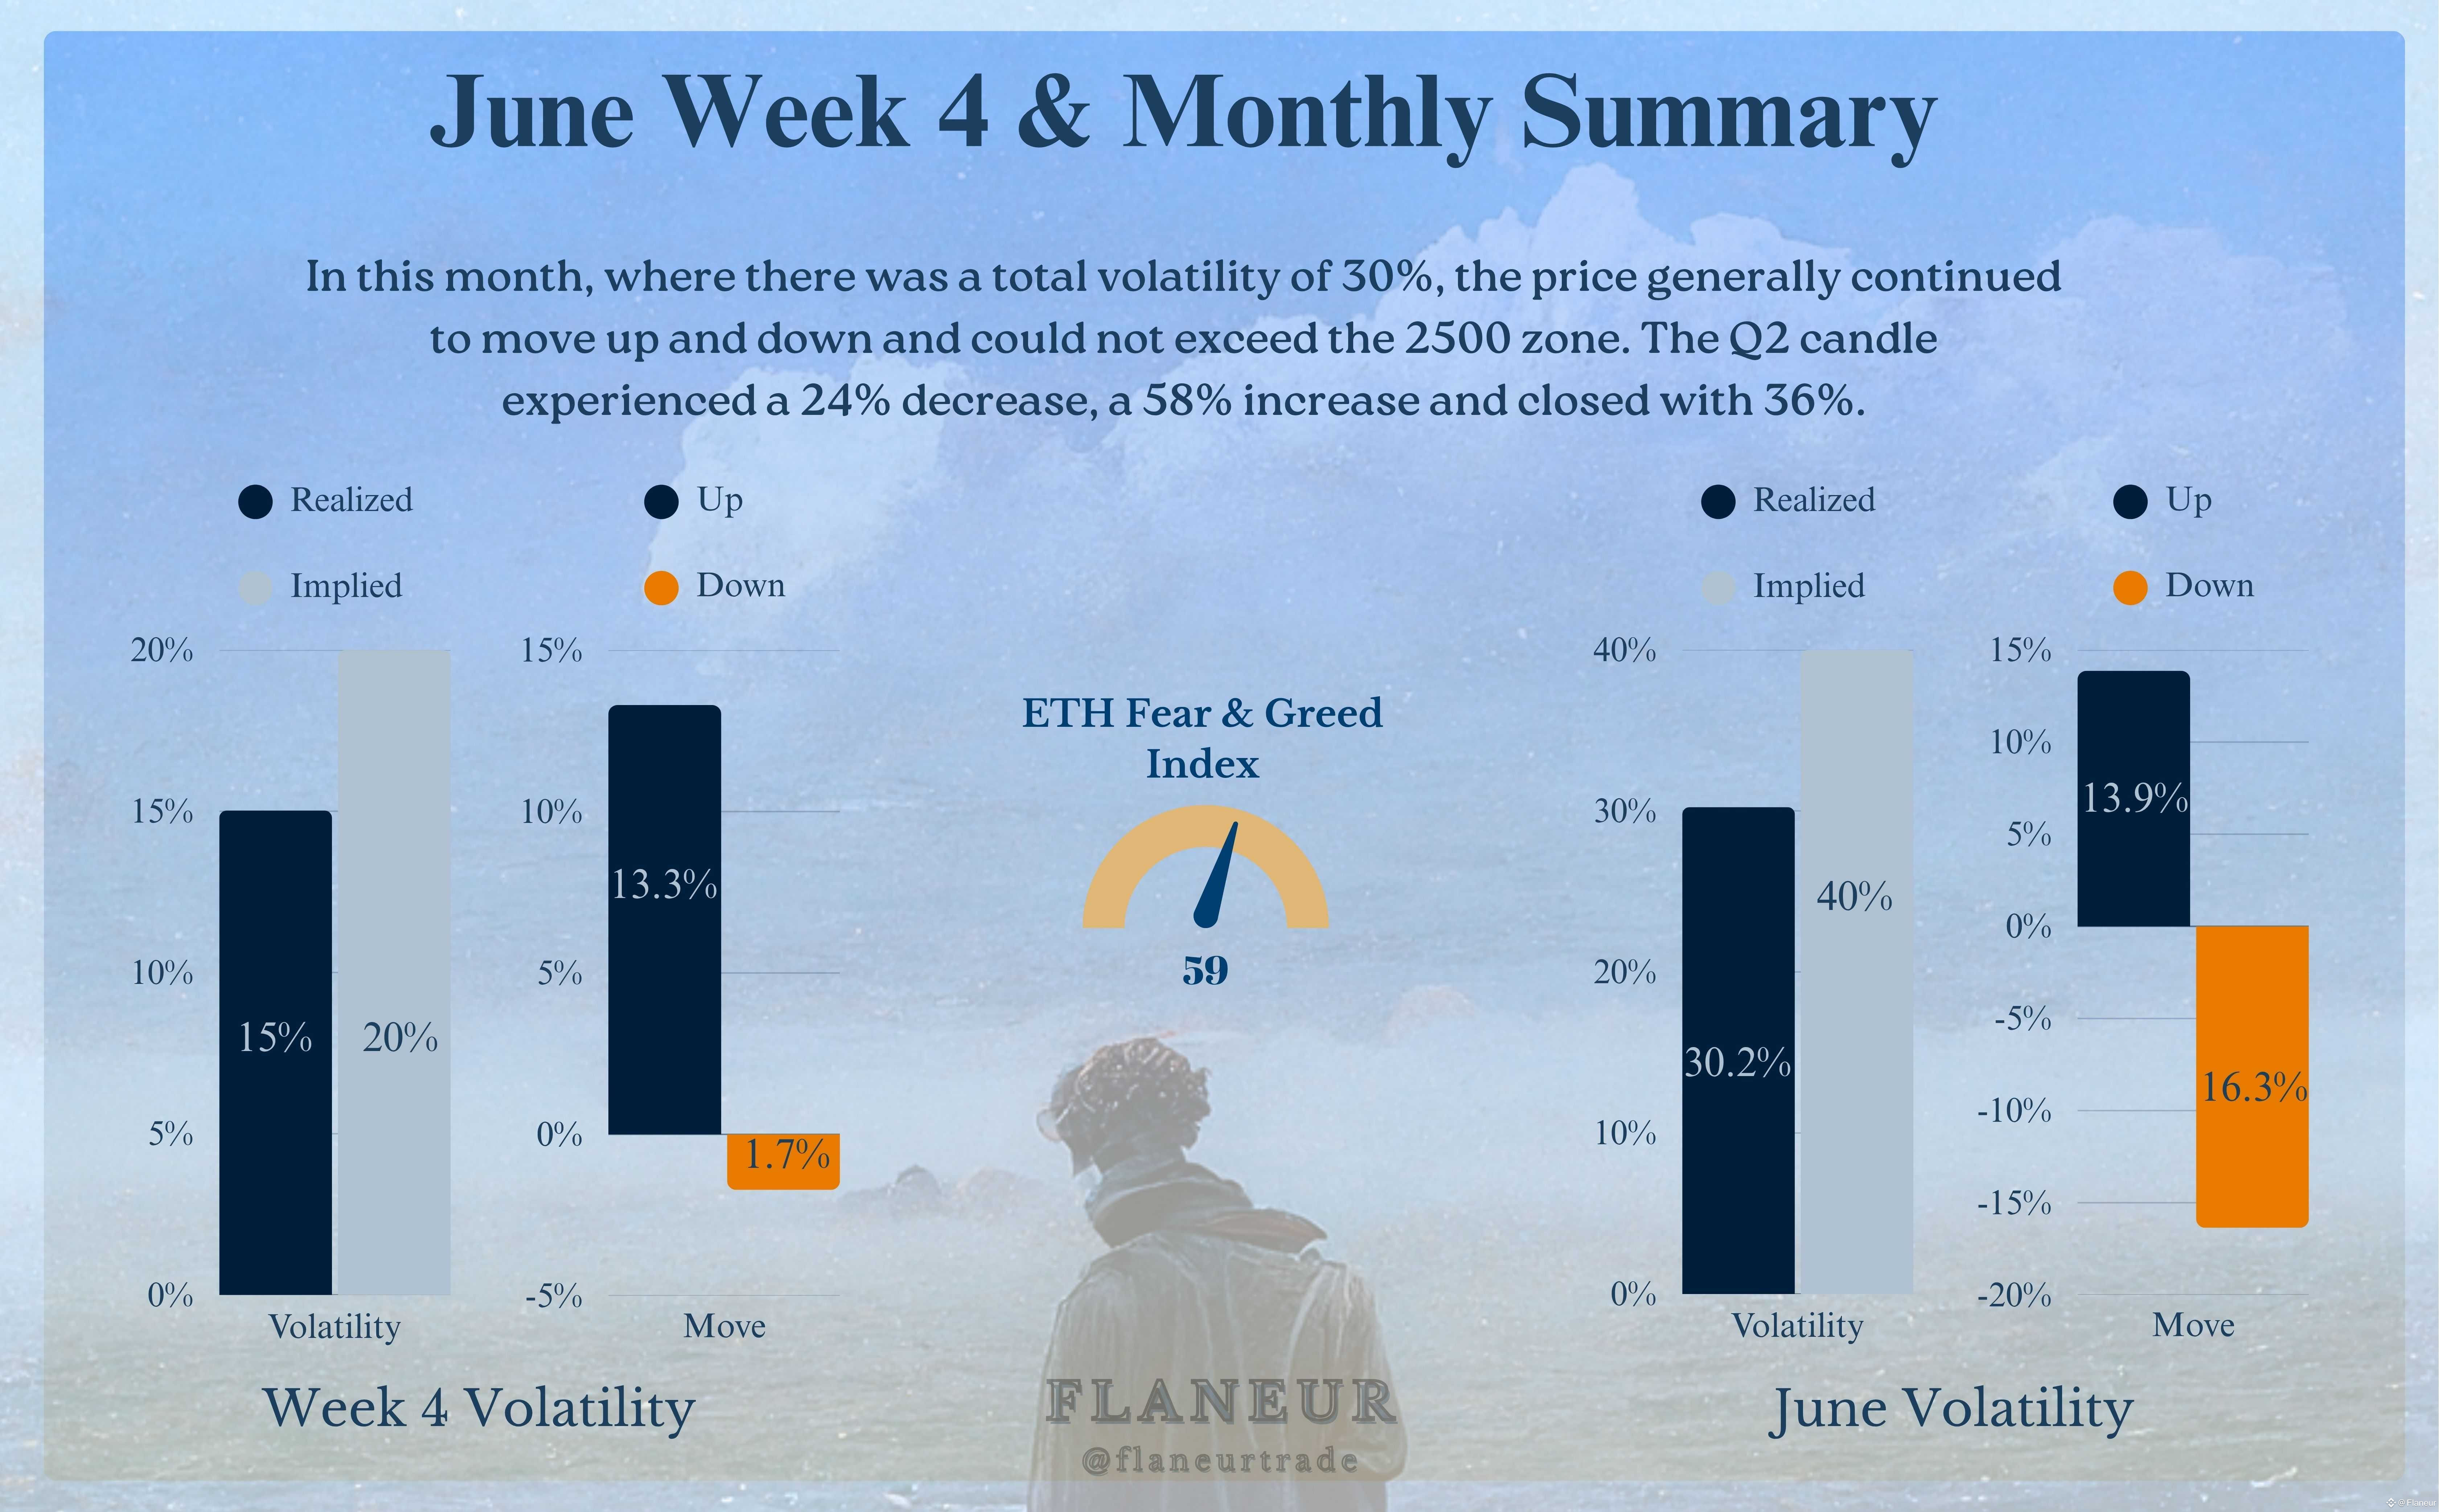
Historically, July has been more volatile for ETH than for BTC, with an average monthly volatility of 39%. This means we could see sharper moves in ETH this month. In the past, July has either closed red with a 5% or 25% drop, or it has closed with a massive 50% gain twice. The ETH Fear & Greed Index is at 59, showing a neutral sentiment.
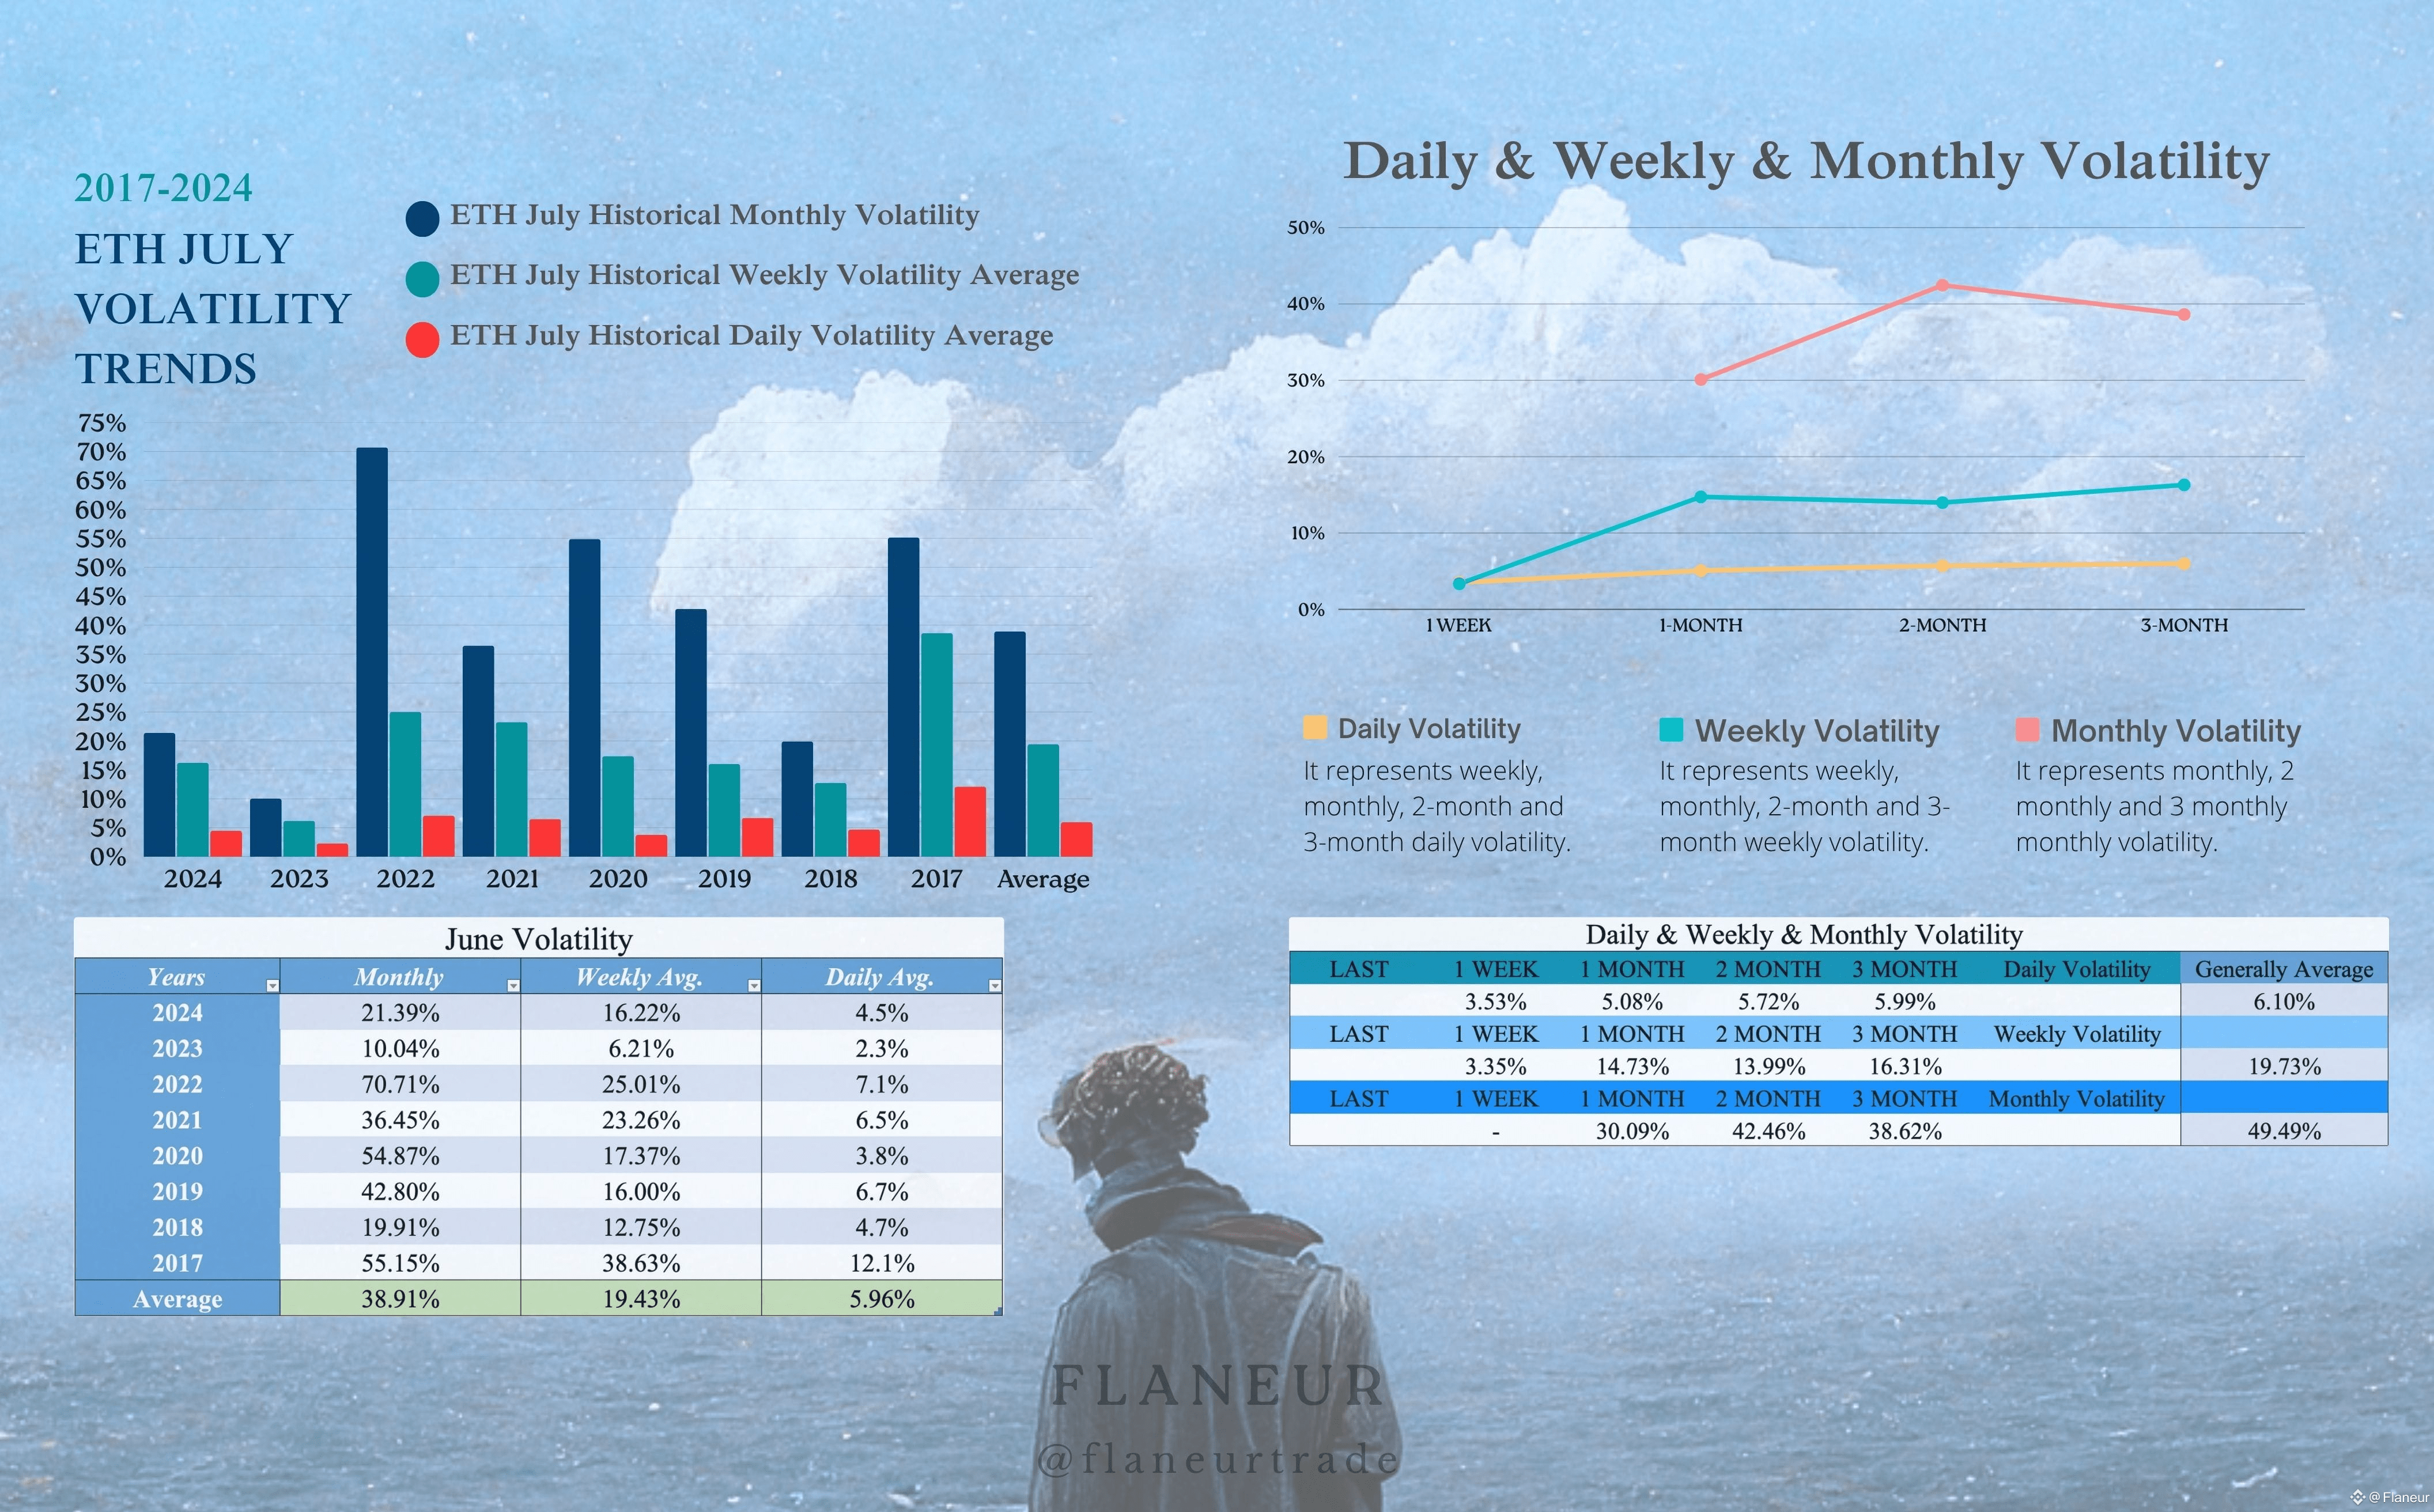
The monthly volatility of 39% gives us a wide price range of $1500 - $3450. On a weekly basis, our implied volatility range of 19.5% is between $2000 and $3000. It's likely we have an active month ahead. We can pinpoint the $2500 area as this month's pivot and the $2250 area as the pivot for Q3. The $2,100-$2,200 zone, in particular, looks like an ideal area to position for a move.
Here's the breakdown of options and other data:
For the July 25 expiry, the Max Pain price has increased from $2,200 to $2,500. This level is also a significant technical resistance, making it a likely target for expiration.
The Put/Call Ratio has risen from 0.52 to 0.55, showing that the market is quite optimistic about ETH and expects a continued rise.
Although DVOL has dropped from 73% to 65%, it remains at a high level, indicating that the expectation of volatility for ETH is still very much alive.
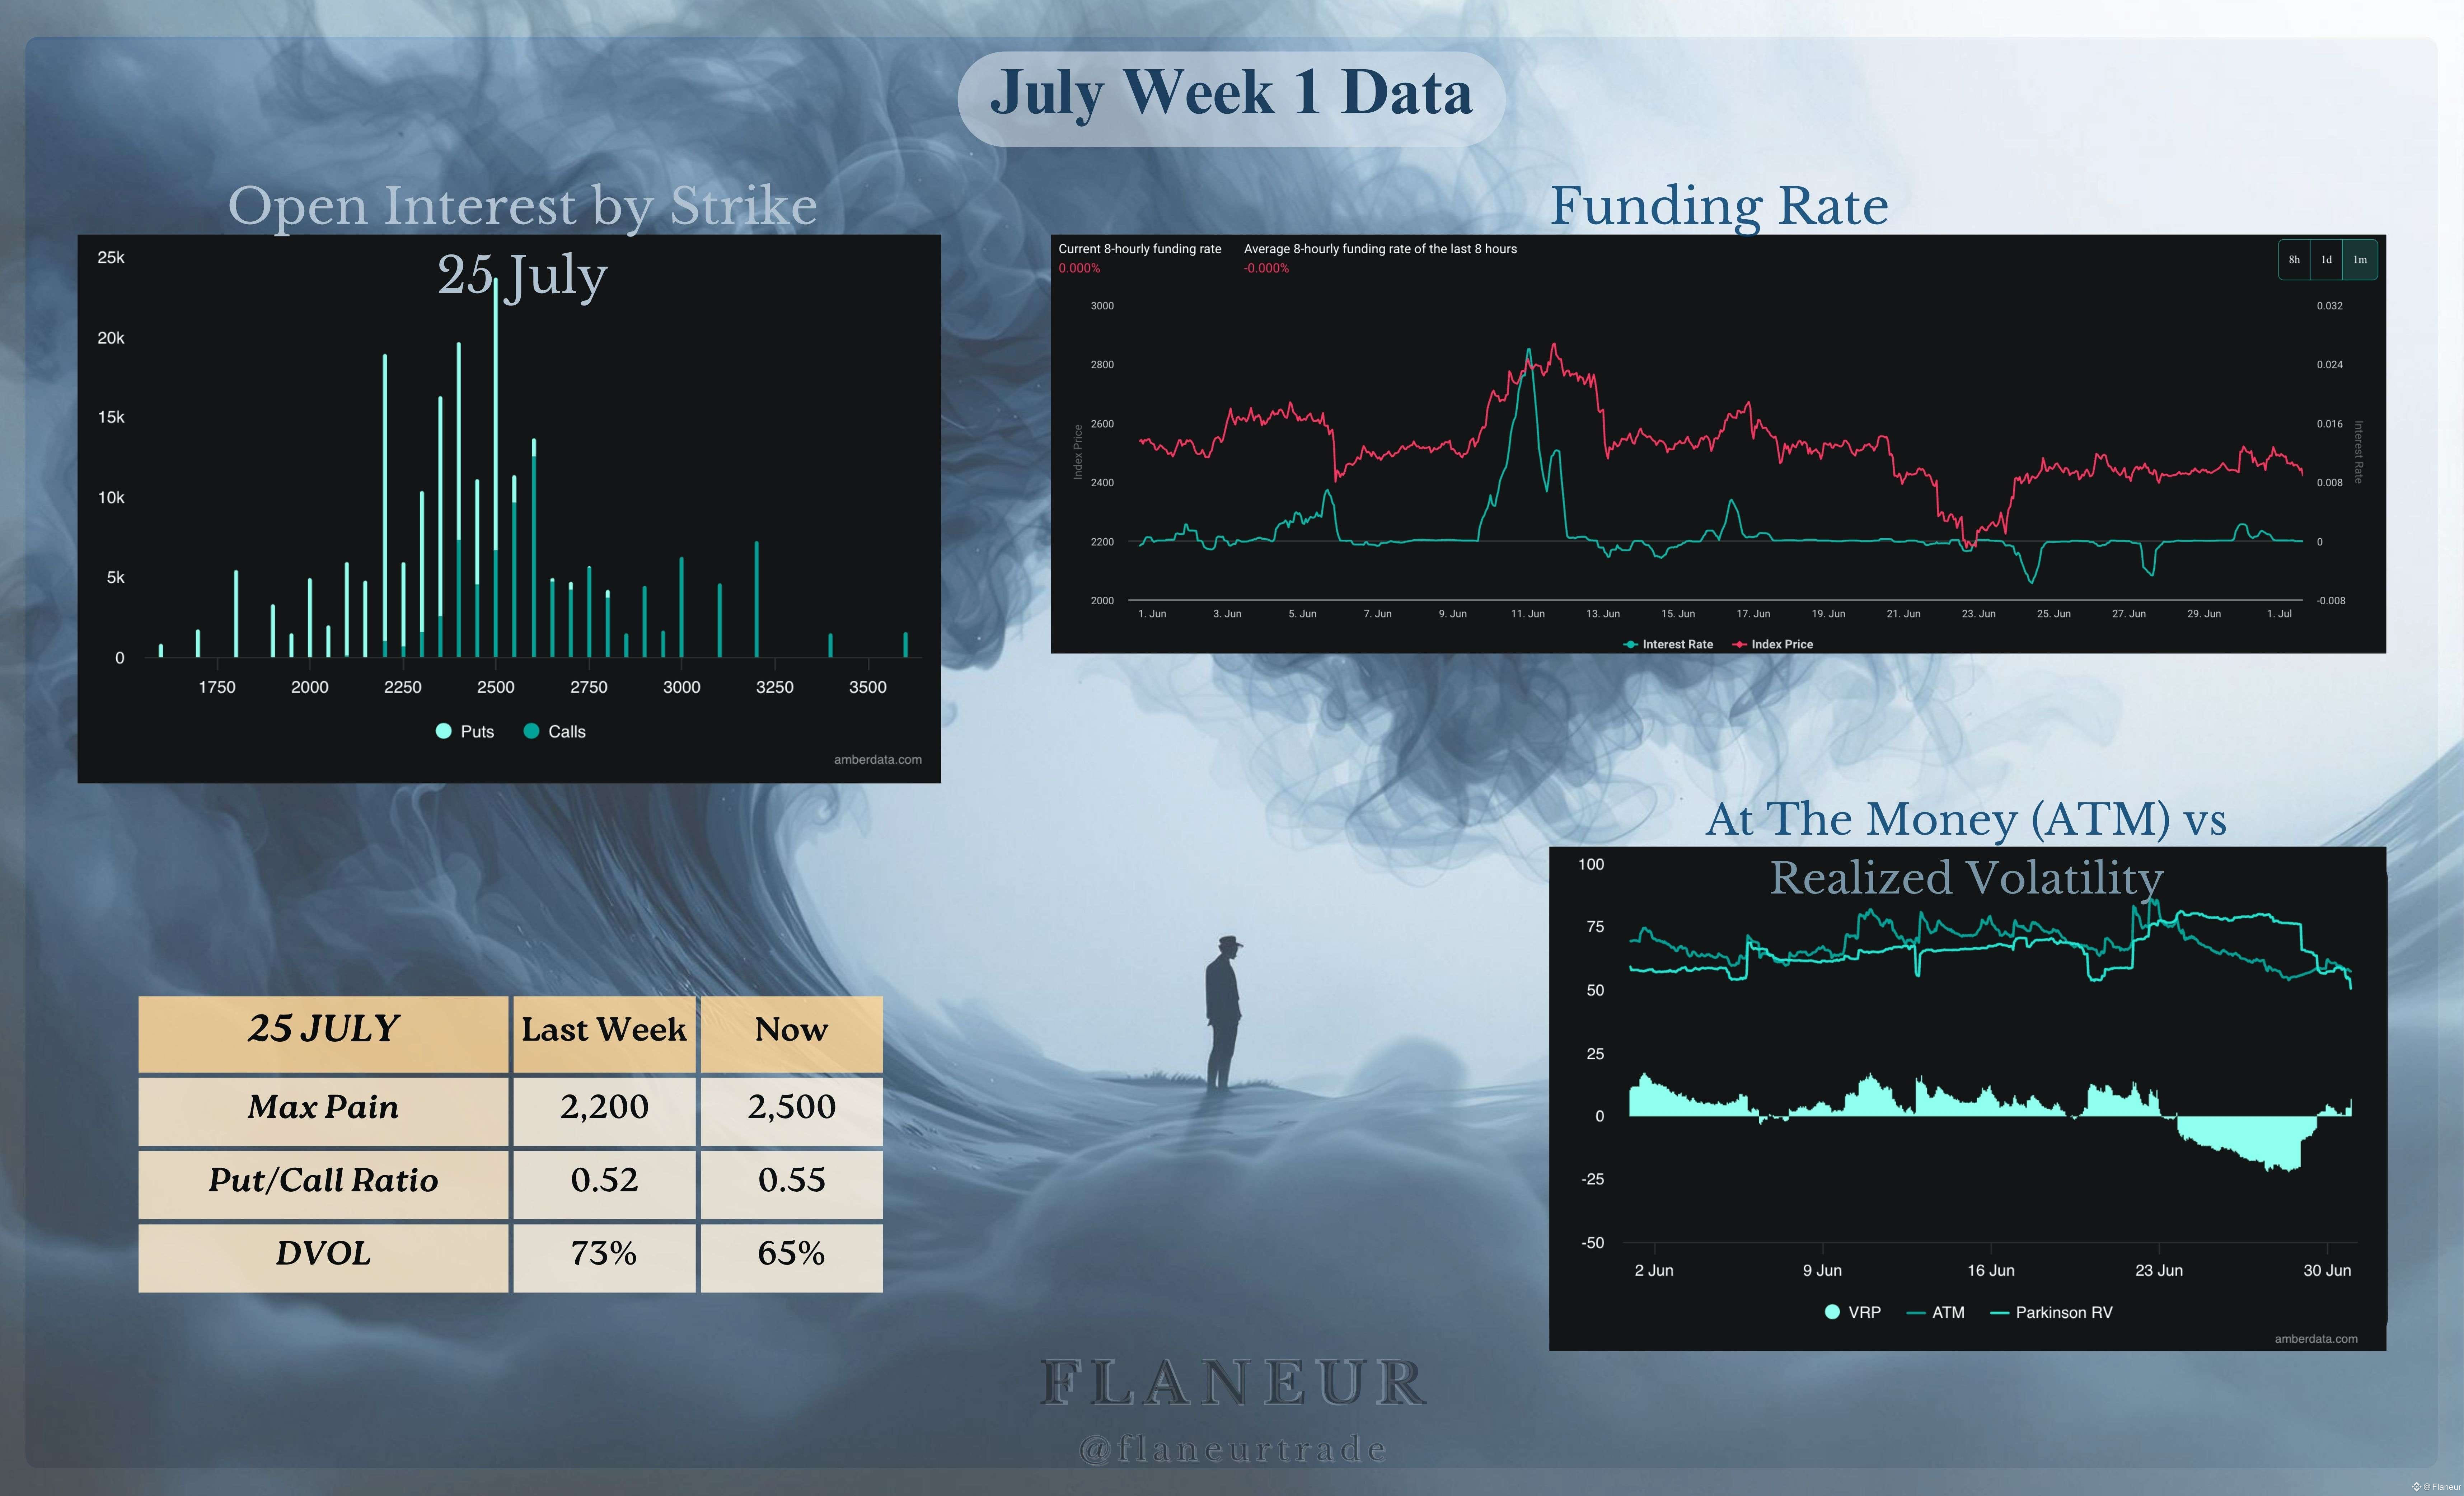
The price accumulating below $2500 and testing investors' patience could be a prelude to a sharp upward move. A decisive break above this area will likely attract new buyers.
DVOL (Volatility Index) and the Calm Before the Storm
The DVOL index, which is Bitcoin's implied volatility index, gives us a critical signal about the market's mood. Similar to the VIX index in traditional markets, DVOL measures the expectation of future price volatility among options traders.
Currently, we see the DVOL index approaching its all-time lows (ATL). This indicates that the market is in a state of extreme complacency and does not expect significant price swings in the near future. This complacency also makes option premiums cheaper.
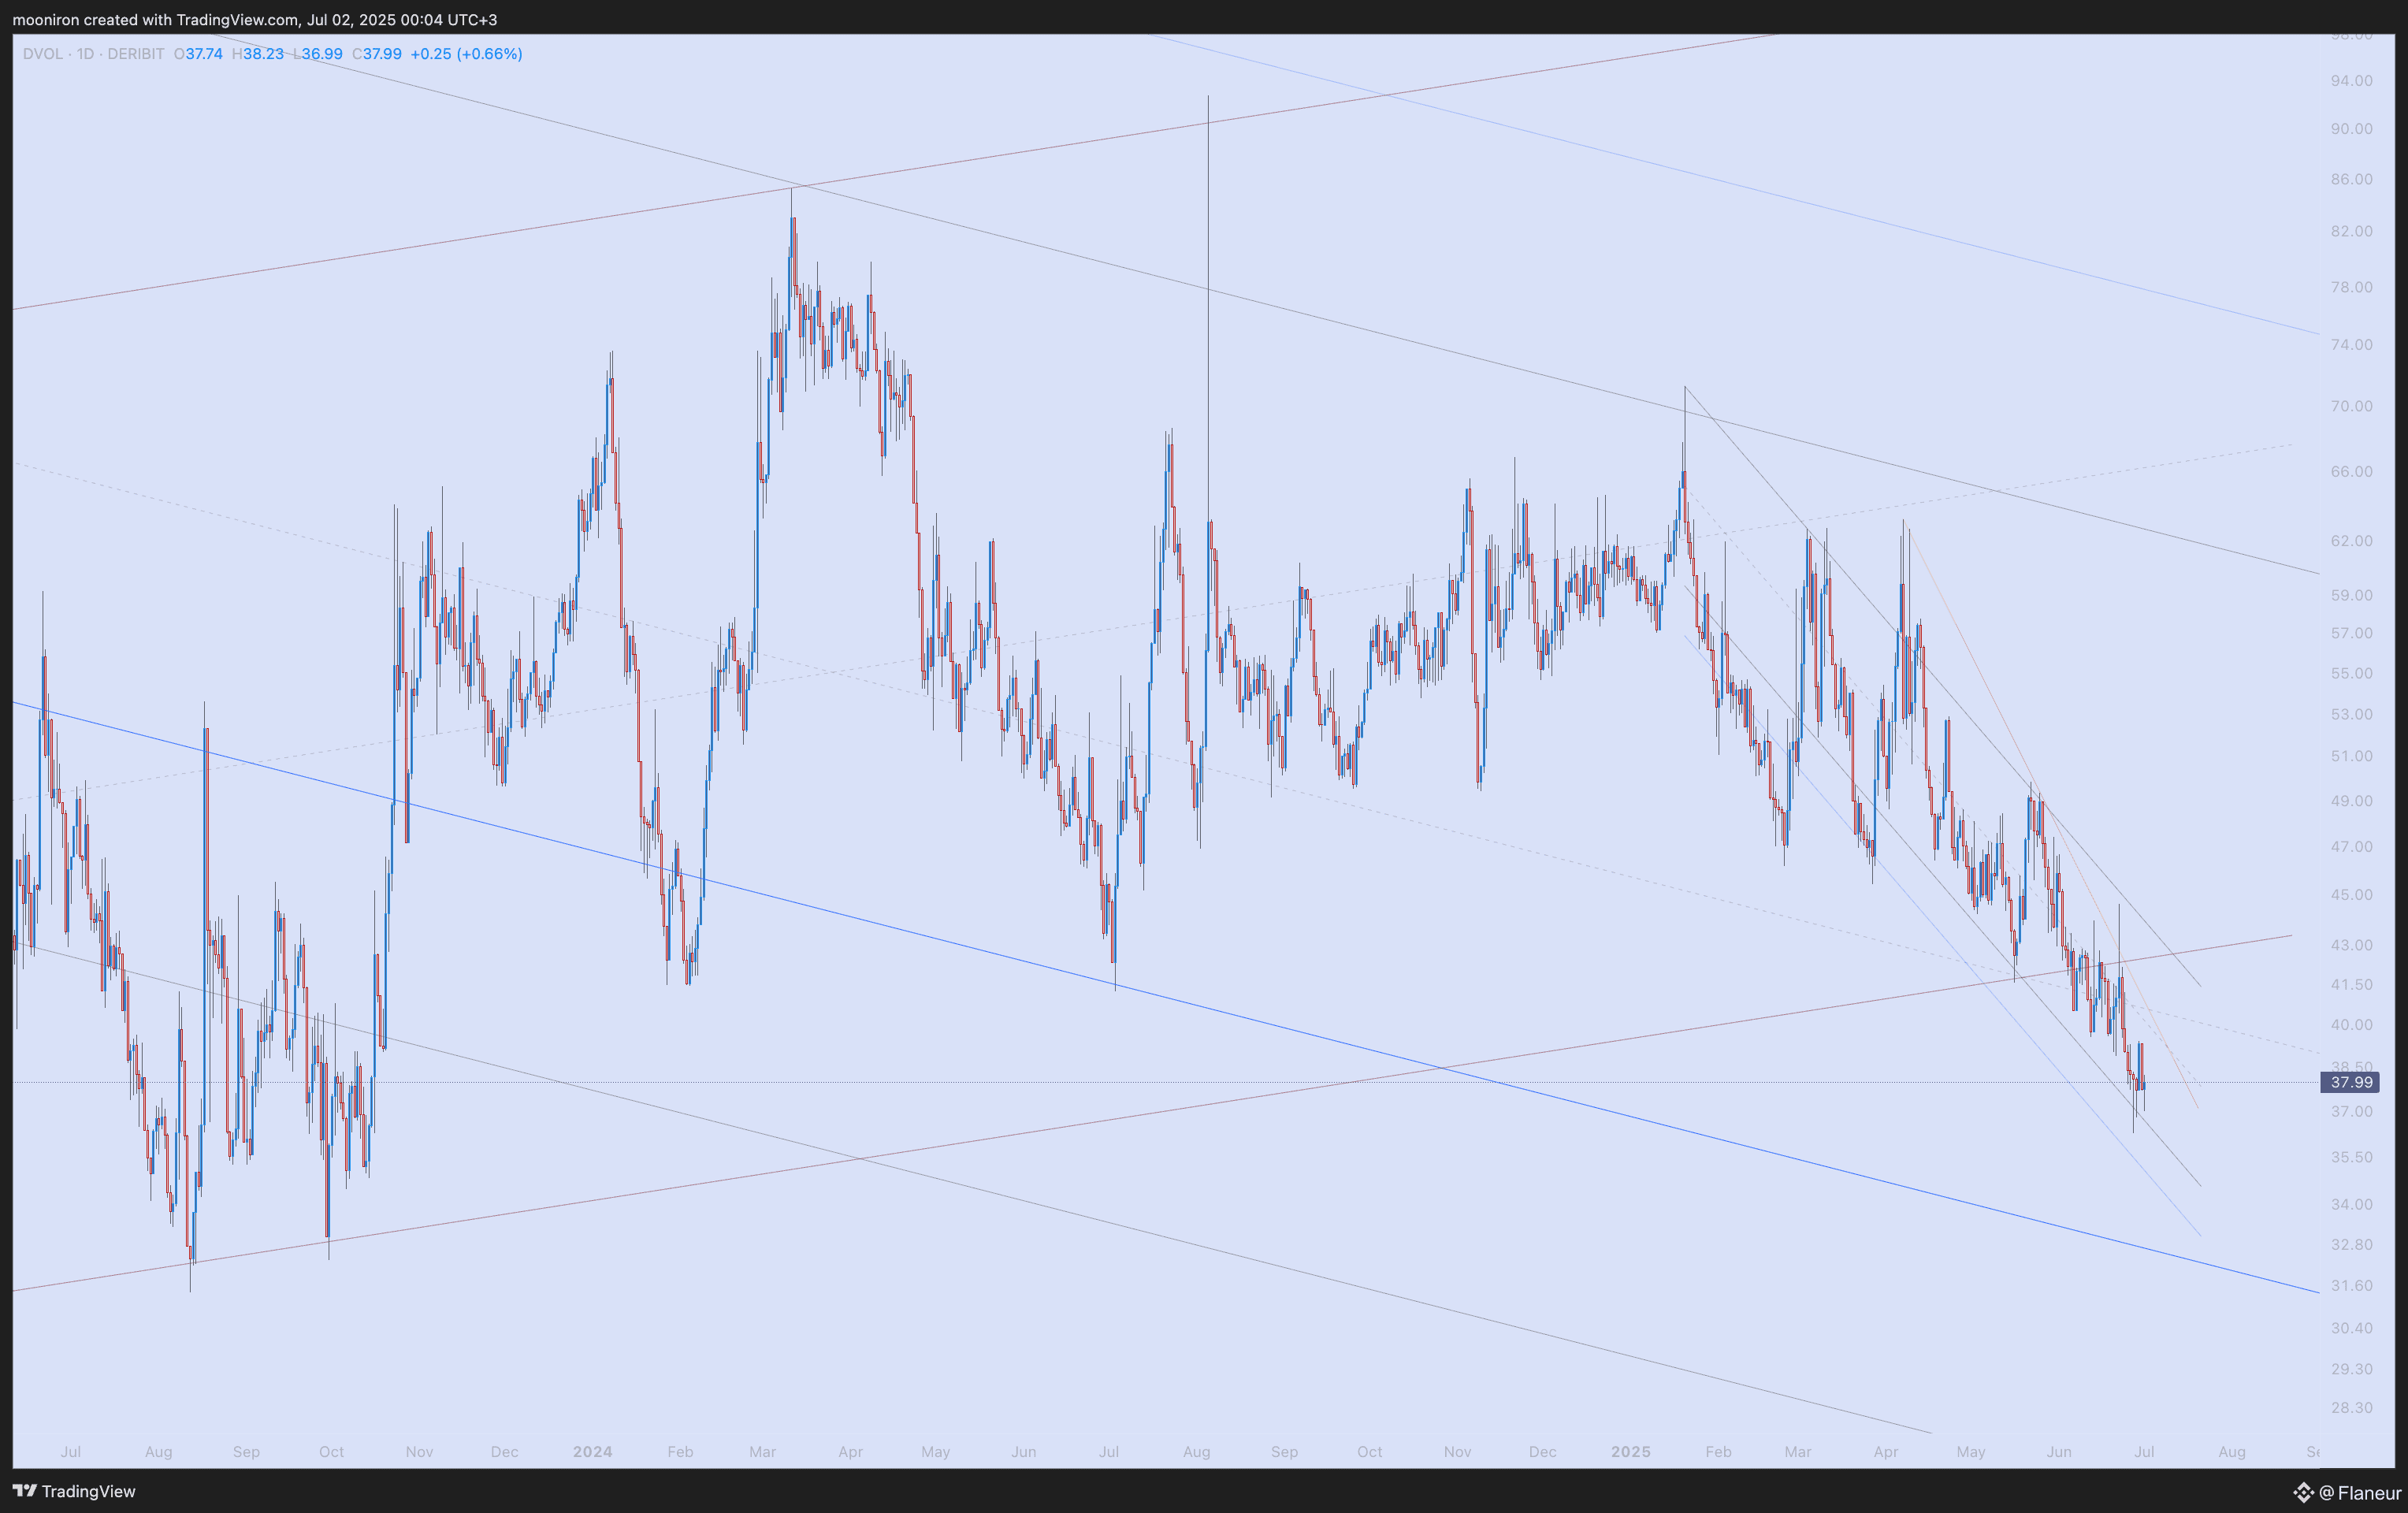
However, financial market history has taught us one thing: extremely low volatility is often the precursor to extremely high volatility. The market is like a coiled spring. When it moves sideways for this long and volatility drops this much, the eventual breakout (up or down) is usually very sharp and explosive. The fact that everyone in the market expects calm is one of the strongest contrarian signals that a big move is approaching. While it's hard to predict the direction, these low DVOL levels are whispering that we should be prepared for the start of a sharp new trend in the coming weeks.
Conclusion
BTC closed Q2 with a 30% gain, and ETH with a 36% gain, confirming the overall uptrend. However, the DVOL index at historic lows suggests the market is in a dangerously calm state. Historically, July has shown mixed results for both BTC and ETH. Therefore, this month's closing will likely be triggered by macroeconomic developments, especially CPI data and interest rate decisions. While options data paints an optimistic picture on one hand, the "calm before the storm" scenario created by DVOL on the other tells us we need to be prepared for a sharp move in either direction at any moment. We'll be watching developments closely.
#TrumpVsMusk #REX-OSPREYSolanaETF #OneBigBeautifulBill #StrategyBTCPurchase #BinanceAlphaAlert