
#usstocks
usstocks
196,145 views
797 Discussing
Hot
Latest

·
--
Verified
Article
The Fed Meets in December. The 10-Year Yield Is Already Above 5%Disclosure: It is not financial advice
The next Federal Reserve policy meeting is still weeks away. The 10-year US Treasury yield did not wait.
On Tuesday, 10 November 2026, the US Bureau of Labor Statistics reported that the consumer price index rose a seasonally adjusted 0.4 percent in October, above the 0.3 percent increase economists had expected, according to Reuters and CNBC. Core CPI, which excludes food and energy, rose 0.3 percent, also above the forecast. The BLS did not publish a year-over-year inflation rate, because a government shutdown in 2025 left no October comparison base.
The Federal Reserve's policy rate is still in a 3.75 percent to 4.00 percent range, after officials held that range at the October meeting. The next scheduled Federal Open Market Committee meeting is on 8 and 9 December 2026, according to the Federal Reserve's official calendar, last updated on 12 November 2026. It is a meeting associated with a Summary of Economic Projections.
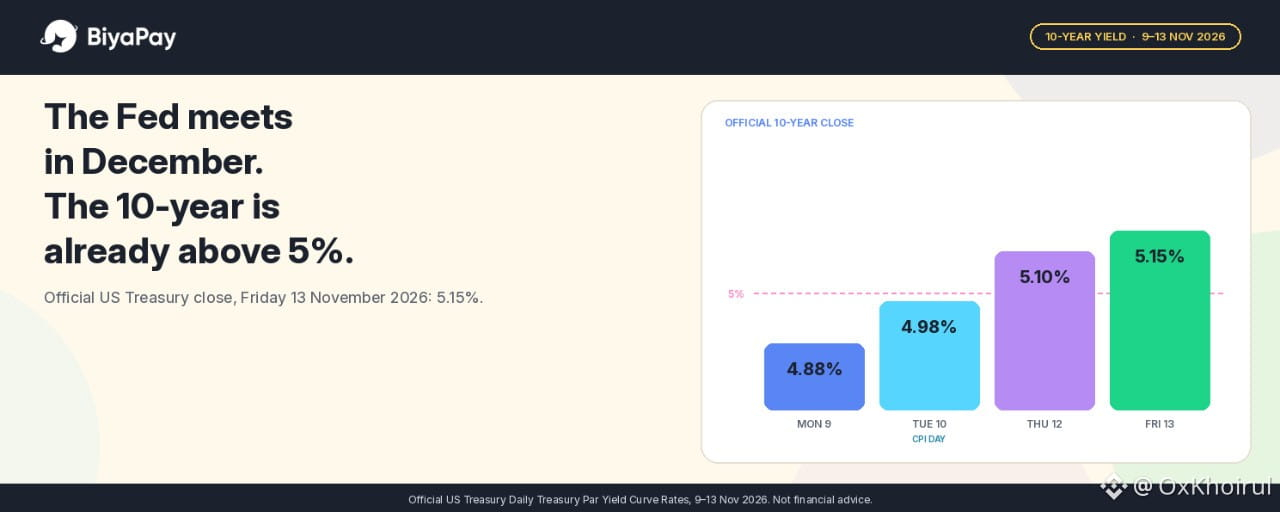
By Friday, 13 November, the official Daily Treasury Par Yield Curve Rate for the 10-year note had closed at 5.15 percent. On Monday, 9 November, that same official series closed at 4.88 percent. That is a rise of 27 basis points in four trading sessions. One basis point is 0.01 percent. From the previous Friday, 6 November, when the 10-year closed at 4.86 percent, the week's move was 29 basis points.
The 10-year crossed 5 percent between the Tuesday close of 4.98 percent, the day of the CPI report, and the Thursday close of 5.10 percent. There is no official daily close on that Treasury series for Wednesday, 11 November. I am using the official daily par yield curve, not an intra-day screen, so these are closing figures.
This is not a forecast of what the Fed will do in December, and it is not a recommendation to buy or sell any stock. It is a reading of a rate that is already on an official Treasury page, and of what I would put next to a US stock after a week like this.
The policy rate and the 10-year are not the same number
It is easy to treat "the Fed will hike" as the whole story. The policy rate is the overnight federal funds range. A widely discussed 25 basis point increase in December would take that range to 4.00 percent to 4.25 percent, if the Fed chooses that size. That decision has not been made.
The 10-year yield is a longer market rate. It already closed at 5.15 percent on Friday, which is above both the current policy range and the 4.00 to 4.25 percent range that a quarter-point hike would create. The two-year yield, which usually moves more closely with near-term policy expectations, closed at 4.88 percent on Friday, up 32 basis points from Monday's 4.56 percent, on the same official Treasury series.
In my view, that is why the useful number this week is not a December headline that has not arrived yet. The useful number is the 10-year yield that already moved.
Markets can still be surprised. Officials have discussed a larger 50 basis point option, and I would not treat Friday's close as a prediction of where the 10-year will be on 9 December. I would treat 5.15 percent as the market rate that is on the page today.
What 5.15 percent means on a 1,000 dollar example
Take 1,000 dollars as a worked example, not as a suggested order size.
At Friday's official 10-year close of 5.15 percent, 1,000 dollars would correspond to 51.50 dollars over a year if that yield were earned for a full year. At Monday's close of 4.88 percent, the same example would have been 48.80 dollars. The week's 27 basis point rise lifted that annual figure by 2.70 dollars on 1,000 dollars, or by 27 dollars on 10,000 dollars.
That 51.50 dollar figure is a benchmark, not a return I can claim, and it is not a product on BiyaPay. To earn a Treasury yield, an investor would have to buy an actual Treasury security, elsewhere, at the then-prevailing price, and hold it through the relevant period. The 5.15 percent close is the market's own longer-term rate. I would use it as a hurdle: a US stock I am considering would have to offer a combination of dividends and price change that I believe can clear that bar, after costs, and after the risk that comes with equities.
Dividends are part of that comparison only when they are actually paid. A BiyaPay Help Center article, dated 10 February 2026 and checked on 14 November 2026, says that US and Hong Kong stocks purchased may receive dividends. Whether a dividend is paid depends on whether the company pays one and whether you meet that company's conditions. I would not plug in a made-up dividend and call it income.
The cost of placing a US stock order on BiyaPay sits in a different category. Official product language describes US stock trading with 0 commission. A BiyaPay article on US stock fees, published on 2 June 2026 and still describing the same schedule when checked on 14 November 2026, says the published US stock platform fee is 0.005 US dollars per share, with a minimum of 0.99 US dollars per order and a maximum of 1 percent of the transaction value. External institution fees, trading activity fees, and other items can also apply, and I would read the live fee schedule and the order preview before sending anything.
On a 1,000 dollar example, that 0.99 dollar minimum is about 0.1 percent of the position, and it is a one-time order cost. Friday's 5.15 percent yield is an annual benchmark. Those two numbers are not the same kind of cost, and I would not pretend they are. The comparison I would still make is one of scale. If I hold for a year, the hurdle I am measuring against is 51.50 dollars on 1,000 dollars, which is many times the published minimum platform fee on a single order. This week, the market rate moved by 2.70 dollars on that same 1,000 dollar example, which is already larger than the 0.99 dollar minimum.
When this hurdle matters, and when it does not
This comparison is useful if I am considering a US stock as a longer holding, and I want a clear market rate to put next to whatever return I expect. In a week when the 10-year has just moved through 5 percent, that rate is easier to ignore than it should be, because the conversation is about the December meeting rather than about the yield that already changed.
It is less useful if I am trading around the announcement itself. A short holding is dominated by the next price move, which can be several percent in either direction, not by a 5.15 percent annual benchmark. A 1 percent move on a 1,000 dollar position is 10 dollars, which is already larger than the week's 2.70 dollar change in the annual hurdle.
It also does not apply as a guaranteed alternative. BiyaPay's US stock product is a way to buy actual shares. It is not a Treasury auction, and I would not write as if a 5.15 percent yield is sitting in a wallet and can be clicked. Cash, USDT, and a 10-year Treasury are different assets. This article is about the hurdle, not about a substitute trade.
A December decision that surprises the path already priced into the market could move the 10-year again, up or down. Friday's close is a starting point I would update, not a number I would freeze until December.
What I would actually do
In my view, the question worth asking after this CPI week is not "will the Fed hike in December?" That outcome is widely expected, and the 10-year has already moved. The question I would ask is whether a US stock I am looking at can reasonably be expected to earn more than the 5.15 percent the 10-year already offers, after the costs I would actually pay, and after the risk of holding equities instead of a government note.
I would rather start with that hurdle than start with the commission line. The commission is published as zero, and the remaining order fees are real, but they are not what changed this week.
A short list I would use:
Read the latest official 10-year close, not only the Fed-meeting headline.Write down what return I actually expect from the stock, including only dividends the company itself has declared or paid, not a round number I assumed.Check the BiyaPay order preview for the fee on that ticket, including the 0.99 dollar platform-fee minimum where it applies.If I cannot explain why the stock should clear a 5.15 percent hurdle after those costs, I would wait, rather than treat a December headline as a reason to click.
None of this is financial advice, and it is not a recommendation to buy or sell. Official yields, fees, and meeting calendars can change. I would re-read the Treasury daily par yield curve, the Federal Reserve calendar, and the current BiyaPay fee schedule and order preview before acting.
Source: US Bureau of Labor Statistics CPI report for October 2026, as reported by Reuters and CNBC on 10 November 2026; US Treasury Daily Treasury Par Yield Curve Rates for 6 to 13 November 2026, captured on 14 November 2026 at 06:12 Asia/Jakarta (UTC+7); Federal Reserve FOMC calendar, last updated 12 November 2026; BiyaPay Help Center article on dividends, dated 10 February 2026, and BiyaPay US stock fee explanation published 2 June 2026, both checked on 14 November 2026 (Asia/Jakarta, UTC+7).
#BiyaPay #TreasuryYield #USStocks
The Fed Meets in December. The 10-Year Yield Is Already Above 5%
Disclosure: It is not financial advice
The next Federal Reserve policy meeting is still weeks away. The 10-year US Treasury yield did not wait.
On Tuesday, 10 November 2026, the US Bureau of Labor Statistics reported that the consumer price index rose a seasonally adjusted 0.4 percent in October, above the 0.3 percent increase economists had expected, according to Reuters and CNBC. Core CPI, which excludes food and energy, rose 0.3 percent, also above the forecast. The BLS did not publish a year-over-year inflation rate, because a government shutdown in 2025 left no October comparison base.
The Federal Reserve's policy rate is still in a 3.75 percent to 4.00 percent range, after officials held that range at the October meeting. The next scheduled Federal Open Market Committee meeting is on 8 and 9 December 2026, according to the Federal Reserve's official calendar, last updated on 12 November 2026. It is a meeting associated with a Summary of Economic Projections.
By Friday, 13 November, the official Daily Treasury Par Yield Curve Rate for the 10-year note had closed at 5.15 percent. On Monday, 9 November, that same official series closed at 4.88 percent. That is a rise of 27 basis points in four trading sessions. One basis point is 0.01 percent. From the previous Friday, 6 November, when the 10-year closed at 4.86 percent, the week's move was 29 basis points.
The 10-year crossed 5 percent between the Tuesday close of 4.98 percent, the day of the CPI report, and the Thursday close of 5.10 percent. There is no official daily close on that Treasury series for Wednesday, 11 November. I am using the official daily par yield curve, not an intra-day screen, so these are closing figures.
This is not a forecast of what the Fed will do in December, and it is not a recommendation to buy or sell any stock. It is a reading of a rate that is already on an official Treasury page, and of what I would put next to a US stock after a week like this.
The policy rate and the 10-year are not the same number
It is easy to treat "the Fed will hike" as the whole story. The policy rate is the overnight federal funds range. A widely discussed 25 basis point increase in December would take that range to 4.00 percent to 4.25 percent, if the Fed chooses that size. That decision has not been made.
The 10-year yield is a longer market rate. It already closed at 5.15 percent on Friday, which is above both the current policy range and the 4.00 to 4.25 percent range that a quarter-point hike would create. The two-year yield, which usually moves more closely with near-term policy expectations, closed at 4.88 percent on Friday, up 32 basis points from Monday's 4.56 percent, on the same official Treasury series.
In my view, that is why the useful number this week is not a December headline that has not arrived yet. The useful number is the 10-year yield that already moved.
Markets can still be surprised. Officials have discussed a larger 50 basis point option, and I would not treat Friday's close as a prediction of where the 10-year will be on 9 December. I would treat 5.15 percent as the market rate that is on the page today.
What 5.15 percent means on a 1,000 dollar example
Take 1,000 dollars as a worked example, not as a suggested order size.
At Friday's official 10-year close of 5.15 percent, 1,000 dollars would correspond to 51.50 dollars over a year if that yield were earned for a full year. At Monday's close of 4.88 percent, the same example would have been 48.80 dollars. The week's 27 basis point rise lifted that annual figure by 2.70 dollars on 1,000 dollars, or by 27 dollars on 10,000 dollars.
That 51.50 dollar figure is a benchmark, not a return I can claim, and it is not a product on BiyaPay. To earn a Treasury yield, an investor would have to buy an actual Treasury security, elsewhere, at the then-prevailing price, and hold it through the relevant period. The 5.15 percent close is the market's own longer-term rate. I would use it as a hurdle: a US stock I am considering would have to offer a combination of dividends and price change that I believe can clear that bar, after costs, and after the risk that comes with equities.
Dividends are part of that comparison only when they are actually paid. A BiyaPay Help Center article, dated 10 February 2026 and checked on 14 November 2026, says that US and Hong Kong stocks purchased may receive dividends. Whether a dividend is paid depends on whether the company pays one and whether you meet that company's conditions. I would not plug in a made-up dividend and call it income.
The cost of placing a US stock order on BiyaPay sits in a different category. Official product language describes US stock trading with 0 commission. A BiyaPay article on US stock fees, published on 2 June 2026 and still describing the same schedule when checked on 14 November 2026, says the published US stock platform fee is 0.005 US dollars per share, with a minimum of 0.99 US dollars per order and a maximum of 1 percent of the transaction value. External institution fees, trading activity fees, and other items can also apply, and I would read the live fee schedule and the order preview before sending anything.
On a 1,000 dollar example, that 0.99 dollar minimum is about 0.1 percent of the position, and it is a one-time order cost. Friday's 5.15 percent yield is an annual benchmark. Those two numbers are not the same kind of cost, and I would not pretend they are. The comparison I would still make is one of scale. If I hold for a year, the hurdle I am measuring against is 51.50 dollars on 1,000 dollars, which is many times the published minimum platform fee on a single order. This week, the market rate moved by 2.70 dollars on that same 1,000 dollar example, which is already larger than the 0.99 dollar minimum.
When this hurdle matters, and when it does not
This comparison is useful if I am considering a US stock as a longer holding, and I want a clear market rate to put next to whatever return I expect. In a week when the 10-year has just moved through 5 percent, that rate is easier to ignore than it should be, because the conversation is about the December meeting rather than about the yield that already changed.
It is less useful if I am trading around the announcement itself. A short holding is dominated by the next price move, which can be several percent in either direction, not by a 5.15 percent annual benchmark. A 1 percent move on a 1,000 dollar position is 10 dollars, which is already larger than the week's 2.70 dollar change in the annual hurdle.
It also does not apply as a guaranteed alternative. BiyaPay's US stock product is a way to buy actual shares. It is not a Treasury auction, and I would not write as if a 5.15 percent yield is sitting in a wallet and can be clicked. Cash, USDT, and a 10-year Treasury are different assets. This article is about the hurdle, not about a substitute trade.
A December decision that surprises the path already priced into the market could move the 10-year again, up or down. Friday's close is a starting point I would update, not a number I would freeze until December.
What I would actually do
In my view, the question worth asking after this CPI week is not "will the Fed hike in December?" That outcome is widely expected, and the 10-year has already moved. The question I would ask is whether a US stock I am looking at can reasonably be expected to earn more than the 5.15 percent the 10-year already offers, after the costs I would actually pay, and after the risk of holding equities instead of a government note.
I would rather start with that hurdle than start with the commission line. The commission is published as zero, and the remaining order fees are real, but they are not what changed this week.
A short list I would use:
Read the latest official 10-year close, not only the Fed-meeting headline.Write down what return I actually expect from the stock, including only dividends the company itself has declared or paid, not a round number I assumed.Check the BiyaPay order preview for the fee on that ticket, including the 0.99 dollar platform-fee minimum where it applies.If I cannot explain why the stock should clear a 5.15 percent hurdle after those costs, I would wait, rather than treat a December headline as a reason to click.
None of this is financial advice, and it is not a recommendation to buy or sell. Official yields, fees, and meeting calendars can change. I would re-read the Treasury daily par yield curve, the Federal Reserve calendar, and the current BiyaPay fee schedule and order preview before acting.
Source: US Bureau of Labor Statistics CPI report for October 2026, as reported by Reuters and CNBC on 10 November 2026; US Treasury Daily Treasury Par Yield Curve Rates for 6 to 13 November 2026, captured on 14 November 2026 at 06:12 Asia/Jakarta (UTC+7); Federal Reserve FOMC calendar, last updated 12 November 2026; BiyaPay Help Center article on dividends, dated 10 February 2026, and BiyaPay US stock fee explanation published 2 June 2026, both checked on 14 November 2026 (Asia/Jakarta, UTC+7).
#BiyaPay #TreasuryYield #USStocks
The next Federal Reserve policy meeting is still weeks away. The 10-year US Treasury yield did not wait.
On Tuesday, 10 November 2026, the US Bureau of Labor Statistics reported that the consumer price index rose a seasonally adjusted 0.4 percent in October, above the 0.3 percent increase economists had expected, according to Reuters and CNBC. Core CPI, which excludes food and energy, rose 0.3 percent, also above the forecast. The BLS did not publish a year-over-year inflation rate, because a government shutdown in 2025 left no October comparison base.
The Federal Reserve's policy rate is still in a 3.75 percent to 4.00 percent range, after officials held that range at the October meeting. The next scheduled Federal Open Market Committee meeting is on 8 and 9 December 2026, according to the Federal Reserve's official calendar, last updated on 12 November 2026. It is a meeting associated with a Summary of Economic Projections.
By Friday, 13 November, the official Daily Treasury Par Yield Curve Rate for the 10-year note had closed at 5.15 percent. On Monday, 9 November, that same official series closed at 4.88 percent. That is a rise of 27 basis points in four trading sessions. One basis point is 0.01 percent. From the previous Friday, 6 November, when the 10-year closed at 4.86 percent, the week's move was 29 basis points.
The 10-year crossed 5 percent between the Tuesday close of 4.98 percent, the day of the CPI report, and the Thursday close of 5.10 percent. There is no official daily close on that Treasury series for Wednesday, 11 November. I am using the official daily par yield curve, not an intra-day screen, so these are closing figures.
This is not a forecast of what the Fed will do in December, and it is not a recommendation to buy or sell any stock. It is a reading of a rate that is already on an official Treasury page, and of what I would put next to a US stock after a week like this.
The policy rate and the 10-year are not the same number
It is easy to treat "the Fed will hike" as the whole story. The policy rate is the overnight federal funds range. A widely discussed 25 basis point increase in December would take that range to 4.00 percent to 4.25 percent, if the Fed chooses that size. That decision has not been made.
The 10-year yield is a longer market rate. It already closed at 5.15 percent on Friday, which is above both the current policy range and the 4.00 to 4.25 percent range that a quarter-point hike would create. The two-year yield, which usually moves more closely with near-term policy expectations, closed at 4.88 percent on Friday, up 32 basis points from Monday's 4.56 percent, on the same official Treasury series.
In my view, that is why the useful number this week is not a December headline that has not arrived yet. The useful number is the 10-year yield that already moved.
Markets can still be surprised. Officials have discussed a larger 50 basis point option, and I would not treat Friday's close as a prediction of where the 10-year will be on 9 December. I would treat 5.15 percent as the market rate that is on the page today.
What 5.15 percent means on a 1,000 dollar example
Take 1,000 dollars as a worked example, not as a suggested order size.
At Friday's official 10-year close of 5.15 percent, 1,000 dollars would correspond to 51.50 dollars over a year if that yield were earned for a full year. At Monday's close of 4.88 percent, the same example would have been 48.80 dollars. The week's 27 basis point rise lifted that annual figure by 2.70 dollars on 1,000 dollars, or by 27 dollars on 10,000 dollars.
That 51.50 dollar figure is a benchmark, not a return I can claim, and it is not a product on BiyaPay. To earn a Treasury yield, an investor would have to buy an actual Treasury security, elsewhere, at the then-prevailing price, and hold it through the relevant period. The 5.15 percent close is the market's own longer-term rate. I would use it as a hurdle: a US stock I am considering would have to offer a combination of dividends and price change that I believe can clear that bar, after costs, and after the risk that comes with equities.
Dividends are part of that comparison only when they are actually paid. A BiyaPay Help Center article, dated 10 February 2026 and checked on 14 November 2026, says that US and Hong Kong stocks purchased may receive dividends. Whether a dividend is paid depends on whether the company pays one and whether you meet that company's conditions. I would not plug in a made-up dividend and call it income.
The cost of placing a US stock order on BiyaPay sits in a different category. Official product language describes US stock trading with 0 commission. A BiyaPay article on US stock fees, published on 2 June 2026 and still describing the same schedule when checked on 14 November 2026, says the published US stock platform fee is 0.005 US dollars per share, with a minimum of 0.99 US dollars per order and a maximum of 1 percent of the transaction value. External institution fees, trading activity fees, and other items can also apply, and I would read the live fee schedule and the order preview before sending anything.
On a 1,000 dollar example, that 0.99 dollar minimum is about 0.1 percent of the position, and it is a one-time order cost. Friday's 5.15 percent yield is an annual benchmark. Those two numbers are not the same kind of cost, and I would not pretend they are. The comparison I would still make is one of scale. If I hold for a year, the hurdle I am measuring against is 51.50 dollars on 1,000 dollars, which is many times the published minimum platform fee on a single order. This week, the market rate moved by 2.70 dollars on that same 1,000 dollar example, which is already larger than the 0.99 dollar minimum.
When this hurdle matters, and when it does not
This comparison is useful if I am considering a US stock as a longer holding, and I want a clear market rate to put next to whatever return I expect. In a week when the 10-year has just moved through 5 percent, that rate is easier to ignore than it should be, because the conversation is about the December meeting rather than about the yield that already changed.
It is less useful if I am trading around the announcement itself. A short holding is dominated by the next price move, which can be several percent in either direction, not by a 5.15 percent annual benchmark. A 1 percent move on a 1,000 dollar position is 10 dollars, which is already larger than the week's 2.70 dollar change in the annual hurdle.
It also does not apply as a guaranteed alternative. BiyaPay's US stock product is a way to buy actual shares. It is not a Treasury auction, and I would not write as if a 5.15 percent yield is sitting in a wallet and can be clicked. Cash, USDT, and a 10-year Treasury are different assets. This article is about the hurdle, not about a substitute trade.
A December decision that surprises the path already priced into the market could move the 10-year again, up or down. Friday's close is a starting point I would update, not a number I would freeze until December.
What I would actually do
In my view, the question worth asking after this CPI week is not "will the Fed hike in December?" That outcome is widely expected, and the 10-year has already moved. The question I would ask is whether a US stock I am looking at can reasonably be expected to earn more than the 5.15 percent the 10-year already offers, after the costs I would actually pay, and after the risk of holding equities instead of a government note.
I would rather start with that hurdle than start with the commission line. The commission is published as zero, and the remaining order fees are real, but they are not what changed this week.
A short list I would use:
Read the latest official 10-year close, not only the Fed-meeting headline.Write down what return I actually expect from the stock, including only dividends the company itself has declared or paid, not a round number I assumed.Check the BiyaPay order preview for the fee on that ticket, including the 0.99 dollar platform-fee minimum where it applies.If I cannot explain why the stock should clear a 5.15 percent hurdle after those costs, I would wait, rather than treat a December headline as a reason to click.
None of this is financial advice, and it is not a recommendation to buy or sell. Official yields, fees, and meeting calendars can change. I would re-read the Treasury daily par yield curve, the Federal Reserve calendar, and the current BiyaPay fee schedule and order preview before acting.
Source: US Bureau of Labor Statistics CPI report for October 2026, as reported by Reuters and CNBC on 10 November 2026; US Treasury Daily Treasury Par Yield Curve Rates for 6 to 13 November 2026, captured on 14 November 2026 at 06:12 Asia/Jakarta (UTC+7); Federal Reserve FOMC calendar, last updated 12 November 2026; BiyaPay Help Center article on dividends, dated 10 February 2026, and BiyaPay US stock fee explanation published 2 June 2026, both checked on 14 November 2026 (Asia/Jakarta, UTC+7).
#BiyaPay #TreasuryYield #USStocks
Mujib59:
Hello Good morning 🌞
I followed you please follow me back
2
2
1.1k

·
--
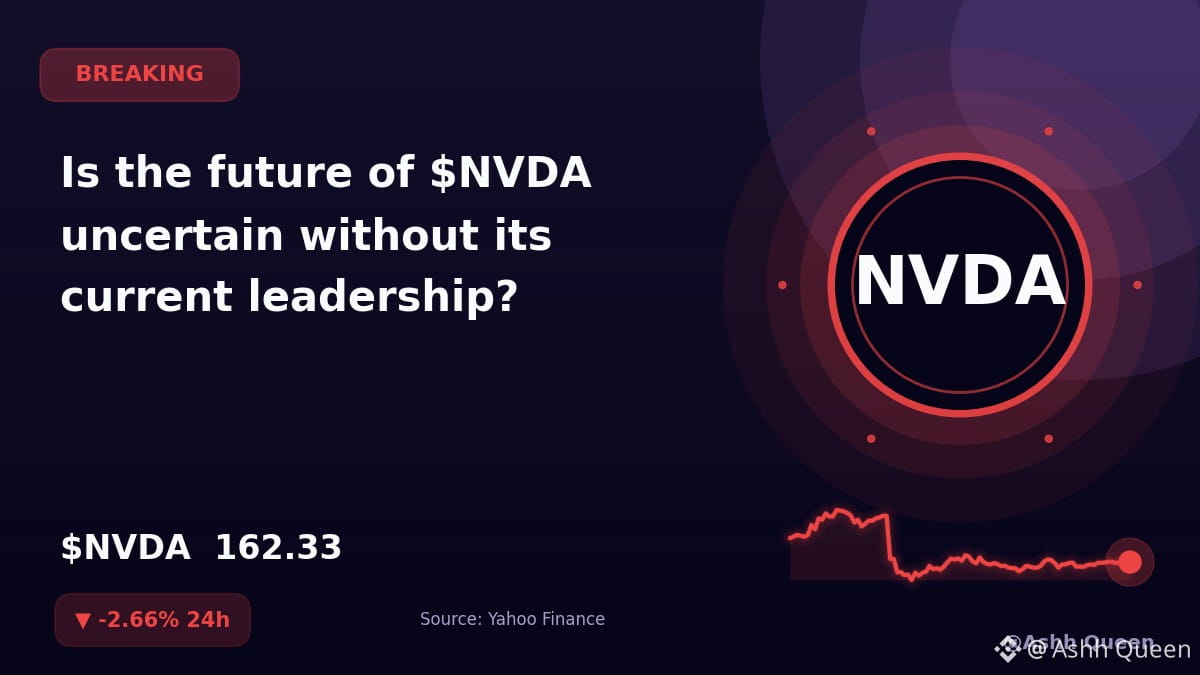
Is the future of $NVDA uncertain without its current leadership?
Yahoo Finance reports that the company’s share value fell nearly 13% this week. Meanwhile, Decrypt notes that the board has reportedly approached the chief executive of Arm as a potential successor for Jensen Huang.
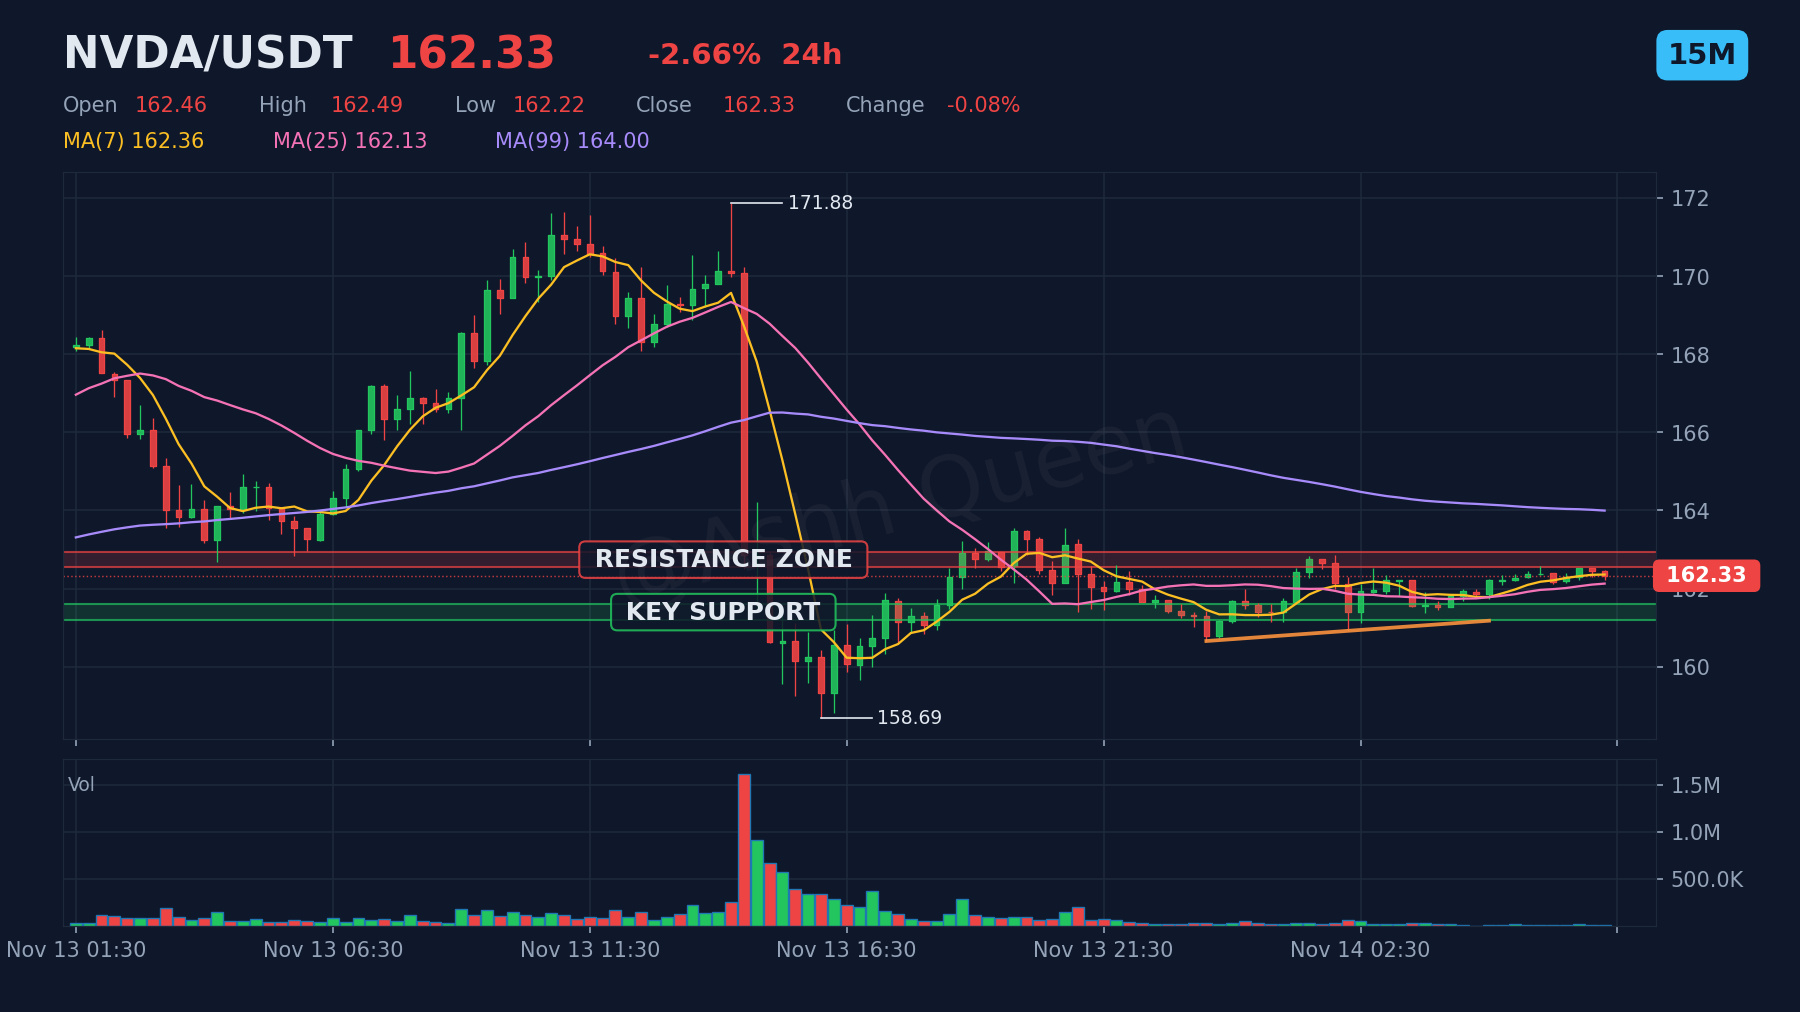
You can track this perpetual contract at a price of 162.33, with a 24h change of -2.66%. The current support level sits at 161.40.
⚠️ 🧐
Do you prefer to trade this perp on the short or the longer timeframe?
#NVDA #USStocks #Stocks
⚠️ Perpetual contracts are leveraged derivatives, not the stock or commodity itself.
This is analysis, not a recommendation. Manage risk first, profit second.
Is the future of $NVDA uncertain without its current leadership?
Yahoo Finance reports that the company’s share value fell nearly 13% this week. Meanwhile, Decrypt notes that the board has reportedly approached the chief executive of Arm as a potential successor for Jensen Huang.
You can track this perpetual contract at a price of 162.33, with a 24h change of -2.66%. The current support level sits at 161.40.
⚠️ 🧐
Do you prefer to trade this perp on the short or the longer timeframe?
#NVDA #USStocks #Stocks
⚠️ Perpetual contracts are leveraged derivatives, not the stock or commodity itself.
This is analysis, not a recommendation. Manage risk first, profit second.
Yahoo Finance reports that the company’s share value fell nearly 13% this week. Meanwhile, Decrypt notes that the board has reportedly approached the chief executive of Arm as a potential successor for Jensen Huang.
You can track this perpetual contract at a price of 162.33, with a 24h change of -2.66%. The current support level sits at 161.40.
⚠️ 🧐
Do you prefer to trade this perp on the short or the longer timeframe?
#NVDA #USStocks #Stocks
⚠️ Perpetual contracts are leveraged derivatives, not the stock or commodity itself.
This is analysis, not a recommendation. Manage risk first, profit second.
49
·
--
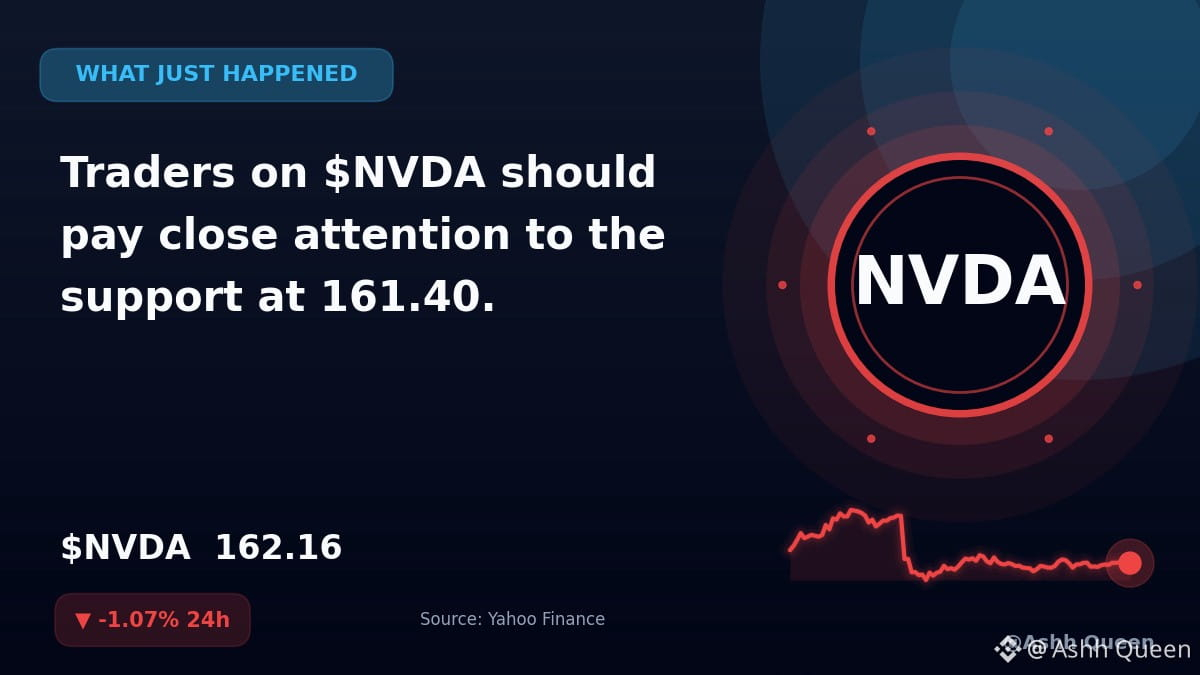
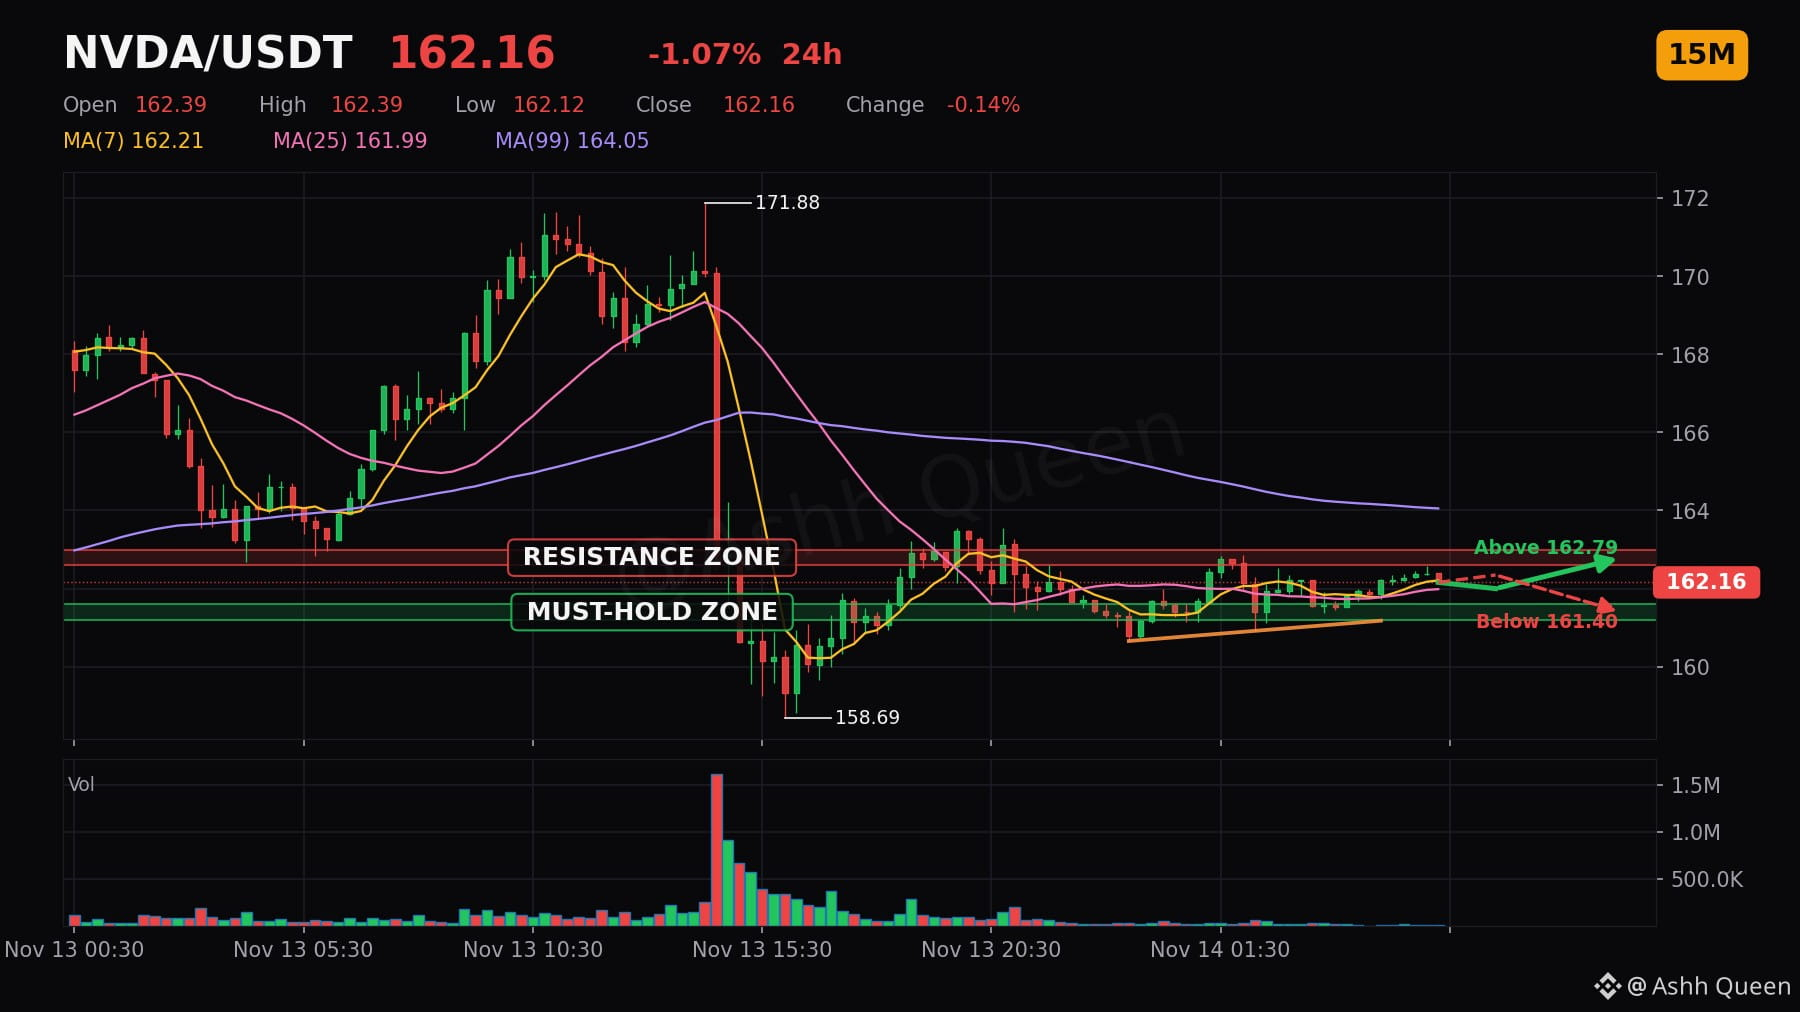
Traders on $NVDA should pay close attention to the support at 161.40.
According to Yahoo Finance, Jim Simons’ firm has exited its position in the chipmaker. Reports from the same outlet indicate the firm disclosed multi-billion dollar stakes in other technology equities.
The $NVDA perpetual contract is currently trading at 162.16 with a 24h change of -1.07%.
📈 📉 📊
What specific market signal or fundamental shift would change your current outlook on this asset?
#NVDA #NVDAStock #StockMarketNews #USStocks
⚠️ Perpetual contracts are leveraged derivatives, not the stock or commodity itself.
Not financial advice. Markets are volatile, so use stop-losses and only risk what you can afford to lose.
Traders on $NVDA should pay close attention to the support at 161.40.
According to Yahoo Finance, Jim Simons’ firm has exited its position in the chipmaker. Reports from the same outlet indicate the firm disclosed multi-billion dollar stakes in other technology equities.
The $NVDA perpetual contract is currently trading at 162.16 with a 24h change of -1.07%.
📈 📉 📊
What specific market signal or fundamental shift would change your current outlook on this asset?
#NVDA #NVDAStock #StockMarketNews #USStocks
⚠️ Perpetual contracts are leveraged derivatives, not the stock or commodity itself.
Not financial advice. Markets are volatile, so use stop-losses and only risk what you can afford to lose.
According to Yahoo Finance, Jim Simons’ firm has exited its position in the chipmaker. Reports from the same outlet indicate the firm disclosed multi-billion dollar stakes in other technology equities.
The $NVDA perpetual contract is currently trading at 162.16 with a 24h change of -1.07%.
📈 📉 📊
What specific market signal or fundamental shift would change your current outlook on this asset?
#NVDA #NVDAStock #StockMarketNews #USStocks
⚠️ Perpetual contracts are leveraged derivatives, not the stock or commodity itself.
Not financial advice. Markets are volatile, so use stop-losses and only risk what you can afford to lose.
43

·
--
Bearish
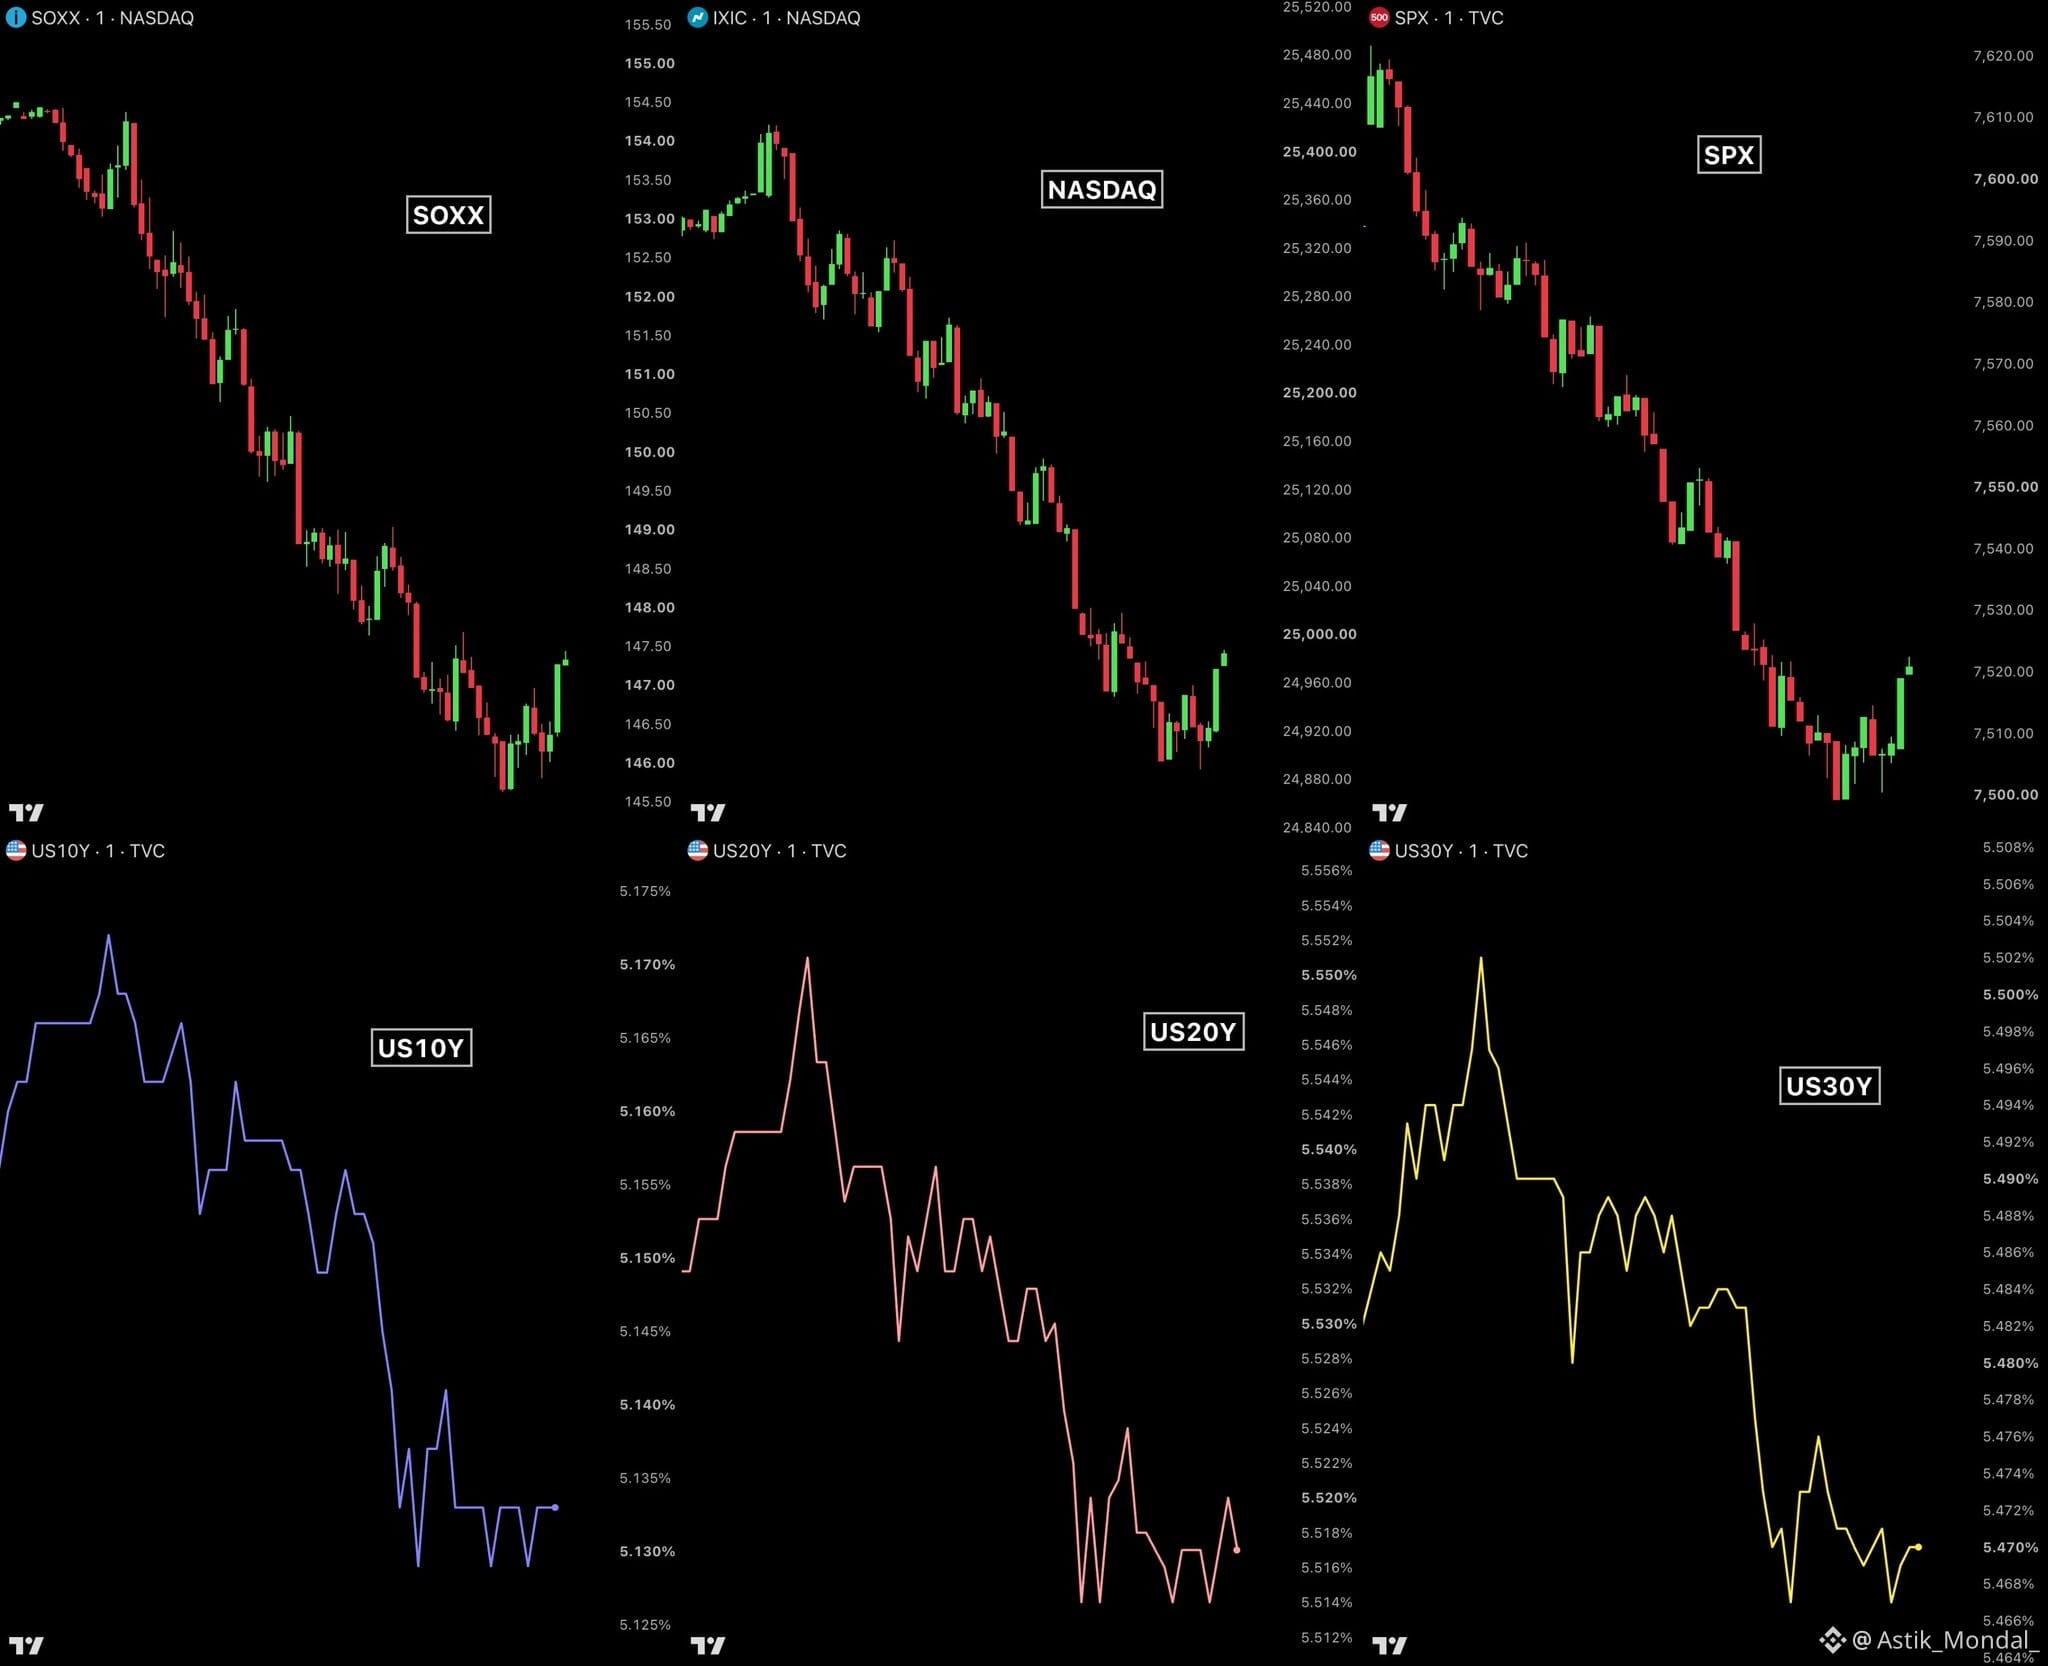
🚨 BREAKING: $1.2 TRILLION WIPED OUT FROM US STOCKS IN JUST 40 MINUTES. WALL STREET IS SELLING OFF AGGRESSIVELY.
The selling pressure is spreading across the entire US equity market.
📉 S&P 500: -1.56%
📉 Nasdaq: -2.28%
📉 Semiconductors (SOXX): -6.02%
But here's what makes this sell-off particularly interesting:
US Treasury yields are FALLING sharply across the 10-year, 20-year and 30-year maturities.
This suggests investors may be rotating toward the relative safety of government bonds amid growing uncertainty.
Two major concerns are weighing on sentiment:
AI valuations and concerns about future returns.
Inflation uncertainty and its potential impact on monetary policy.
The big question: Is this a temporary correction or the beginning of a deeper risk-off move?
Watch Treasury yields, tech stocks and semiconductor performance closely.
If selling accelerates, volatility across global markets could increase significantly.
#StockMarket #WallStreet #USStocks #BondMarket #GlobalMarkets
🚨 BREAKING: $1.2 TRILLION WIPED OUT FROM US STOCKS IN JUST 40 MINUTES. WALL STREET IS SELLING OFF AGGRESSIVELY.
The selling pressure is spreading across the entire US equity market.
📉 S&P 500: -1.56%
📉 Nasdaq: -2.28%
📉 Semiconductors (SOXX): -6.02%
But here's what makes this sell-off particularly interesting:
US Treasury yields are FALLING sharply across the 10-year, 20-year and 30-year maturities.
This suggests investors may be rotating toward the relative safety of government bonds amid growing uncertainty.
Two major concerns are weighing on sentiment:
AI valuations and concerns about future returns.
Inflation uncertainty and its potential impact on monetary policy.
The big question: Is this a temporary correction or the beginning of a deeper risk-off move?
Watch Treasury yields, tech stocks and semiconductor performance closely.
If selling accelerates, volatility across global markets could increase significantly.
#StockMarket #WallStreet #USStocks #BondMarket #GlobalMarkets
The selling pressure is spreading across the entire US equity market.
📉 S&P 500: -1.56%
📉 Nasdaq: -2.28%
📉 Semiconductors (SOXX): -6.02%
But here's what makes this sell-off particularly interesting:
US Treasury yields are FALLING sharply across the 10-year, 20-year and 30-year maturities.
This suggests investors may be rotating toward the relative safety of government bonds amid growing uncertainty.
Two major concerns are weighing on sentiment:
AI valuations and concerns about future returns.
Inflation uncertainty and its potential impact on monetary policy.
The big question: Is this a temporary correction or the beginning of a deeper risk-off move?
Watch Treasury yields, tech stocks and semiconductor performance closely.
If selling accelerates, volatility across global markets could increase significantly.
#StockMarket #WallStreet #USStocks #BondMarket #GlobalMarkets
1
210
·
--
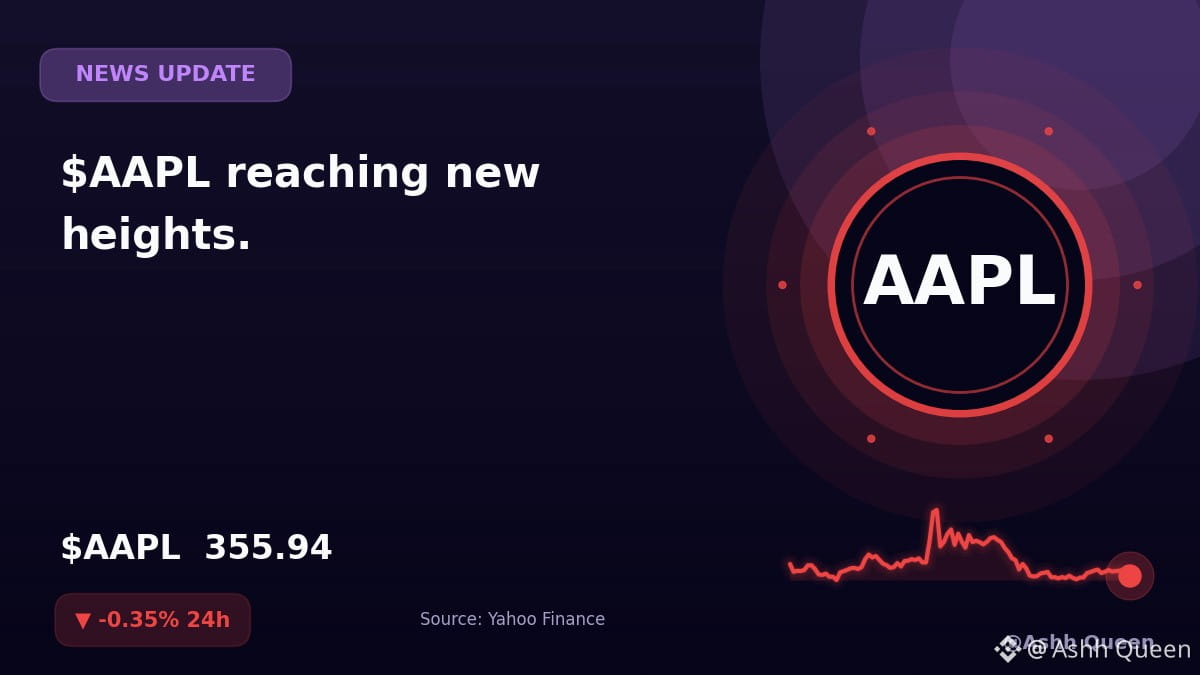
$AAPL reaching new heights.
Yahoo Finance reports the asset is hitting fresh highs, though the outlook suggests further upside potential remains possible.
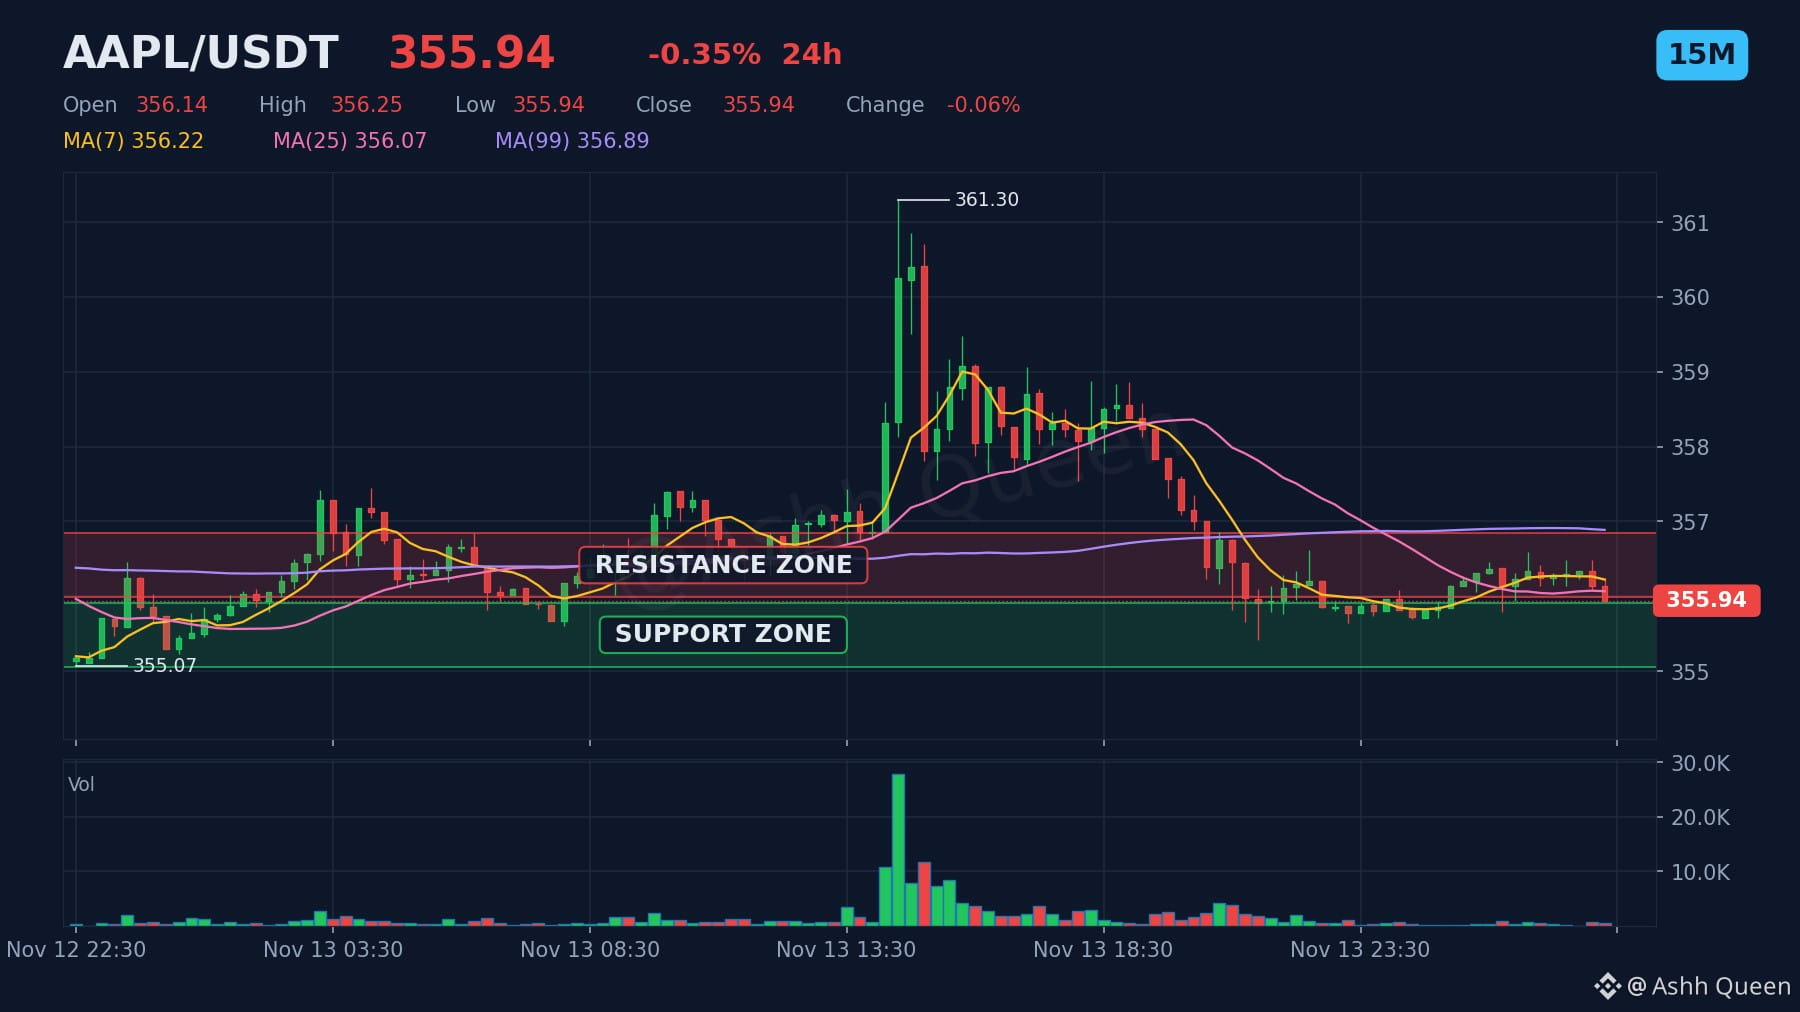
This AAPLUSDT perpetual contract is currently priced at 355.94 with a 24h change of -0.35%. The current resistance level sits at 356.42. 🎯 👀 🧭
Which level are you watching on the chart and why?
#AAPL #AAPLStock #USStocks
⚠️ Perpetual contracts are leveraged derivatives, not the stock or commodity itself.
Not financial advice. Markets are volatile, so use stop-losses and only risk what you can afford to lose.
$AAPL reaching new heights.
Yahoo Finance reports the asset is hitting fresh highs, though the outlook suggests further upside potential remains possible.
This AAPLUSDT perpetual contract is currently priced at 355.94 with a 24h change of -0.35%. The current resistance level sits at 356.42. 🎯 👀 🧭
Which level are you watching on the chart and why?
#AAPL #AAPLStock #USStocks
⚠️ Perpetual contracts are leveraged derivatives, not the stock or commodity itself.
Not financial advice. Markets are volatile, so use stop-losses and only risk what you can afford to lose.
Yahoo Finance reports the asset is hitting fresh highs, though the outlook suggests further upside potential remains possible.
This AAPLUSDT perpetual contract is currently priced at 355.94 with a 24h change of -0.35%. The current resistance level sits at 356.42. 🎯 👀 🧭
Which level are you watching on the chart and why?
#AAPL #AAPLStock #USStocks
⚠️ Perpetual contracts are leveraged derivatives, not the stock or commodity itself.
Not financial advice. Markets are volatile, so use stop-losses and only risk what you can afford to lose.
56

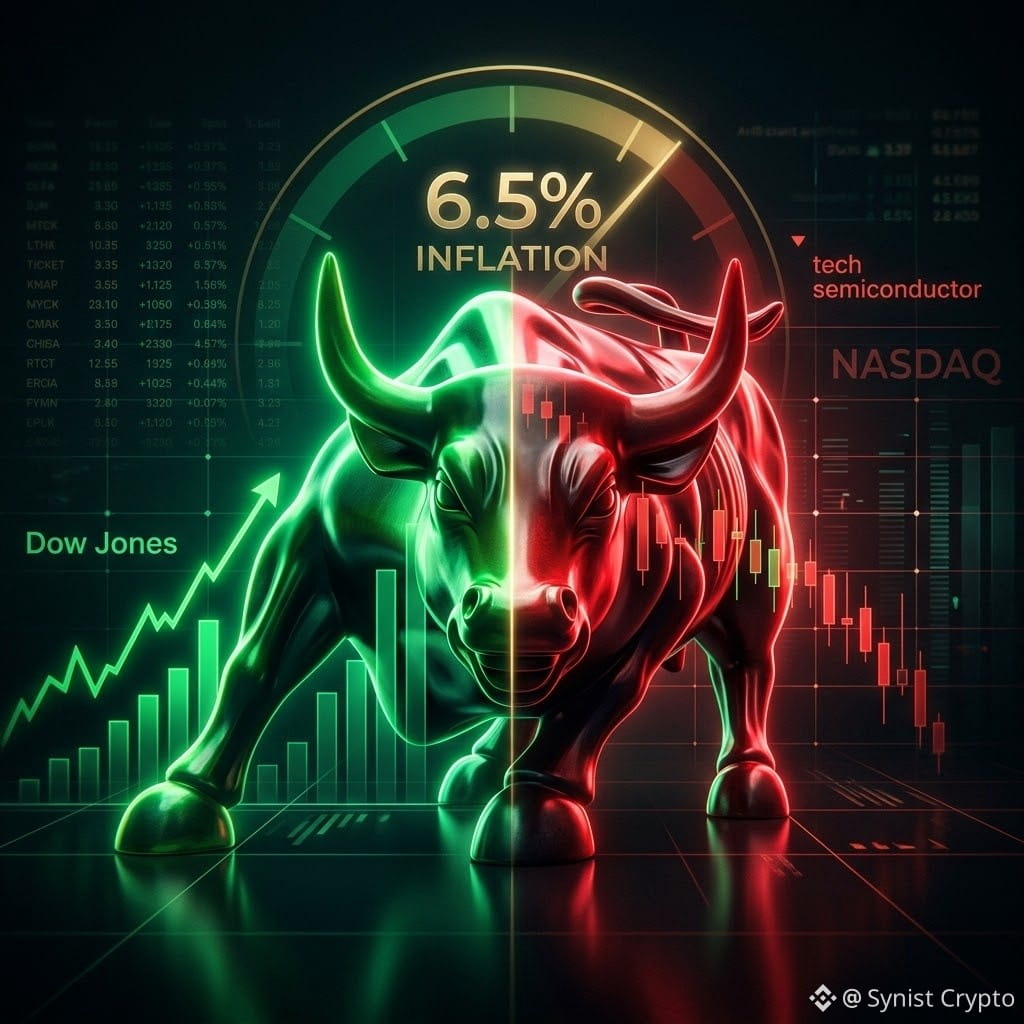
An unusual Friday on Wall Street.
The Dow was almost unchanged (+0.1%) but the Nasdaq and chip stocks were hit hard as October Wholesale Inflation (PPI) rose to 6.5% YoY, the largest increase since 2022. Despite this all three major indices closed positive for the week showing that it’s the tech sector that is taking the brunt.
Whenever the Nasdaq sneezes, $BTC tends to catch a cold. Are you using stocks to determine crypto’s direction or are you switching off Wall Street until December? 👇
$BTC #USStocks #Nasdaq #Inflation #Macro
An unusual Friday on Wall Street.
The Dow was almost unchanged (+0.1%) but the Nasdaq and chip stocks were hit hard as October Wholesale Inflation (PPI) rose to 6.5% YoY, the largest increase since 2022. Despite this all three major indices closed positive for the week showing that it’s the tech sector that is taking the brunt.
Whenever the Nasdaq sneezes, $BTC tends to catch a cold. Are you using stocks to determine crypto’s direction or are you switching off Wall Street until December? 👇
$BTC #USStocks #Nasdaq #Inflation #Macro
The Dow was almost unchanged (+0.1%) but the Nasdaq and chip stocks were hit hard as October Wholesale Inflation (PPI) rose to 6.5% YoY, the largest increase since 2022. Despite this all three major indices closed positive for the week showing that it’s the tech sector that is taking the brunt.
Whenever the Nasdaq sneezes, $BTC tends to catch a cold. Are you using stocks to determine crypto’s direction or are you switching off Wall Street until December? 👇
$BTC #USStocks #Nasdaq #Inflation #Macro
54
🚨 JUST IN: 🇺🇸 INSTITUTIONAL BETS ON US STOCKS SURGE TO $330 BILLION THE SECOND-HIGHEST LEVEL IN HISTORY.
Wall Street's biggest players are heavily positioned for the US equity market.
Institutional net long exposure has surged by $100 BILLION in just six months.
That's just $10 BILLION below the all-time record set in 2024.
Here's the warning investors shouldn't ignore:
Extreme bullish positioning can fuel further upside, but it also creates the risk of crowded trades and aggressive sell-offs if sentiment changes.
Wall Street is betting big on US stocks. But is everyone already on the same side of the trade?
#StockMarket #WallStreet #SP500 #USStocks #GlobalMarkets
🚨 JUST IN: 🇺🇸 INSTITUTIONAL BETS ON US STOCKS SURGE TO $330 BILLION THE SECOND-HIGHEST LEVEL IN HISTORY.
Wall Street's biggest players are heavily positioned for the US equity market.
Institutional net long exposure has surged by $100 BILLION in just six months.
That's just $10 BILLION below the all-time record set in 2024.
Here's the warning investors shouldn't ignore:
Extreme bullish positioning can fuel further upside, but it also creates the risk of crowded trades and aggressive sell-offs if sentiment changes.
Wall Street is betting big on US stocks. But is everyone already on the same side of the trade?
#StockMarket #WallStreet #SP500 #USStocks #GlobalMarkets
Wall Street's biggest players are heavily positioned for the US equity market.
Institutional net long exposure has surged by $100 BILLION in just six months.
That's just $10 BILLION below the all-time record set in 2024.
Here's the warning investors shouldn't ignore:
Extreme bullish positioning can fuel further upside, but it also creates the risk of crowded trades and aggressive sell-offs if sentiment changes.
Wall Street is betting big on US stocks. But is everyone already on the same side of the trade?
#StockMarket #WallStreet #SP500 #USStocks #GlobalMarkets


1
15
·
--
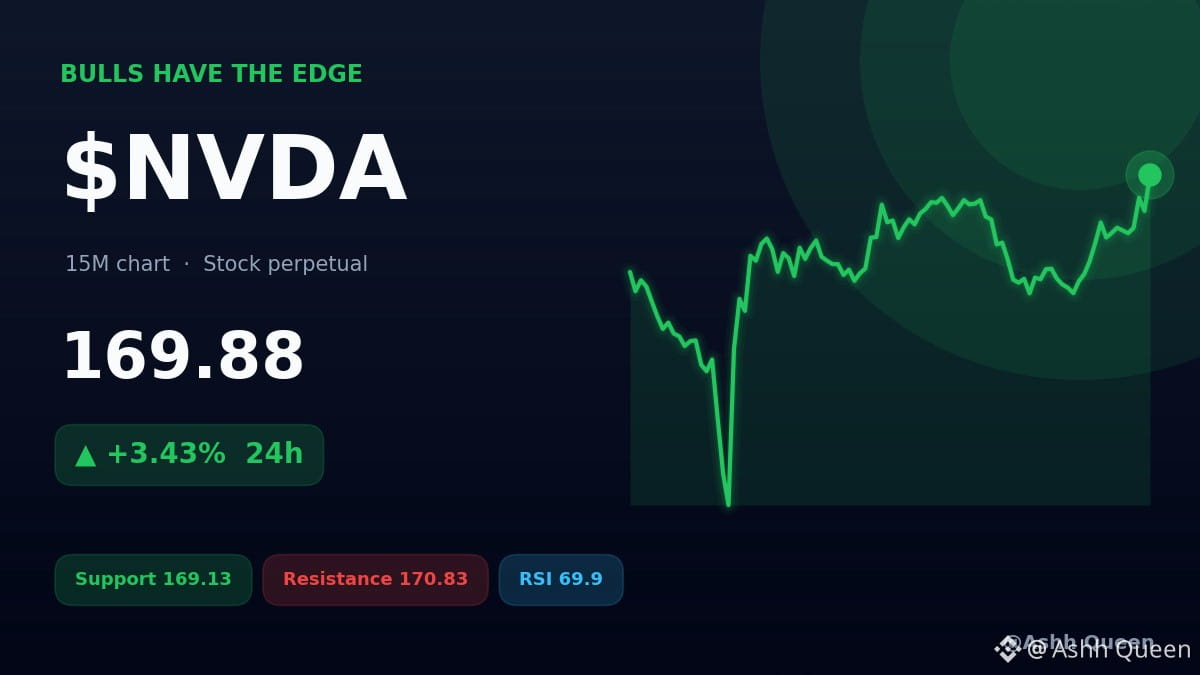
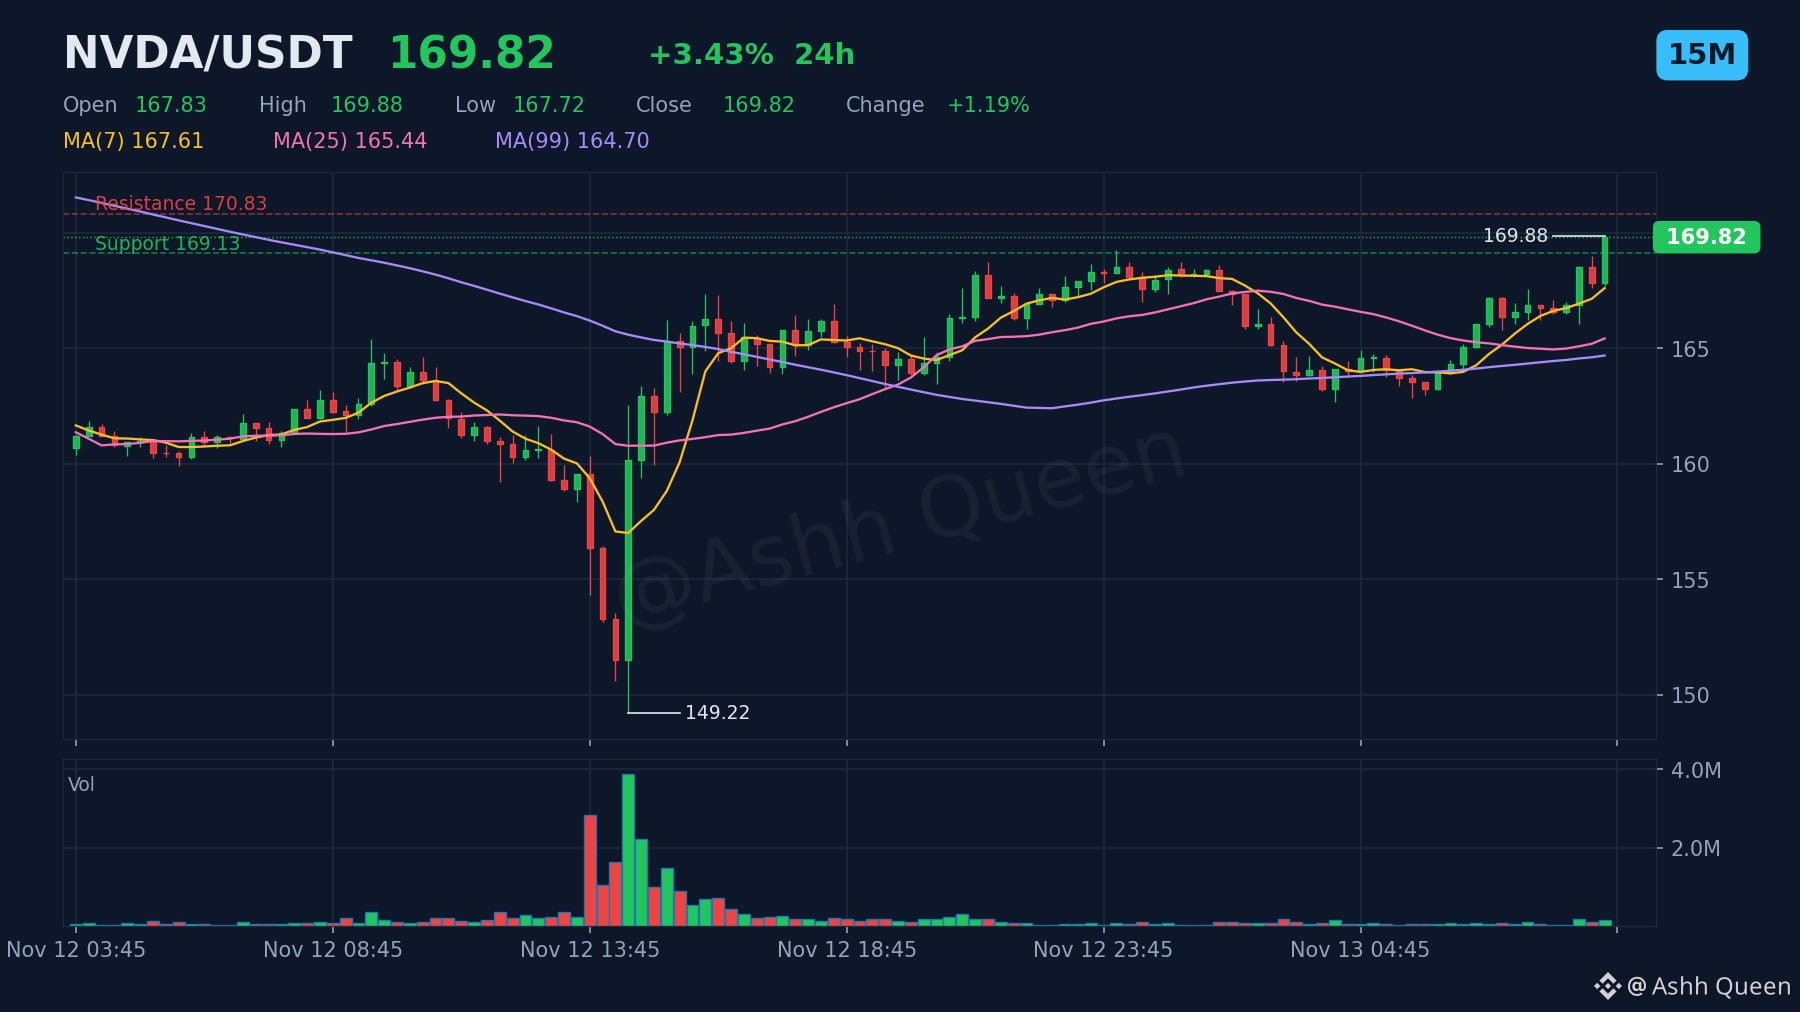
One level traders on $NVDA should not ignore.
We saw a move of +1.76% in the last hour for this perpetual contract. With the price at 169.88, it is holding firmly above support at 169.13 on the 15m chart. ⚔️
If buyers hold this momentum, resistance at 170.83 enters the frame. If the price slips back below support at 169.13, we may see a retest of EMA20 (166.58). 🐂
What data point would change your mind about this current bullish read?
#NVDA #USStocks #HuangExitNvidiaStrategyInFocus
⚠️ Perpetual contracts are leveraged derivatives, not the stock or commodity itself.
DYOR. Size positions carefully and never trade with money you cannot afford to lose.
One level traders on $NVDA should not ignore.
We saw a move of +1.76% in the last hour for this perpetual contract. With the price at 169.88, it is holding firmly above support at 169.13 on the 15m chart. ⚔️
If buyers hold this momentum, resistance at 170.83 enters the frame. If the price slips back below support at 169.13, we may see a retest of EMA20 (166.58). 🐂
What data point would change your mind about this current bullish read?
#NVDA #USStocks #HuangExitNvidiaStrategyInFocus
⚠️ Perpetual contracts are leveraged derivatives, not the stock or commodity itself.
DYOR. Size positions carefully and never trade with money you cannot afford to lose.
We saw a move of +1.76% in the last hour for this perpetual contract. With the price at 169.88, it is holding firmly above support at 169.13 on the 15m chart. ⚔️
If buyers hold this momentum, resistance at 170.83 enters the frame. If the price slips back below support at 169.13, we may see a retest of EMA20 (166.58). 🐂
What data point would change your mind about this current bullish read?
#NVDA #USStocks #HuangExitNvidiaStrategyInFocus
⚠️ Perpetual contracts are leveraged derivatives, not the stock or commodity itself.
DYOR. Size positions carefully and never trade with money you cannot afford to lose.
1
153

Momentum deserves attention when multiple timeframes point together.
Stocks — Top Performance & Trend:
$ARM | $MU | $AMD | SMCI | INTC | ORCL | RDDT | AVGO | HOOD | TSLA
WPO Read:
Arm leads the liquid universe at +12.1% in the latest monitored session and +20.7% across the five-session sample. 5 of the top 5 names are positive, so breadth is broad. Leadership is shared across the top group; volume is 0.9x its recent pace.
Compare the move with company news and the wider market before acting.
#wpo_report #USStocks #MarketResearch
Momentum deserves attention when multiple timeframes point together.
Stocks — Top Performance & Trend:
$ARM | $MU | $AMD | SMCI | INTC | ORCL | RDDT | AVGO | HOOD | TSLA
WPO Read:
Arm leads the liquid universe at +12.1% in the latest monitored session and +20.7% across the five-session sample. 5 of the top 5 names are positive, so breadth is broad. Leadership is shared across the top group; volume is 0.9x its recent pace.
Compare the move with company news and the wider market before acting.
#wpo_report #USStocks #MarketResearch
Stocks — Top Performance & Trend:
$ARM | $MU | $AMD | SMCI | INTC | ORCL | RDDT | AVGO | HOOD | TSLA
WPO Read:
Arm leads the liquid universe at +12.1% in the latest monitored session and +20.7% across the five-session sample. 5 of the top 5 names are positive, so breadth is broad. Leadership is shared across the top group; volume is 0.9x its recent pace.
Compare the move with company news and the wider market before acting.
#wpo_report #USStocks #MarketResearch
2
388
·
--
Verified
Article
What Do You Actually Hold: the US Stock, or the Equity Perpetual?Disclosure: It is not financial advice
A familiar ticker can appear in more than one product. That does not mean you are holding the same thing.
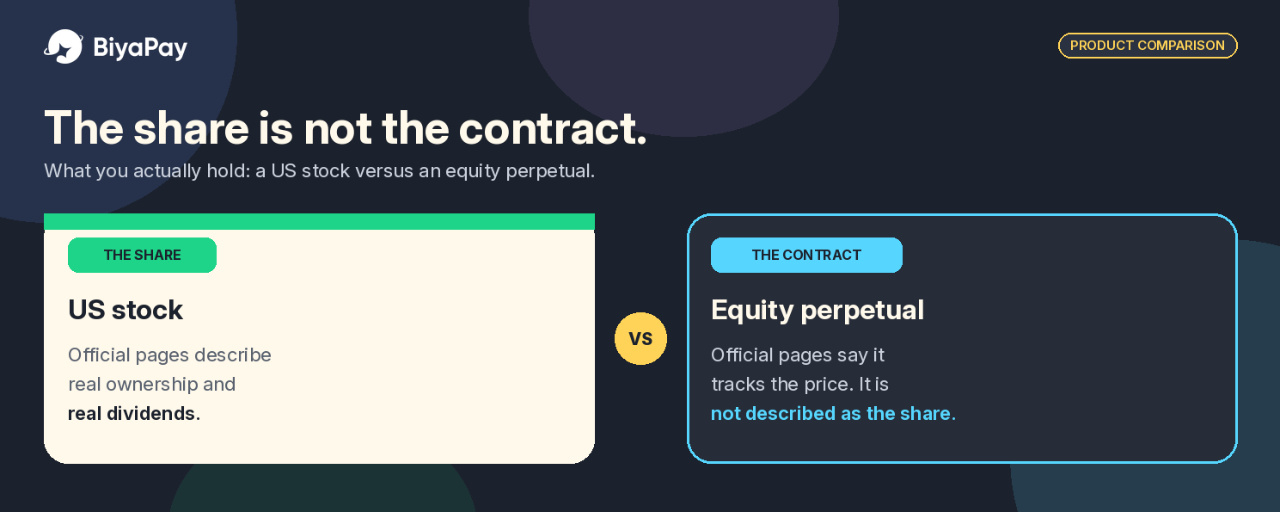
On BiyaPay, you can buy a US stock, and you can also trade an equity perpetual contract that tracks that stock's price. The screen may look related. The holding is not.
I would separate those products before deciding which one matches the intention. This is not a recommendation to use either one. It is a reading of what official pages actually say you hold, and what they do not say.
What official language says about the share
Official product language on BiyaPay describes US and Hong Kong stock trading as real stocks, with real ownership and real dividends, plus 0 commission, instant settlement, and fast fills.
I read that as a description of the stock product, not of every product that happens to show a similar name. A share is presented as ownership of the equity. A contract that tracks the price is not described in those terms.
On dividends, the Help Center is more specific. Purchased US and Hong Kong stocks may receive dividends. Whether a dividend is paid depends on whether the company pays one and whether you meet that company's conditions.
If you hold the stock on the ex-dividend date, dividends are usually paid within 1 to 30 working days after that date, with the timing and amount set by the company's policy and announcement.
I did not find a separate official page that explains how voting is exercised on BiyaPay. Official language does confirm ownership and dividends for the stock product. I would not invent a voting process that the pages do not describe.
The Help Center also says BiyaPay can currently trade all US stocks, including ETFs. The smallest whole-number unit is 1 share, and some stocks support fractional share trading.
What official language says about the equity perpetual
In official listing announcements, BiyaPay describes these contracts in the same pattern: they track the price of the underlying common stock. NVDAUSDT tracks Nvidia (Nasdaq: NVDA). GOOGLUSDT tracks Alphabet (Nasdaq: GOOGL). METAUSDT tracks Meta Platforms (Nasdaq: META).
Later listings use the same wording for other US-listed names, including Netflix, Costco, and Adobe.
That is price tracking. It is not the same as the "real ownership" and "real dividends" language used for the stock product.
I did not find an official statement that a perpetual holder receives the cash dividend of the underlying share, or that the contract carries shareholder rights. If a page does not say it, I would not assume it.
Official risk language on those announcements is blunt. Prices can be volatile, you may lose the amount you put in, and in contract trading, adverse moves can liquidate all of your margin balance.
The stock has defined sessions. The contract's hours are less clearly stated
US stock trading is not an always-open share market. The Help Center says BiyaPay currently supports night trading, pre-market, intraday, and after-hours sessions, and it publishes those windows in Eastern Time:
Night trading: 20:00 to 04:00Pre-market trading: 04:00 to 09:30Intraday trading: 09:30 to 16:00After-hours trading: 16:00 to 20:00
The same page also maps those sessions to Beijing time for daylight saving and standard time. Periods other than intraday trading are called extended trading hours. I would still verify the session on the order ticket, especially around holidays or early closes.
For equity perpetual contracts, I did not find a dedicated official trading-hours page. A separate Help Center article says cryptocurrency contracts can be traded 24 hours a day, but that article is titled for cryptocurrency contracts, not for TradFi equity pairs.
I would not copy that 24-hour statement onto NVDAUSDT or GOOGLUSDT without a page that says so. The practical step is to check the hours, if any, on the contract page itself.
Perpetual contracts are officially described as having no expiration or delivery date. That is about tenor, not a substitute for a trading-hours schedule.
Fees: zero commission and zero trading fees are not the same thing
For US stocks, official materials say the commission item is US$0. That does not mean every cost is zero.
An official fee explanation that cites the Biya Fee Schedule says the platform fee is US$0.005 per share, with a minimum of US$0.99 per order and a maximum of 1 percent of the transaction value. External institution fees, trading activity fees, CAT fees, settlement-related fees, and sell-order charges may also apply.
Fractional orders of less than 1 whole share follow a separate rule: a 1 percent platform fee on transaction value, capped at US$1, with no commission or third-party fees. I would read the fee schedule and the order preview before sending a stock order, especially on a smaller ticket, where the minimum fee is a larger share of the cost.
For TradFi perpetual contracts, BiyaPay announced a 0 Trading Fee Program. During the campaign, maker and taker trading fees on all TradFi perpetual pairs are 0 percent.
The campaign is described as effective immediately and valid long-term, but it applies only to those trading fees. Funding fees and other applicable charges remain subject to the platform's existing rules, and BiyaPay reserves the right to modify, adjust, suspend, or terminate the campaign.
I would not treat 0 percent trading fees as zero cost. Funding is a separate charge. Official contract help describes a funding rate as a fee periodically exchanged between long and short holders, used to keep a perpetual closer to the underlying price.
The TradFi announcement confirms that funding still follows existing rules, but I did not find a TradFi-specific official interval for pairs such as NVDAUSDT or GOOGLUSDT. I would check the funding rate and settlement time on the contract page rather than assume a number.
Leverage and liquidation belong with the contract
A cash purchase of the share and a leveraged contract are different risk shapes.
On the equity perpetual, official listing language already says that in an adverse move, all of your margin balance may be liquidated. That is the point I would not soften. Leverage can make a price swing larger in both directions.
Official contract help says maximum leverage varies by contract and should be checked on the trading page. I did not find an official maximum leverage figure specifically for TradFi equity pairs, so I will not invent one or apply crypto examples such as 100x to these contracts.
There is also a separate stock-margin product that should not be mixed in by accident. The Help Center says a BiyaPay stock account can support underlying stocks and margin trading, and that financing and short selling support up to 4x leverage.
Forced liquidation on the stock side is described for leveraged trading when remaining liquidity is 0, or 0 percent. A cash holding of the share is not the same as a margin stock position, and neither is the same as an equity perpetual.
How I would match the product to the intention
If the intention is to own the company, I would use the stock product and accept its sessions, settlement language, and the fee lines that still apply after 0 commission. That is the product official pages describe with ownership and dividends.
If the intention is to trade the price, with no claim to the share itself, the equity perpetual is the product official pages describe as tracking that price. I would then treat funding, leverage, and liquidation as part of the design, not as fine print to reread later.
I would not hold the contract as a stand-in for the share just because the ticker looks familiar.
A calmer way to choose
The useful split is simple. Official language about real stocks, ownership, and dividends belongs to the share. Official language about tracking the price, trading fees, funding, and margin liquidation belongs to the equity perpetual.
If those columns are kept apart, the choice gets clearer. If they are collapsed into one ticker, it is easy to expect shareholder treatment from a contract, or contract-style access from a share.
This is not a recommendation to buy, sell, or hold any stock or any perpetual contract, and it is not financial advice. Official product descriptions, fees, hours, and risk rules can change. I would re-read the latest product pages, fee schedule, and risk language before acting.
#BiyaPay #USStocks #Perpetuals #TradFi
What Do You Actually Hold: the US Stock, or the Equity Perpetual?
Disclosure: It is not financial advice
A familiar ticker can appear in more than one product. That does not mean you are holding the same thing.
On BiyaPay, you can buy a US stock, and you can also trade an equity perpetual contract that tracks that stock's price. The screen may look related. The holding is not.
I would separate those products before deciding which one matches the intention. This is not a recommendation to use either one. It is a reading of what official pages actually say you hold, and what they do not say.
What official language says about the share
Official product language on BiyaPay describes US and Hong Kong stock trading as real stocks, with real ownership and real dividends, plus 0 commission, instant settlement, and fast fills.
I read that as a description of the stock product, not of every product that happens to show a similar name. A share is presented as ownership of the equity. A contract that tracks the price is not described in those terms.
On dividends, the Help Center is more specific. Purchased US and Hong Kong stocks may receive dividends. Whether a dividend is paid depends on whether the company pays one and whether you meet that company's conditions.
If you hold the stock on the ex-dividend date, dividends are usually paid within 1 to 30 working days after that date, with the timing and amount set by the company's policy and announcement.
I did not find a separate official page that explains how voting is exercised on BiyaPay. Official language does confirm ownership and dividends for the stock product. I would not invent a voting process that the pages do not describe.
The Help Center also says BiyaPay can currently trade all US stocks, including ETFs. The smallest whole-number unit is 1 share, and some stocks support fractional share trading.
What official language says about the equity perpetual
In official listing announcements, BiyaPay describes these contracts in the same pattern: they track the price of the underlying common stock. NVDAUSDT tracks Nvidia (Nasdaq: NVDA). GOOGLUSDT tracks Alphabet (Nasdaq: GOOGL). METAUSDT tracks Meta Platforms (Nasdaq: META).
Later listings use the same wording for other US-listed names, including Netflix, Costco, and Adobe.
That is price tracking. It is not the same as the "real ownership" and "real dividends" language used for the stock product.
I did not find an official statement that a perpetual holder receives the cash dividend of the underlying share, or that the contract carries shareholder rights. If a page does not say it, I would not assume it.
Official risk language on those announcements is blunt. Prices can be volatile, you may lose the amount you put in, and in contract trading, adverse moves can liquidate all of your margin balance.
The stock has defined sessions. The contract's hours are less clearly stated
US stock trading is not an always-open share market. The Help Center says BiyaPay currently supports night trading, pre-market, intraday, and after-hours sessions, and it publishes those windows in Eastern Time:
Night trading: 20:00 to 04:00Pre-market trading: 04:00 to 09:30Intraday trading: 09:30 to 16:00After-hours trading: 16:00 to 20:00
The same page also maps those sessions to Beijing time for daylight saving and standard time. Periods other than intraday trading are called extended trading hours. I would still verify the session on the order ticket, especially around holidays or early closes.
For equity perpetual contracts, I did not find a dedicated official trading-hours page. A separate Help Center article says cryptocurrency contracts can be traded 24 hours a day, but that article is titled for cryptocurrency contracts, not for TradFi equity pairs.
I would not copy that 24-hour statement onto NVDAUSDT or GOOGLUSDT without a page that says so. The practical step is to check the hours, if any, on the contract page itself.
Perpetual contracts are officially described as having no expiration or delivery date. That is about tenor, not a substitute for a trading-hours schedule.
Fees: zero commission and zero trading fees are not the same thing
For US stocks, official materials say the commission item is US$0. That does not mean every cost is zero.
An official fee explanation that cites the Biya Fee Schedule says the platform fee is US$0.005 per share, with a minimum of US$0.99 per order and a maximum of 1 percent of the transaction value. External institution fees, trading activity fees, CAT fees, settlement-related fees, and sell-order charges may also apply.
Fractional orders of less than 1 whole share follow a separate rule: a 1 percent platform fee on transaction value, capped at US$1, with no commission or third-party fees. I would read the fee schedule and the order preview before sending a stock order, especially on a smaller ticket, where the minimum fee is a larger share of the cost.
For TradFi perpetual contracts, BiyaPay announced a 0 Trading Fee Program. During the campaign, maker and taker trading fees on all TradFi perpetual pairs are 0 percent.
The campaign is described as effective immediately and valid long-term, but it applies only to those trading fees. Funding fees and other applicable charges remain subject to the platform's existing rules, and BiyaPay reserves the right to modify, adjust, suspend, or terminate the campaign.
I would not treat 0 percent trading fees as zero cost. Funding is a separate charge. Official contract help describes a funding rate as a fee periodically exchanged between long and short holders, used to keep a perpetual closer to the underlying price.
The TradFi announcement confirms that funding still follows existing rules, but I did not find a TradFi-specific official interval for pairs such as NVDAUSDT or GOOGLUSDT. I would check the funding rate and settlement time on the contract page rather than assume a number.
Leverage and liquidation belong with the contract
A cash purchase of the share and a leveraged contract are different risk shapes.
On the equity perpetual, official listing language already says that in an adverse move, all of your margin balance may be liquidated. That is the point I would not soften. Leverage can make a price swing larger in both directions.
Official contract help says maximum leverage varies by contract and should be checked on the trading page. I did not find an official maximum leverage figure specifically for TradFi equity pairs, so I will not invent one or apply crypto examples such as 100x to these contracts.
There is also a separate stock-margin product that should not be mixed in by accident. The Help Center says a BiyaPay stock account can support underlying stocks and margin trading, and that financing and short selling support up to 4x leverage.
Forced liquidation on the stock side is described for leveraged trading when remaining liquidity is 0, or 0 percent. A cash holding of the share is not the same as a margin stock position, and neither is the same as an equity perpetual.
How I would match the product to the intention
If the intention is to own the company, I would use the stock product and accept its sessions, settlement language, and the fee lines that still apply after 0 commission. That is the product official pages describe with ownership and dividends.
If the intention is to trade the price, with no claim to the share itself, the equity perpetual is the product official pages describe as tracking that price. I would then treat funding, leverage, and liquidation as part of the design, not as fine print to reread later.
I would not hold the contract as a stand-in for the share just because the ticker looks familiar.
A calmer way to choose
The useful split is simple. Official language about real stocks, ownership, and dividends belongs to the share. Official language about tracking the price, trading fees, funding, and margin liquidation belongs to the equity perpetual.
If those columns are kept apart, the choice gets clearer. If they are collapsed into one ticker, it is easy to expect shareholder treatment from a contract, or contract-style access from a share.
This is not a recommendation to buy, sell, or hold any stock or any perpetual contract, and it is not financial advice. Official product descriptions, fees, hours, and risk rules can change. I would re-read the latest product pages, fee schedule, and risk language before acting.
#BiyaPay #USStocks #Perpetuals #TradFi
A familiar ticker can appear in more than one product. That does not mean you are holding the same thing.
On BiyaPay, you can buy a US stock, and you can also trade an equity perpetual contract that tracks that stock's price. The screen may look related. The holding is not.
I would separate those products before deciding which one matches the intention. This is not a recommendation to use either one. It is a reading of what official pages actually say you hold, and what they do not say.
What official language says about the share
Official product language on BiyaPay describes US and Hong Kong stock trading as real stocks, with real ownership and real dividends, plus 0 commission, instant settlement, and fast fills.
I read that as a description of the stock product, not of every product that happens to show a similar name. A share is presented as ownership of the equity. A contract that tracks the price is not described in those terms.
On dividends, the Help Center is more specific. Purchased US and Hong Kong stocks may receive dividends. Whether a dividend is paid depends on whether the company pays one and whether you meet that company's conditions.
If you hold the stock on the ex-dividend date, dividends are usually paid within 1 to 30 working days after that date, with the timing and amount set by the company's policy and announcement.
I did not find a separate official page that explains how voting is exercised on BiyaPay. Official language does confirm ownership and dividends for the stock product. I would not invent a voting process that the pages do not describe.
The Help Center also says BiyaPay can currently trade all US stocks, including ETFs. The smallest whole-number unit is 1 share, and some stocks support fractional share trading.
What official language says about the equity perpetual
In official listing announcements, BiyaPay describes these contracts in the same pattern: they track the price of the underlying common stock. NVDAUSDT tracks Nvidia (Nasdaq: NVDA). GOOGLUSDT tracks Alphabet (Nasdaq: GOOGL). METAUSDT tracks Meta Platforms (Nasdaq: META).
Later listings use the same wording for other US-listed names, including Netflix, Costco, and Adobe.
That is price tracking. It is not the same as the "real ownership" and "real dividends" language used for the stock product.
I did not find an official statement that a perpetual holder receives the cash dividend of the underlying share, or that the contract carries shareholder rights. If a page does not say it, I would not assume it.
Official risk language on those announcements is blunt. Prices can be volatile, you may lose the amount you put in, and in contract trading, adverse moves can liquidate all of your margin balance.
The stock has defined sessions. The contract's hours are less clearly stated
US stock trading is not an always-open share market. The Help Center says BiyaPay currently supports night trading, pre-market, intraday, and after-hours sessions, and it publishes those windows in Eastern Time:
Night trading: 20:00 to 04:00Pre-market trading: 04:00 to 09:30Intraday trading: 09:30 to 16:00After-hours trading: 16:00 to 20:00
The same page also maps those sessions to Beijing time for daylight saving and standard time. Periods other than intraday trading are called extended trading hours. I would still verify the session on the order ticket, especially around holidays or early closes.
For equity perpetual contracts, I did not find a dedicated official trading-hours page. A separate Help Center article says cryptocurrency contracts can be traded 24 hours a day, but that article is titled for cryptocurrency contracts, not for TradFi equity pairs.
I would not copy that 24-hour statement onto NVDAUSDT or GOOGLUSDT without a page that says so. The practical step is to check the hours, if any, on the contract page itself.
Perpetual contracts are officially described as having no expiration or delivery date. That is about tenor, not a substitute for a trading-hours schedule.
Fees: zero commission and zero trading fees are not the same thing
For US stocks, official materials say the commission item is US$0. That does not mean every cost is zero.
An official fee explanation that cites the Biya Fee Schedule says the platform fee is US$0.005 per share, with a minimum of US$0.99 per order and a maximum of 1 percent of the transaction value. External institution fees, trading activity fees, CAT fees, settlement-related fees, and sell-order charges may also apply.
Fractional orders of less than 1 whole share follow a separate rule: a 1 percent platform fee on transaction value, capped at US$1, with no commission or third-party fees. I would read the fee schedule and the order preview before sending a stock order, especially on a smaller ticket, where the minimum fee is a larger share of the cost.
For TradFi perpetual contracts, BiyaPay announced a 0 Trading Fee Program. During the campaign, maker and taker trading fees on all TradFi perpetual pairs are 0 percent.
The campaign is described as effective immediately and valid long-term, but it applies only to those trading fees. Funding fees and other applicable charges remain subject to the platform's existing rules, and BiyaPay reserves the right to modify, adjust, suspend, or terminate the campaign.
I would not treat 0 percent trading fees as zero cost. Funding is a separate charge. Official contract help describes a funding rate as a fee periodically exchanged between long and short holders, used to keep a perpetual closer to the underlying price.
The TradFi announcement confirms that funding still follows existing rules, but I did not find a TradFi-specific official interval for pairs such as NVDAUSDT or GOOGLUSDT. I would check the funding rate and settlement time on the contract page rather than assume a number.
Leverage and liquidation belong with the contract
A cash purchase of the share and a leveraged contract are different risk shapes.
On the equity perpetual, official listing language already says that in an adverse move, all of your margin balance may be liquidated. That is the point I would not soften. Leverage can make a price swing larger in both directions.
Official contract help says maximum leverage varies by contract and should be checked on the trading page. I did not find an official maximum leverage figure specifically for TradFi equity pairs, so I will not invent one or apply crypto examples such as 100x to these contracts.
There is also a separate stock-margin product that should not be mixed in by accident. The Help Center says a BiyaPay stock account can support underlying stocks and margin trading, and that financing and short selling support up to 4x leverage.
Forced liquidation on the stock side is described for leveraged trading when remaining liquidity is 0, or 0 percent. A cash holding of the share is not the same as a margin stock position, and neither is the same as an equity perpetual.
How I would match the product to the intention
If the intention is to own the company, I would use the stock product and accept its sessions, settlement language, and the fee lines that still apply after 0 commission. That is the product official pages describe with ownership and dividends.
If the intention is to trade the price, with no claim to the share itself, the equity perpetual is the product official pages describe as tracking that price. I would then treat funding, leverage, and liquidation as part of the design, not as fine print to reread later.
I would not hold the contract as a stand-in for the share just because the ticker looks familiar.
A calmer way to choose
The useful split is simple. Official language about real stocks, ownership, and dividends belongs to the share. Official language about tracking the price, trading fees, funding, and margin liquidation belongs to the equity perpetual.
If those columns are kept apart, the choice gets clearer. If they are collapsed into one ticker, it is easy to expect shareholder treatment from a contract, or contract-style access from a share.
This is not a recommendation to buy, sell, or hold any stock or any perpetual contract, and it is not financial advice. Official product descriptions, fees, hours, and risk rules can change. I would re-read the latest product pages, fee schedule, and risk language before acting.
#BiyaPay #USStocks #Perpetuals #TradFi
1
1.2k
·
--
Verified
Article
Does the Huang Investigation Change Nvidia's Earnings Case, or Mainly Its Valuation?Disclosure: It is not financial advice
The news around Nvidia this week is serious enough to read carefully. It is also easy to collapse two different questions into one.
The first is whether anything about the business itself has changed: demand for AI chips, revenue, margins, or the ability to ship product. The second is whether investors will pay a different price for the same earnings while they wait for more information.
I would start with what official statements actually confirm, keep unproven reporting in a separate column, and only then decide whether this is an earnings story or a valuation story.
What official statements confirm, and what they do not
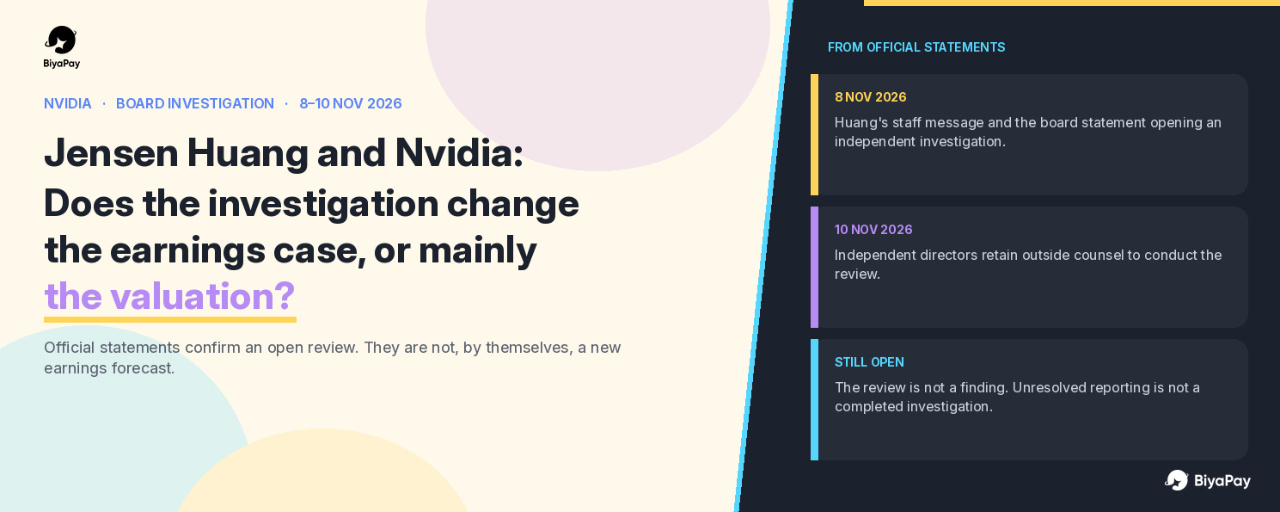
On November 8, 2026, Nvidia published a staff message from founder and CEO Jensen Huang. In that message, Huang apologized and wrote that he was unfaithful to his wife.
He also wrote that Nvidia's board had initiated an independent investigation regarding national security concerns raised in news reports, and that he supports the investigation and will cooperate fully. He said he is fully committed to Nvidia.
The same day, Nvidia's board published its own statement. The board said it is initiating an independent investigation in light of recent reporting that Huang has been the target of a foreign intelligence effort.
A committee of independent directors, assisted by outside independent counsel, will oversee the review.
The board also stated that it has no reason to believe that either national security or Nvidia secrets were compromised, that the inquiry will examine all available information, that Huang fully supports the review, and that the board has confidence in Huang and his leadership team.
On November 10, 2026, the independent members of the board published a short follow-up. They said they have retained former acting U.S. Attorney of the Southern District of New York Joon H. Kim and his firm, Wachtell, Lipton, Rosen and Katz, to conduct a thorough and independent investigation, as announced on Sunday.
CNBC also quoted a company statement saying Huang is committed to continuing as CEO without interruption.
Those are the facts I would treat as confirmed: a personal admission, an open board review, named outside counsel, and a board that has both expressed confidence in current leadership and said it currently has no reason to believe secrets or national security were compromised.
The review is not a finding. The reporting that prompted the inquiry is the reason the board gave for opening it, not a completed investigation, and I would not treat those reports as settled fact.
A pre-market or early headline print can tell you that investors are uneasy. It does not, by itself, tell you whether the company's earnings power has changed, and I would not hang a thesis on one intra-day number.
Earnings first, then the multiple
A controversy can reprice a stock in two ways.
It can change the cash flows people expect, through weaker orders, tighter export rules, slower customer deployment, thinner margins, or a leadership disruption that actually affects operations. Or it can change the multiple people will pay for the same cash flows, because uncertainty, governance questions, and key-person risk make those earnings feel less secure.
Right now, the official record does not show a new earnings figure, a new demand number, or a new export rule that arrived with this news. It shows a personal admission, an investigation, and a board statement that secrets and national security are not, at this stage, believed to have been compromised.
That is why I would treat the first market reaction as more likely a valuation and risk-premium story, unless later facts start to touch the business itself.
That is not an argument that the news is unimportant. Leadership and governance can matter a great deal for a company closely identified with its founder.
If the investigation later affected customer confidence, regulatory treatment, or Huang's role, the earnings case could change. The discipline is sequence: a headline should not automatically rewrite the revenue and margin forecast.
What would actually make me reassess the earnings case
I would keep the watch list short and specific.
Investigation findings. A review that stays consistent with the board's current statement is different from a review that concludes otherwise, or that leads to a leadership change. Until there is a finding, "under investigation" is a reason for caution, not a substitute for evidence.
Leadership continuity. The company has expressed confidence in Huang and said he continues in the role. If that changed, I would ask whether the business still has a clear operating plan and a team that customers and partners will follow, not only whether the stock moved.
Export controls and regulatory scrutiny. Nvidia already operates inside a closely watched policy environment. New or tighter restrictions, or a formal process that actually limits shipments, would be an earnings issue. A news cycle about scrutiny is not yet the same thing.
Customer orders and the next earnings report. Weaker orders, delayed deployments, or a disappointing results update would speak directly to demand and profitability. Those remain the classic tests of the AI-chip thesis, and they still matter more to the long-term case than a single news day.
If none of those items changes, and the only thing that moved is the price investors will pay while they wait, then the controversy has mainly affected valuation. If one of them does change, I would update the earnings case, not just the mood.
How this connects to watching NVDA on BiyaPay
This is not a reason to trade more often. It is a reason to be precise about the product, if the goal is to hold or monitor NVDA exposure while the review is still open.
For the actual share, BiyaPay offers U.S. stock trading with 0 commission. That figure is only the commission line. Official fee explanations on BiyaPay make clear that platform fees and other charges can still apply.
The published U.S. stock platform fee is 0.005 U.S. dollars per share, with a minimum of 0.99 U.S. dollars per order and a maximum of 1 percent of the transaction value. External institution fees, trading activity fees, and other items can also appear, and sell orders may include additional charges.
I would read the fee schedule and the order preview before sending anything, especially on a smaller ticket, where the minimum fee is a larger share of the cost.
That stock route is ownership of the equity, subject to U.S. market hours, settlement, and ordinary market risk. It is the cleaner way to express a view on Nvidia's earnings if that is actually the view.
BiyaPay also lists an NVDAUSDT equity perpetual contract, which tracks the price of Nvidia common stock (Nasdaq: NVDA). Under the platform's TradFi perpetual 0 trading fee program, maker and taker trading fees on TradFi perpetual pairs are 0 percent.
The program is described as effective immediately and valid long-term, but it applies only to those trading fees. Funding fees and other charges still follow existing rules, and the company can modify or end the campaign.
Perpetuals are not the same as holding the stock. Official risk language is blunt: contract prices can move sharply, you can lose the amount you put in, and in an adverse move your margin can be liquidated.
If the story is mainly about a changing multiple, a leveraged perpetual will amplify a valuation swing. That can suit a trader who already accepts that risk.
It is a poor substitute for wanting to own the shares while waiting for the investigation. I would not treat zero trading fees as zero cost, and I would not treat NVDAUSDT as a share of NVDA.
A calmer way to read the week
The useful split is simple. Confirmed facts belong in one column: the admission, the board review, the named counsel, the current statement that secrets or national security are not believed to have been compromised, and the company's position that Huang remains in place.
Unresolved reporting belongs in another: it is why the review exists, and it is still under investigation.
Earnings drivers belong in a third: demand, margins, export rules, orders, and whether leadership continuity later becomes an operating issue.
Until one of those business items changes, I would describe this as a debate about what investors are willing to pay, not as a proven change in Nvidia's earnings power. That can still move the stock. It should not be dressed up as a new fundamental forecast.
This is not a recommendation to buy, sell, or hold NVDA, and it is not financial advice. Official statements, fees, and product rules can change. I would re-read the latest company statements and the latest fee and risk pages before acting.
#BiyaPay #NVDA #Nvidia #USStocks
Does the Huang Investigation Change Nvidia's Earnings Case, or Mainly Its Valuation?
Disclosure: It is not financial advice
The news around Nvidia this week is serious enough to read carefully. It is also easy to collapse two different questions into one.
The first is whether anything about the business itself has changed: demand for AI chips, revenue, margins, or the ability to ship product. The second is whether investors will pay a different price for the same earnings while they wait for more information.
I would start with what official statements actually confirm, keep unproven reporting in a separate column, and only then decide whether this is an earnings story or a valuation story.
What official statements confirm, and what they do not
On November 8, 2026, Nvidia published a staff message from founder and CEO Jensen Huang. In that message, Huang apologized and wrote that he was unfaithful to his wife.
He also wrote that Nvidia's board had initiated an independent investigation regarding national security concerns raised in news reports, and that he supports the investigation and will cooperate fully. He said he is fully committed to Nvidia.
The same day, Nvidia's board published its own statement. The board said it is initiating an independent investigation in light of recent reporting that Huang has been the target of a foreign intelligence effort.
A committee of independent directors, assisted by outside independent counsel, will oversee the review.
The board also stated that it has no reason to believe that either national security or Nvidia secrets were compromised, that the inquiry will examine all available information, that Huang fully supports the review, and that the board has confidence in Huang and his leadership team.
On November 10, 2026, the independent members of the board published a short follow-up. They said they have retained former acting U.S. Attorney of the Southern District of New York Joon H. Kim and his firm, Wachtell, Lipton, Rosen and Katz, to conduct a thorough and independent investigation, as announced on Sunday.
CNBC also quoted a company statement saying Huang is committed to continuing as CEO without interruption.
Those are the facts I would treat as confirmed: a personal admission, an open board review, named outside counsel, and a board that has both expressed confidence in current leadership and said it currently has no reason to believe secrets or national security were compromised.
The review is not a finding. The reporting that prompted the inquiry is the reason the board gave for opening it, not a completed investigation, and I would not treat those reports as settled fact.
A pre-market or early headline print can tell you that investors are uneasy. It does not, by itself, tell you whether the company's earnings power has changed, and I would not hang a thesis on one intra-day number.
Earnings first, then the multiple
A controversy can reprice a stock in two ways.
It can change the cash flows people expect, through weaker orders, tighter export rules, slower customer deployment, thinner margins, or a leadership disruption that actually affects operations. Or it can change the multiple people will pay for the same cash flows, because uncertainty, governance questions, and key-person risk make those earnings feel less secure.
Right now, the official record does not show a new earnings figure, a new demand number, or a new export rule that arrived with this news. It shows a personal admission, an investigation, and a board statement that secrets and national security are not, at this stage, believed to have been compromised.
That is why I would treat the first market reaction as more likely a valuation and risk-premium story, unless later facts start to touch the business itself.
That is not an argument that the news is unimportant. Leadership and governance can matter a great deal for a company closely identified with its founder.
If the investigation later affected customer confidence, regulatory treatment, or Huang's role, the earnings case could change. The discipline is sequence: a headline should not automatically rewrite the revenue and margin forecast.
What would actually make me reassess the earnings case
I would keep the watch list short and specific.
Investigation findings. A review that stays consistent with the board's current statement is different from a review that concludes otherwise, or that leads to a leadership change. Until there is a finding, "under investigation" is a reason for caution, not a substitute for evidence.
Leadership continuity. The company has expressed confidence in Huang and said he continues in the role. If that changed, I would ask whether the business still has a clear operating plan and a team that customers and partners will follow, not only whether the stock moved.
Export controls and regulatory scrutiny. Nvidia already operates inside a closely watched policy environment. New or tighter restrictions, or a formal process that actually limits shipments, would be an earnings issue. A news cycle about scrutiny is not yet the same thing.
Customer orders and the next earnings report. Weaker orders, delayed deployments, or a disappointing results update would speak directly to demand and profitability. Those remain the classic tests of the AI-chip thesis, and they still matter more to the long-term case than a single news day.
If none of those items changes, and the only thing that moved is the price investors will pay while they wait, then the controversy has mainly affected valuation. If one of them does change, I would update the earnings case, not just the mood.
How this connects to watching NVDA on BiyaPay
This is not a reason to trade more often. It is a reason to be precise about the product, if the goal is to hold or monitor NVDA exposure while the review is still open.
For the actual share, BiyaPay offers U.S. stock trading with 0 commission. That figure is only the commission line. Official fee explanations on BiyaPay make clear that platform fees and other charges can still apply.
The published U.S. stock platform fee is 0.005 U.S. dollars per share, with a minimum of 0.99 U.S. dollars per order and a maximum of 1 percent of the transaction value. External institution fees, trading activity fees, and other items can also appear, and sell orders may include additional charges.
I would read the fee schedule and the order preview before sending anything, especially on a smaller ticket, where the minimum fee is a larger share of the cost.
That stock route is ownership of the equity, subject to U.S. market hours, settlement, and ordinary market risk. It is the cleaner way to express a view on Nvidia's earnings if that is actually the view.
BiyaPay also lists an NVDAUSDT equity perpetual contract, which tracks the price of Nvidia common stock (Nasdaq: NVDA). Under the platform's TradFi perpetual 0 trading fee program, maker and taker trading fees on TradFi perpetual pairs are 0 percent.
The program is described as effective immediately and valid long-term, but it applies only to those trading fees. Funding fees and other charges still follow existing rules, and the company can modify or end the campaign.
Perpetuals are not the same as holding the stock. Official risk language is blunt: contract prices can move sharply, you can lose the amount you put in, and in an adverse move your margin can be liquidated.
If the story is mainly about a changing multiple, a leveraged perpetual will amplify a valuation swing. That can suit a trader who already accepts that risk.
It is a poor substitute for wanting to own the shares while waiting for the investigation. I would not treat zero trading fees as zero cost, and I would not treat NVDAUSDT as a share of NVDA.
A calmer way to read the week
The useful split is simple. Confirmed facts belong in one column: the admission, the board review, the named counsel, the current statement that secrets or national security are not believed to have been compromised, and the company's position that Huang remains in place.
Unresolved reporting belongs in another: it is why the review exists, and it is still under investigation.
Earnings drivers belong in a third: demand, margins, export rules, orders, and whether leadership continuity later becomes an operating issue.
Until one of those business items changes, I would describe this as a debate about what investors are willing to pay, not as a proven change in Nvidia's earnings power. That can still move the stock. It should not be dressed up as a new fundamental forecast.
This is not a recommendation to buy, sell, or hold NVDA, and it is not financial advice. Official statements, fees, and product rules can change. I would re-read the latest company statements and the latest fee and risk pages before acting.
#BiyaPay #NVDA #Nvidia #USStocks
The news around Nvidia this week is serious enough to read carefully. It is also easy to collapse two different questions into one.
The first is whether anything about the business itself has changed: demand for AI chips, revenue, margins, or the ability to ship product. The second is whether investors will pay a different price for the same earnings while they wait for more information.
I would start with what official statements actually confirm, keep unproven reporting in a separate column, and only then decide whether this is an earnings story or a valuation story.
What official statements confirm, and what they do not
On November 8, 2026, Nvidia published a staff message from founder and CEO Jensen Huang. In that message, Huang apologized and wrote that he was unfaithful to his wife.
He also wrote that Nvidia's board had initiated an independent investigation regarding national security concerns raised in news reports, and that he supports the investigation and will cooperate fully. He said he is fully committed to Nvidia.
The same day, Nvidia's board published its own statement. The board said it is initiating an independent investigation in light of recent reporting that Huang has been the target of a foreign intelligence effort.
A committee of independent directors, assisted by outside independent counsel, will oversee the review.
The board also stated that it has no reason to believe that either national security or Nvidia secrets were compromised, that the inquiry will examine all available information, that Huang fully supports the review, and that the board has confidence in Huang and his leadership team.
On November 10, 2026, the independent members of the board published a short follow-up. They said they have retained former acting U.S. Attorney of the Southern District of New York Joon H. Kim and his firm, Wachtell, Lipton, Rosen and Katz, to conduct a thorough and independent investigation, as announced on Sunday.
CNBC also quoted a company statement saying Huang is committed to continuing as CEO without interruption.
Those are the facts I would treat as confirmed: a personal admission, an open board review, named outside counsel, and a board that has both expressed confidence in current leadership and said it currently has no reason to believe secrets or national security were compromised.
The review is not a finding. The reporting that prompted the inquiry is the reason the board gave for opening it, not a completed investigation, and I would not treat those reports as settled fact.
A pre-market or early headline print can tell you that investors are uneasy. It does not, by itself, tell you whether the company's earnings power has changed, and I would not hang a thesis on one intra-day number.
Earnings first, then the multiple
A controversy can reprice a stock in two ways.
It can change the cash flows people expect, through weaker orders, tighter export rules, slower customer deployment, thinner margins, or a leadership disruption that actually affects operations. Or it can change the multiple people will pay for the same cash flows, because uncertainty, governance questions, and key-person risk make those earnings feel less secure.
Right now, the official record does not show a new earnings figure, a new demand number, or a new export rule that arrived with this news. It shows a personal admission, an investigation, and a board statement that secrets and national security are not, at this stage, believed to have been compromised.
That is why I would treat the first market reaction as more likely a valuation and risk-premium story, unless later facts start to touch the business itself.
That is not an argument that the news is unimportant. Leadership and governance can matter a great deal for a company closely identified with its founder.
If the investigation later affected customer confidence, regulatory treatment, or Huang's role, the earnings case could change. The discipline is sequence: a headline should not automatically rewrite the revenue and margin forecast.
What would actually make me reassess the earnings case
I would keep the watch list short and specific.
Investigation findings. A review that stays consistent with the board's current statement is different from a review that concludes otherwise, or that leads to a leadership change. Until there is a finding, "under investigation" is a reason for caution, not a substitute for evidence.
Leadership continuity. The company has expressed confidence in Huang and said he continues in the role. If that changed, I would ask whether the business still has a clear operating plan and a team that customers and partners will follow, not only whether the stock moved.
Export controls and regulatory scrutiny. Nvidia already operates inside a closely watched policy environment. New or tighter restrictions, or a formal process that actually limits shipments, would be an earnings issue. A news cycle about scrutiny is not yet the same thing.
Customer orders and the next earnings report. Weaker orders, delayed deployments, or a disappointing results update would speak directly to demand and profitability. Those remain the classic tests of the AI-chip thesis, and they still matter more to the long-term case than a single news day.
If none of those items changes, and the only thing that moved is the price investors will pay while they wait, then the controversy has mainly affected valuation. If one of them does change, I would update the earnings case, not just the mood.
How this connects to watching NVDA on BiyaPay
This is not a reason to trade more often. It is a reason to be precise about the product, if the goal is to hold or monitor NVDA exposure while the review is still open.
For the actual share, BiyaPay offers U.S. stock trading with 0 commission. That figure is only the commission line. Official fee explanations on BiyaPay make clear that platform fees and other charges can still apply.
The published U.S. stock platform fee is 0.005 U.S. dollars per share, with a minimum of 0.99 U.S. dollars per order and a maximum of 1 percent of the transaction value. External institution fees, trading activity fees, and other items can also appear, and sell orders may include additional charges.
I would read the fee schedule and the order preview before sending anything, especially on a smaller ticket, where the minimum fee is a larger share of the cost.
That stock route is ownership of the equity, subject to U.S. market hours, settlement, and ordinary market risk. It is the cleaner way to express a view on Nvidia's earnings if that is actually the view.
BiyaPay also lists an NVDAUSDT equity perpetual contract, which tracks the price of Nvidia common stock (Nasdaq: NVDA). Under the platform's TradFi perpetual 0 trading fee program, maker and taker trading fees on TradFi perpetual pairs are 0 percent.
The program is described as effective immediately and valid long-term, but it applies only to those trading fees. Funding fees and other charges still follow existing rules, and the company can modify or end the campaign.
Perpetuals are not the same as holding the stock. Official risk language is blunt: contract prices can move sharply, you can lose the amount you put in, and in an adverse move your margin can be liquidated.
If the story is mainly about a changing multiple, a leveraged perpetual will amplify a valuation swing. That can suit a trader who already accepts that risk.
It is a poor substitute for wanting to own the shares while waiting for the investigation. I would not treat zero trading fees as zero cost, and I would not treat NVDAUSDT as a share of NVDA.
A calmer way to read the week
The useful split is simple. Confirmed facts belong in one column: the admission, the board review, the named counsel, the current statement that secrets or national security are not believed to have been compromised, and the company's position that Huang remains in place.
Unresolved reporting belongs in another: it is why the review exists, and it is still under investigation.
Earnings drivers belong in a third: demand, margins, export rules, orders, and whether leadership continuity later becomes an operating issue.
Until one of those business items changes, I would describe this as a debate about what investors are willing to pay, not as a proven change in Nvidia's earnings power. That can still move the stock. It should not be dressed up as a new fundamental forecast.
This is not a recommendation to buy, sell, or hold NVDA, and it is not financial advice. Official statements, fees, and product rules can change. I would re-read the latest company statements and the latest fee and risk pages before acting.
#BiyaPay #NVDA #Nvidia #USStocks
300

$INTC INTC 🚀 Just watch Intel! My target is $65, and I'm keeping a close eye on this move. I believe INTC still has plenty of room to run if bullish momentum continues. 📈
Going long on U.S. stocks hits differently! Sometimes patience is all it takes to catch a big opportunity. Who's riding this move with me? 🔥
#INTC #Intel #USStocks #bullish
{future}(INTCUSDT)
$INTC INTC 🚀 Just watch Intel! My target is $65, and I'm keeping a close eye on this move. I believe INTC still has plenty of room to run if bullish momentum continues. 📈
Going long on U.S. stocks hits differently! Sometimes patience is all it takes to catch a big opportunity. Who's riding this move with me? 🔥
#INTC #Intel #USStocks #bullish
Going long on U.S. stocks hits differently! Sometimes patience is all it takes to catch a big opportunity. Who's riding this move with me? 🔥
#INTC #Intel #USStocks #bullish
43
The strongest tape combines performance, participation, and follow-through.
Stocks — Top Performance & Trend:
$AMD | $INTC | $SMCI | SHOP | HOOD | NVDA | TSLA | ARM | RDDT | GOOGL
WPO Read:
AMD leads the liquid universe at +11.0% in the latest monitored session and -11.5% across the five-session sample. 5 of the top 5 names are positive, so breadth is broad. Leadership is shared across the top group; volume is 1.1x its recent pace.
Momentum can reverse quickly, so confirmation matters more than excitement.
#wpo_report #USStocks #MarketResearch
The strongest tape combines performance, participation, and follow-through.
Stocks — Top Performance & Trend:
$AMD | $INTC | $SMCI | SHOP | HOOD | NVDA | TSLA | ARM | RDDT | GOOGL
WPO Read:
AMD leads the liquid universe at +11.0% in the latest monitored session and -11.5% across the five-session sample. 5 of the top 5 names are positive, so breadth is broad. Leadership is shared across the top group; volume is 1.1x its recent pace.
Momentum can reverse quickly, so confirmation matters more than excitement.
#wpo_report #USStocks #MarketResearch
Stocks — Top Performance & Trend:
$AMD | $INTC | $SMCI | SHOP | HOOD | NVDA | TSLA | ARM | RDDT | GOOGL
WPO Read:
AMD leads the liquid universe at +11.0% in the latest monitored session and -11.5% across the five-session sample. 5 of the top 5 names are positive, so breadth is broad. Leadership is shared across the top group; volume is 1.1x its recent pace.
Momentum can reverse quickly, so confirmation matters more than excitement.
#wpo_report #USStocks #MarketResearch
1
272

📈 #USStocks US STOCKS EDGE HIGHER AS TECH REBOUND OFFSETS POLITICAL AND INFLATION PRESSURES
US stock markets are showing signs of recovery as technology shares regain momentum, helping offset concerns about persistent inflation, political uncertainty and the Federal Reserve's interest-rate outlook.
WHAT IS DRIVING THE MARKET?
Technology rebound: Renewed buying in major technology and AI-related stocks is supporting market sentiment.
Inflation concerns: Persistent price pressures could limit the Federal Reserve's ability to reduce interest rates.
Political uncertainty: Policy disagreements and economic uncertainty continue to influence investor confidence.
Investor caution: Markets remain sensitive to corporate earnings, bond yields and expectations for monetary policy.
WHAT HAPPENED ON NOVEMBER 6?
US markets staged a partial recovery on Friday:
Nasdaq: Rose 1.1%, recovering some losses from Thursday.
#S&P500 : Gained 0.3%.
Dow Jones: Fell 0.5%.
#NVIDIA : Rebounded as semiconductor shares recovered.
AMD: Jumped approximately 11%. <Cite refs={["turn316374search0","turn316374search3"]}/>
WHAT COMES NEXT?
Investors are watching October inflation data, Federal Reserve rate expectations and Nvidia's upcoming earnings. Strong employment figures have also increased expectations of a possible December rate hike. <Cite refs={["turn316374news12","turn316374search1"]}/>
GLOBAL MARKET OUTLOOK
The recovery is encouraging, but it does not yet confirm a return to sustained bullish momentum. Technology valuations, AI investment concerns, inflation and interest rates remain important risks.
🌍 #PositiveMindsGlobalResults | Binance Square | INVEST • LEARN • GROW • TOGETHER
📅 November 7, 2026
Stay informed. Think globally. DYOR. Not financial advice.
{spot}(BNBUSDT)
📈 #USStocks US STOCKS EDGE HIGHER AS TECH REBOUND OFFSETS POLITICAL AND INFLATION PRESSURES
US stock markets are showing signs of recovery as technology shares regain momentum, helping offset concerns about persistent inflation, political uncertainty and the Federal Reserve's interest-rate outlook.
WHAT IS DRIVING THE MARKET?
Technology rebound: Renewed buying in major technology and AI-related stocks is supporting market sentiment.
Inflation concerns: Persistent price pressures could limit the Federal Reserve's ability to reduce interest rates.
Political uncertainty: Policy disagreements and economic uncertainty continue to influence investor confidence.
Investor caution: Markets remain sensitive to corporate earnings, bond yields and expectations for monetary policy.
WHAT HAPPENED ON NOVEMBER 6?
US markets staged a partial recovery on Friday:
Nasdaq: Rose 1.1%, recovering some losses from Thursday.
#S&P500 : Gained 0.3%.
Dow Jones: Fell 0.5%.
#NVIDIA : Rebounded as semiconductor shares recovered.
AMD: Jumped approximately 11%. <Cite refs={["turn316374search0","turn316374search3"]}/>
WHAT COMES NEXT?
Investors are watching October inflation data, Federal Reserve rate expectations and Nvidia's upcoming earnings. Strong employment figures have also increased expectations of a possible December rate hike. <Cite refs={["turn316374news12","turn316374search1"]}/>
GLOBAL MARKET OUTLOOK
The recovery is encouraging, but it does not yet confirm a return to sustained bullish momentum. Technology valuations, AI investment concerns, inflation and interest rates remain important risks.
🌍 #PositiveMindsGlobalResults | Binance Square | INVEST • LEARN • GROW • TOGETHER
📅 November 7, 2026
Stay informed. Think globally. DYOR. Not financial advice.
US stock markets are showing signs of recovery as technology shares regain momentum, helping offset concerns about persistent inflation, political uncertainty and the Federal Reserve's interest-rate outlook.
WHAT IS DRIVING THE MARKET?
Technology rebound: Renewed buying in major technology and AI-related stocks is supporting market sentiment.
Inflation concerns: Persistent price pressures could limit the Federal Reserve's ability to reduce interest rates.
Political uncertainty: Policy disagreements and economic uncertainty continue to influence investor confidence.
Investor caution: Markets remain sensitive to corporate earnings, bond yields and expectations for monetary policy.
WHAT HAPPENED ON NOVEMBER 6?
US markets staged a partial recovery on Friday:
Nasdaq: Rose 1.1%, recovering some losses from Thursday.
#S&P500 : Gained 0.3%.
Dow Jones: Fell 0.5%.
#NVIDIA : Rebounded as semiconductor shares recovered.
AMD: Jumped approximately 11%. <Cite refs={["turn316374search0","turn316374search3"]}/>
WHAT COMES NEXT?
Investors are watching October inflation data, Federal Reserve rate expectations and Nvidia's upcoming earnings. Strong employment figures have also increased expectations of a possible December rate hike. <Cite refs={["turn316374news12","turn316374search1"]}/>
GLOBAL MARKET OUTLOOK
The recovery is encouraging, but it does not yet confirm a return to sustained bullish momentum. Technology valuations, AI investment concerns, inflation and interest rates remain important risks.
🌍 #PositiveMindsGlobalResults | Binance Square | INVEST • LEARN • GROW • TOGETHER
📅 November 7, 2026
Stay informed. Think globally. DYOR. Not financial advice.
45

·
--
Bearish
#canusstocksreboundafternonfarmpayrolls?
🚨 CAN US STOCKS REBOUND AFTER NONFARM PAYROLLS? 📊
The latest US Nonfarm Payrolls report could play an important role in determining the next direction of the stock market.
Employment data matters because it gives investors a clearer picture of the US economy and influences expectations around Federal Reserve interest-rate decisions.
📊 What Should Investors Watch?
Stronger job growth: Could support economic confidence, but may also keep interest rates higher for longer.
Weaker job growth: Could increase expectations of rate cuts, although concerns about economic slowdown may pressure stocks.
Wage growth: Rising wages could keep inflation concerns alive and complicate the Fed's decisions.
🔍 Could Stocks Rebound?
A rebound is possible if the employment report provides reassurance that the economy remains stable without creating additional inflation concerns.
However, one report is not enough to confirm a sustained recovery. Treasury yields, inflation expectations, Fed commentary, and corporate earnings will also matter.
₿ What About Crypto?
Bitcoin and other risk assets could react to changes in interest-rate expectations and overall market sentiment. But the relationship is not automatic, and short-term volatility remains possible.
My Take: The key question is not simply whether payrolls beat or miss expectations. It's whether the numbers change the market's outlook for inflation, interest rates, and economic growth.
Smart investors will watch the market's reaction rather than chase the first headline.
#NonFarmPayrolls #USStocks #StockMarket
$BTC $BULLA $AGT
{future}(AGTUSDT)
{future}(BULLAUSDT)
{future}(BTCUSDT)
#canusstocksreboundafternonfarmpayrolls?
🚨 CAN US STOCKS REBOUND AFTER NONFARM PAYROLLS? 📊
The latest US Nonfarm Payrolls report could play an important role in determining the next direction of the stock market.
Employment data matters because it gives investors a clearer picture of the US economy and influences expectations around Federal Reserve interest-rate decisions.
📊 What Should Investors Watch?
Stronger job growth: Could support economic confidence, but may also keep interest rates higher for longer.
Weaker job growth: Could increase expectations of rate cuts, although concerns about economic slowdown may pressure stocks.
Wage growth: Rising wages could keep inflation concerns alive and complicate the Fed's decisions.
🔍 Could Stocks Rebound?
A rebound is possible if the employment report provides reassurance that the economy remains stable without creating additional inflation concerns.
However, one report is not enough to confirm a sustained recovery. Treasury yields, inflation expectations, Fed commentary, and corporate earnings will also matter.
₿ What About Crypto?
Bitcoin and other risk assets could react to changes in interest-rate expectations and overall market sentiment. But the relationship is not automatic, and short-term volatility remains possible.
My Take: The key question is not simply whether payrolls beat or miss expectations. It's whether the numbers change the market's outlook for inflation, interest rates, and economic growth.
Smart investors will watch the market's reaction rather than chase the first headline.
#NonFarmPayrolls #USStocks #StockMarket
$BTC $BULLA $AGT
🚨 CAN US STOCKS REBOUND AFTER NONFARM PAYROLLS? 📊
The latest US Nonfarm Payrolls report could play an important role in determining the next direction of the stock market.
Employment data matters because it gives investors a clearer picture of the US economy and influences expectations around Federal Reserve interest-rate decisions.
📊 What Should Investors Watch?
Stronger job growth: Could support economic confidence, but may also keep interest rates higher for longer.
Weaker job growth: Could increase expectations of rate cuts, although concerns about economic slowdown may pressure stocks.
Wage growth: Rising wages could keep inflation concerns alive and complicate the Fed's decisions.
🔍 Could Stocks Rebound?
A rebound is possible if the employment report provides reassurance that the economy remains stable without creating additional inflation concerns.
However, one report is not enough to confirm a sustained recovery. Treasury yields, inflation expectations, Fed commentary, and corporate earnings will also matter.
₿ What About Crypto?
Bitcoin and other risk assets could react to changes in interest-rate expectations and overall market sentiment. But the relationship is not automatic, and short-term volatility remains possible.
My Take: The key question is not simply whether payrolls beat or miss expectations. It's whether the numbers change the market's outlook for inflation, interest rates, and economic growth.
Smart investors will watch the market's reaction rather than chase the first headline.
#NonFarmPayrolls #USStocks #StockMarket
$BTC $BULLA $AGT
1
442

Article
Why US Stocks Can Suddenly Get “Hammered”When people say US stocks are getting “hammered,” they usually mean prices are falling sharply across major indices, individual stocks, or both. The most important first question is: is this a broad market decline, or are only a few large sectors falling?
I’m unable to confirm the latest live index moves in this response, so this article explains the mechanics behind a sharp US equity selloff rather than attributing it to a specific headline. The most recent completed US trading session should be used as the reference point, since pre-market, after-hours, and intraday moves can look very different.
1. What a Stock-Market Selloff Actually Means
A selloff happens when more investors want to reduce exposure than add it at current prices. Sellers accept lower prices to find buyers, and that process can accelerate quickly.
This does not necessarily mean every company has suddenly become weaker. Stock prices reflect expectations about future profits, interest rates, economic conditions, and investor risk appetite. When those expectations change, prices can reset before company fundamentals visibly change.
A sharp decline can show up in several ways:
Major indices fall together, suggesting broad risk aversion.Growth stocks decline more than defensive sectors, often reflecting higher-rate or valuation concerns.Small-cap stocks fall more than mega-cap companies, which can signal worries about financing conditions or economic growth.A handful of very large technology stocks fall, pulling index levels lower because of their heavy index weight.Volatility rises as investors pay more for downside protection and reduce leveraged positions.
2. Interest Rates: Often the Biggest Immediate Pressure Point
For equities, interest rates matter because they affect both company finances and how investors value future earnings.
When bond yields rise, borrowing can become more expensive for companies and consumers. Higher rates may slow spending, reduce housing activity, raise refinancing costs, and pressure profit margins. They also make safer assets such as government bonds relatively more attractive compared with stocks.
Rates are especially important for growth-oriented companies. Their valuations often rely more heavily on profits expected several years into the future. When investors use a higher discount rate to value those future profits, the present value of those earnings falls.
That is why a rise in yields can sometimes cause technology, software, semiconductor, and other high-growth shares to fall more sharply than slower-growing sectors.
3. Inflation Can Change the Entire Market Narrative
Inflation data can trigger a selloff when it suggests price pressures are not easing as expected.
If inflation is hotter than markets anticipated, investors may conclude that central banks will keep rates higher for longer. In some cases, they may also reduce expectations for future rate cuts. That can lead to a rapid repricing across stocks, bonds, currencies, and crypto markets.
The chain reaction often looks like this:
Inflation data surprises upward.Bond yields rise as markets adjust rate expectations.Equity valuations come under pressure.Rate-sensitive sectors fall more sharply.Volatility increases as traders reduce risk.
The reverse can also happen when inflation cools: yields may fall, and rate-sensitive assets may recover. Neither outcome is guaranteed, because markets also consider growth, earnings, and positioning.
4. Earnings Matter More Than Headlines Over Time
A company’s stock price ultimately depends heavily on what investors expect it can earn in the future.
A disappointing earnings report can hurt a stock even if the company remains profitable. Markets often react most strongly to forward guidance: projected revenue growth, margins, demand conditions, capital expenditure, and management commentary.
A stock can decline when:
Revenue growth slows.Profit margins narrow.Management lowers future guidance.Costs rise faster than sales.Demand weakens in a key product category.Capital spending rises without a clear near-term payoff.Expectations had become too optimistic before the report.
This is why “good earnings” do not always produce a higher stock price. If investors expected exceptional results and received merely solid results, the share price can still fall.
5. Valuation Pressure: Great Companies Can Still Decline
A business can be high quality and still see its share price fall sharply if investors decide the valuation had become too expensive.
Valuation is essentially the price investors are willing to pay for a stream of future earnings. During optimistic periods, investors may pay a premium for companies with strong growth stories. If sentiment shifts, that premium can shrink quickly.
This is particularly visible in companies with:
High price-to-earnings multiples.High price-to-sales multiples.Aggressive future-growth assumptions.Heavy dependence on low interest rates.Large exposure to a fashionable theme, such as artificial intelligence or a fast-growing new technology cycle.
A valuation reset does not automatically mean the underlying business is failing. It means the market is reassessing how much it is willing to pay today for future potential.
6. Economic-Growth Fears Can Spread Across the Market
Stocks can fall if investors become concerned that economic growth will slow materially.
Slower growth can reduce consumer spending, business investment, advertising budgets, travel demand, industrial activity, and corporate profits. Companies with cyclical revenue—such as manufacturers, banks, retailers, transport firms, and commodity-linked businesses—can be particularly sensitive.
Markets often respond before official economic data confirms a slowdown. Investors watch forward-looking indicators such as:
New orders and manufacturing surveys.Consumer confidence.Hiring trends and unemployment claims.Retail-sales trends.Housing activity.Credit conditions.Corporate guidance.
A difficult part of market interpretation is that the same data can point in two directions. Weak economic data may raise recession concerns, but it may also increase hopes for lower interest rates. Which force dominates depends on the broader market backdrop.
7. Sector Concentration Can Make Index Declines Look Worse
US stock indices are not equally weighted collections of companies. Large companies can have an outsized influence on index performance.
If a small group of mega-cap technology or semiconductor companies falls sharply, an index can decline even when many smaller stocks are holding up relatively well. Conversely, an index can appear resilient even if a large number of companies are declining beneath the surface.
This is why market breadth matters.
Useful breadth questions include:
Are most stocks declining, or only the largest names?Are defensive sectors outperforming?Are small-cap stocks weaker than large-cap stocks?Are banks, industrials, and consumer stocks also falling?Are new 52-week lows expanding?Is volatility rising alongside the decline?
Broad weakness suggests a more widespread reduction in risk appetite. Narrow weakness may point more toward a sector-specific earnings, valuation, or positioning issue.
8. Positioning and Leverage Can Turn a Decline Into a Faster Drop
Markets do not move only because of new information. They also move because of where investors are already positioned.
When many traders have similar bullish positions, a negative surprise can lead to rapid selling. Leveraged investors may need to reduce positions if prices fall, which adds further downward pressure. Options hedging can also amplify moves in either direction.
This is often described as a “risk-off” move. It can involve:
Investors taking profits after a strong rally.Funds reducing exposure ahead of major data releases.Leveraged positions being cut.Option dealers hedging changing market exposure.Systematic strategies reducing equity exposure as volatility rises.Investors shifting toward cash, bonds, or defensive sectors.
Positioning can explain why a seemingly modest headline produces an outsized market move. The headline may be the trigger, but crowded positioning can be the amplifier.
9. Geopolitical and Policy Shocks Can Raise Uncertainty
Markets dislike uncertainty because it makes future cash flows harder to estimate.
Trade restrictions, tariff announcements, geopolitical escalation, election-policy uncertainty, fiscal disputes, regulatory changes, or sudden changes in government policy can all affect stocks. The impact varies by sector.
For example:
Trade disruptions can pressure manufacturers, exporters, retailers, and semiconductor supply chains.Higher tariffs can raise costs and potentially increase inflation pressure.Energy-market disruptions can affect transport, industrial, and consumer sectors.Regulatory shifts can have an outsized effect on banks, healthcare companies, technology platforms, or defense-related industries.
The key is to separate a confirmed policy action from speculation about possible policy changes. Markets may react to both, but the certainty level is very different.
10. Why a Selloff Can Feel More Violent Than the Numbers Suggest
Sharp red screens create a strong emotional impression. Investors tend to notice falling prices more intensely than rising prices, especially when large, familiar companies are moving quickly.
Several factors make declines feel especially severe:
News coverage focuses on the largest percentage moves.Social media amplifies dramatic narratives.Large individual-stock declines can overshadow mixed index performance.Intraday reversals can create stress even if the closing decline is smaller.Leveraged products and options can move much more than the underlying index.Investors may focus on portfolio losses rather than the longer market context.
That does not mean the risk is imaginary. It means that price action should be interpreted using breadth, volume, volatility, rates, earnings expectations, and economic data—not only headlines or a single trading session.
11. How to Read the Selloff Without Overreacting
A practical way to understand a sharp decline is to ask five questions:
First: How broad is the weakness?
Check whether major indices, small caps, sector ETFs, and most individual stocks are all declining.
Second: What are bond yields doing?
Rising yields often point toward rate and valuation pressure. Falling yields alongside falling stocks can point more toward growth or recession concerns.
Third: Is there a confirmed catalyst?
Look for dated economic releases, central-bank developments, earnings reports, policy announcements, or clearly identified geopolitical events.
Fourth: Are earnings expectations changing?
A short-term selloff can become more significant if analysts begin cutting revenue or profit forecasts.
Fifth: Is volatility rising?
Higher volatility can indicate that investors are paying more to protect portfolios and that market conditions are becoming less stable.
12. What Would Strengthen or Weaken the “Broad Risk-Off” Explanation
The broad risk-off interpretation becomes more convincing if several signals occur together:
Major US indices decline at the same time.Small-cap shares weaken alongside large caps.High-valuation growth shares underperform.Volatility rises.Credit-sensitive sectors such as banks weaken.Market breadth deteriorates.Investors move toward safer assets.
That interpretation becomes less convincing if the weakness is narrowly concentrated in one industry, one earnings theme, or a few heavily weighted companies while the broader market remains relatively stable.
The above is market analysis and does not constitute investment advice.
#USStocks #UsStocksMarket
Why US Stocks Can Suddenly Get “Hammered”
When people say US stocks are getting “hammered,” they usually mean prices are falling sharply across major indices, individual stocks, or both. The most important first question is: is this a broad market decline, or are only a few large sectors falling?
I’m unable to confirm the latest live index moves in this response, so this article explains the mechanics behind a sharp US equity selloff rather than attributing it to a specific headline. The most recent completed US trading session should be used as the reference point, since pre-market, after-hours, and intraday moves can look very different.
1. What a Stock-Market Selloff Actually Means
A selloff happens when more investors want to reduce exposure than add it at current prices. Sellers accept lower prices to find buyers, and that process can accelerate quickly.
This does not necessarily mean every company has suddenly become weaker. Stock prices reflect expectations about future profits, interest rates, economic conditions, and investor risk appetite. When those expectations change, prices can reset before company fundamentals visibly change.
A sharp decline can show up in several ways:
Major indices fall together, suggesting broad risk aversion.Growth stocks decline more than defensive sectors, often reflecting higher-rate or valuation concerns.Small-cap stocks fall more than mega-cap companies, which can signal worries about financing conditions or economic growth.A handful of very large technology stocks fall, pulling index levels lower because of their heavy index weight.Volatility rises as investors pay more for downside protection and reduce leveraged positions.
2. Interest Rates: Often the Biggest Immediate Pressure Point
For equities, interest rates matter because they affect both company finances and how investors value future earnings.
When bond yields rise, borrowing can become more expensive for companies and consumers. Higher rates may slow spending, reduce housing activity, raise refinancing costs, and pressure profit margins. They also make safer assets such as government bonds relatively more attractive compared with stocks.
Rates are especially important for growth-oriented companies. Their valuations often rely more heavily on profits expected several years into the future. When investors use a higher discount rate to value those future profits, the present value of those earnings falls.
That is why a rise in yields can sometimes cause technology, software, semiconductor, and other high-growth shares to fall more sharply than slower-growing sectors.
3. Inflation Can Change the Entire Market Narrative
Inflation data can trigger a selloff when it suggests price pressures are not easing as expected.
If inflation is hotter than markets anticipated, investors may conclude that central banks will keep rates higher for longer. In some cases, they may also reduce expectations for future rate cuts. That can lead to a rapid repricing across stocks, bonds, currencies, and crypto markets.
The chain reaction often looks like this:
Inflation data surprises upward.Bond yields rise as markets adjust rate expectations.Equity valuations come under pressure.Rate-sensitive sectors fall more sharply.Volatility increases as traders reduce risk.
The reverse can also happen when inflation cools: yields may fall, and rate-sensitive assets may recover. Neither outcome is guaranteed, because markets also consider growth, earnings, and positioning.
4. Earnings Matter More Than Headlines Over Time
A company’s stock price ultimately depends heavily on what investors expect it can earn in the future.
A disappointing earnings report can hurt a stock even if the company remains profitable. Markets often react most strongly to forward guidance: projected revenue growth, margins, demand conditions, capital expenditure, and management commentary.
A stock can decline when:
Revenue growth slows.Profit margins narrow.Management lowers future guidance.Costs rise faster than sales.Demand weakens in a key product category.Capital spending rises without a clear near-term payoff.Expectations had become too optimistic before the report.
This is why “good earnings” do not always produce a higher stock price. If investors expected exceptional results and received merely solid results, the share price can still fall.
5. Valuation Pressure: Great Companies Can Still Decline
A business can be high quality and still see its share price fall sharply if investors decide the valuation had become too expensive.
Valuation is essentially the price investors are willing to pay for a stream of future earnings. During optimistic periods, investors may pay a premium for companies with strong growth stories. If sentiment shifts, that premium can shrink quickly.
This is particularly visible in companies with:
High price-to-earnings multiples.High price-to-sales multiples.Aggressive future-growth assumptions.Heavy dependence on low interest rates.Large exposure to a fashionable theme, such as artificial intelligence or a fast-growing new technology cycle.
A valuation reset does not automatically mean the underlying business is failing. It means the market is reassessing how much it is willing to pay today for future potential.
6. Economic-Growth Fears Can Spread Across the Market
Stocks can fall if investors become concerned that economic growth will slow materially.
Slower growth can reduce consumer spending, business investment, advertising budgets, travel demand, industrial activity, and corporate profits. Companies with cyclical revenue—such as manufacturers, banks, retailers, transport firms, and commodity-linked businesses—can be particularly sensitive.
Markets often respond before official economic data confirms a slowdown. Investors watch forward-looking indicators such as:
New orders and manufacturing surveys.Consumer confidence.Hiring trends and unemployment claims.Retail-sales trends.Housing activity.Credit conditions.Corporate guidance.
A difficult part of market interpretation is that the same data can point in two directions. Weak economic data may raise recession concerns, but it may also increase hopes for lower interest rates. Which force dominates depends on the broader market backdrop.
7. Sector Concentration Can Make Index Declines Look Worse
US stock indices are not equally weighted collections of companies. Large companies can have an outsized influence on index performance.
If a small group of mega-cap technology or semiconductor companies falls sharply, an index can decline even when many smaller stocks are holding up relatively well. Conversely, an index can appear resilient even if a large number of companies are declining beneath the surface.
This is why market breadth matters.
Useful breadth questions include:
Are most stocks declining, or only the largest names?Are defensive sectors outperforming?Are small-cap stocks weaker than large-cap stocks?Are banks, industrials, and consumer stocks also falling?Are new 52-week lows expanding?Is volatility rising alongside the decline?
Broad weakness suggests a more widespread reduction in risk appetite. Narrow weakness may point more toward a sector-specific earnings, valuation, or positioning issue.
8. Positioning and Leverage Can Turn a Decline Into a Faster Drop
Markets do not move only because of new information. They also move because of where investors are already positioned.
When many traders have similar bullish positions, a negative surprise can lead to rapid selling. Leveraged investors may need to reduce positions if prices fall, which adds further downward pressure. Options hedging can also amplify moves in either direction.
This is often described as a “risk-off” move. It can involve:
Investors taking profits after a strong rally.Funds reducing exposure ahead of major data releases.Leveraged positions being cut.Option dealers hedging changing market exposure.Systematic strategies reducing equity exposure as volatility rises.Investors shifting toward cash, bonds, or defensive sectors.
Positioning can explain why a seemingly modest headline produces an outsized market move. The headline may be the trigger, but crowded positioning can be the amplifier.
9. Geopolitical and Policy Shocks Can Raise Uncertainty
Markets dislike uncertainty because it makes future cash flows harder to estimate.
Trade restrictions, tariff announcements, geopolitical escalation, election-policy uncertainty, fiscal disputes, regulatory changes, or sudden changes in government policy can all affect stocks. The impact varies by sector.
For example:
Trade disruptions can pressure manufacturers, exporters, retailers, and semiconductor supply chains.Higher tariffs can raise costs and potentially increase inflation pressure.Energy-market disruptions can affect transport, industrial, and consumer sectors.Regulatory shifts can have an outsized effect on banks, healthcare companies, technology platforms, or defense-related industries.
The key is to separate a confirmed policy action from speculation about possible policy changes. Markets may react to both, but the certainty level is very different.
10. Why a Selloff Can Feel More Violent Than the Numbers Suggest
Sharp red screens create a strong emotional impression. Investors tend to notice falling prices more intensely than rising prices, especially when large, familiar companies are moving quickly.
Several factors make declines feel especially severe:
News coverage focuses on the largest percentage moves.Social media amplifies dramatic narratives.Large individual-stock declines can overshadow mixed index performance.Intraday reversals can create stress even if the closing decline is smaller.Leveraged products and options can move much more than the underlying index.Investors may focus on portfolio losses rather than the longer market context.
That does not mean the risk is imaginary. It means that price action should be interpreted using breadth, volume, volatility, rates, earnings expectations, and economic data—not only headlines or a single trading session.
11. How to Read the Selloff Without Overreacting
A practical way to understand a sharp decline is to ask five questions:
First: How broad is the weakness?
Check whether major indices, small caps, sector ETFs, and most individual stocks are all declining.
Second: What are bond yields doing?
Rising yields often point toward rate and valuation pressure. Falling yields alongside falling stocks can point more toward growth or recession concerns.
Third: Is there a confirmed catalyst?
Look for dated economic releases, central-bank developments, earnings reports, policy announcements, or clearly identified geopolitical events.
Fourth: Are earnings expectations changing?
A short-term selloff can become more significant if analysts begin cutting revenue or profit forecasts.
Fifth: Is volatility rising?
Higher volatility can indicate that investors are paying more to protect portfolios and that market conditions are becoming less stable.
12. What Would Strengthen or Weaken the “Broad Risk-Off” Explanation
The broad risk-off interpretation becomes more convincing if several signals occur together:
Major US indices decline at the same time.Small-cap shares weaken alongside large caps.High-valuation growth shares underperform.Volatility rises.Credit-sensitive sectors such as banks weaken.Market breadth deteriorates.Investors move toward safer assets.
That interpretation becomes less convincing if the weakness is narrowly concentrated in one industry, one earnings theme, or a few heavily weighted companies while the broader market remains relatively stable.
The above is market analysis and does not constitute investment advice.
#USStocks #UsStocksMarket
I’m unable to confirm the latest live index moves in this response, so this article explains the mechanics behind a sharp US equity selloff rather than attributing it to a specific headline. The most recent completed US trading session should be used as the reference point, since pre-market, after-hours, and intraday moves can look very different.
1. What a Stock-Market Selloff Actually Means
A selloff happens when more investors want to reduce exposure than add it at current prices. Sellers accept lower prices to find buyers, and that process can accelerate quickly.
This does not necessarily mean every company has suddenly become weaker. Stock prices reflect expectations about future profits, interest rates, economic conditions, and investor risk appetite. When those expectations change, prices can reset before company fundamentals visibly change.
A sharp decline can show up in several ways:
Major indices fall together, suggesting broad risk aversion.Growth stocks decline more than defensive sectors, often reflecting higher-rate or valuation concerns.Small-cap stocks fall more than mega-cap companies, which can signal worries about financing conditions or economic growth.A handful of very large technology stocks fall, pulling index levels lower because of their heavy index weight.Volatility rises as investors pay more for downside protection and reduce leveraged positions.
2. Interest Rates: Often the Biggest Immediate Pressure Point
For equities, interest rates matter because they affect both company finances and how investors value future earnings.
When bond yields rise, borrowing can become more expensive for companies and consumers. Higher rates may slow spending, reduce housing activity, raise refinancing costs, and pressure profit margins. They also make safer assets such as government bonds relatively more attractive compared with stocks.
Rates are especially important for growth-oriented companies. Their valuations often rely more heavily on profits expected several years into the future. When investors use a higher discount rate to value those future profits, the present value of those earnings falls.
That is why a rise in yields can sometimes cause technology, software, semiconductor, and other high-growth shares to fall more sharply than slower-growing sectors.
3. Inflation Can Change the Entire Market Narrative
Inflation data can trigger a selloff when it suggests price pressures are not easing as expected.
If inflation is hotter than markets anticipated, investors may conclude that central banks will keep rates higher for longer. In some cases, they may also reduce expectations for future rate cuts. That can lead to a rapid repricing across stocks, bonds, currencies, and crypto markets.
The chain reaction often looks like this:
Inflation data surprises upward.Bond yields rise as markets adjust rate expectations.Equity valuations come under pressure.Rate-sensitive sectors fall more sharply.Volatility increases as traders reduce risk.
The reverse can also happen when inflation cools: yields may fall, and rate-sensitive assets may recover. Neither outcome is guaranteed, because markets also consider growth, earnings, and positioning.
4. Earnings Matter More Than Headlines Over Time
A company’s stock price ultimately depends heavily on what investors expect it can earn in the future.
A disappointing earnings report can hurt a stock even if the company remains profitable. Markets often react most strongly to forward guidance: projected revenue growth, margins, demand conditions, capital expenditure, and management commentary.
A stock can decline when:
Revenue growth slows.Profit margins narrow.Management lowers future guidance.Costs rise faster than sales.Demand weakens in a key product category.Capital spending rises without a clear near-term payoff.Expectations had become too optimistic before the report.
This is why “good earnings” do not always produce a higher stock price. If investors expected exceptional results and received merely solid results, the share price can still fall.
5. Valuation Pressure: Great Companies Can Still Decline
A business can be high quality and still see its share price fall sharply if investors decide the valuation had become too expensive.
Valuation is essentially the price investors are willing to pay for a stream of future earnings. During optimistic periods, investors may pay a premium for companies with strong growth stories. If sentiment shifts, that premium can shrink quickly.
This is particularly visible in companies with:
High price-to-earnings multiples.High price-to-sales multiples.Aggressive future-growth assumptions.Heavy dependence on low interest rates.Large exposure to a fashionable theme, such as artificial intelligence or a fast-growing new technology cycle.
A valuation reset does not automatically mean the underlying business is failing. It means the market is reassessing how much it is willing to pay today for future potential.
6. Economic-Growth Fears Can Spread Across the Market
Stocks can fall if investors become concerned that economic growth will slow materially.
Slower growth can reduce consumer spending, business investment, advertising budgets, travel demand, industrial activity, and corporate profits. Companies with cyclical revenue—such as manufacturers, banks, retailers, transport firms, and commodity-linked businesses—can be particularly sensitive.
Markets often respond before official economic data confirms a slowdown. Investors watch forward-looking indicators such as:
New orders and manufacturing surveys.Consumer confidence.Hiring trends and unemployment claims.Retail-sales trends.Housing activity.Credit conditions.Corporate guidance.
A difficult part of market interpretation is that the same data can point in two directions. Weak economic data may raise recession concerns, but it may also increase hopes for lower interest rates. Which force dominates depends on the broader market backdrop.
7. Sector Concentration Can Make Index Declines Look Worse
US stock indices are not equally weighted collections of companies. Large companies can have an outsized influence on index performance.
If a small group of mega-cap technology or semiconductor companies falls sharply, an index can decline even when many smaller stocks are holding up relatively well. Conversely, an index can appear resilient even if a large number of companies are declining beneath the surface.
This is why market breadth matters.
Useful breadth questions include:
Are most stocks declining, or only the largest names?Are defensive sectors outperforming?Are small-cap stocks weaker than large-cap stocks?Are banks, industrials, and consumer stocks also falling?Are new 52-week lows expanding?Is volatility rising alongside the decline?
Broad weakness suggests a more widespread reduction in risk appetite. Narrow weakness may point more toward a sector-specific earnings, valuation, or positioning issue.
8. Positioning and Leverage Can Turn a Decline Into a Faster Drop
Markets do not move only because of new information. They also move because of where investors are already positioned.
When many traders have similar bullish positions, a negative surprise can lead to rapid selling. Leveraged investors may need to reduce positions if prices fall, which adds further downward pressure. Options hedging can also amplify moves in either direction.
This is often described as a “risk-off” move. It can involve:
Investors taking profits after a strong rally.Funds reducing exposure ahead of major data releases.Leveraged positions being cut.Option dealers hedging changing market exposure.Systematic strategies reducing equity exposure as volatility rises.Investors shifting toward cash, bonds, or defensive sectors.
Positioning can explain why a seemingly modest headline produces an outsized market move. The headline may be the trigger, but crowded positioning can be the amplifier.
9. Geopolitical and Policy Shocks Can Raise Uncertainty
Markets dislike uncertainty because it makes future cash flows harder to estimate.
Trade restrictions, tariff announcements, geopolitical escalation, election-policy uncertainty, fiscal disputes, regulatory changes, or sudden changes in government policy can all affect stocks. The impact varies by sector.
For example:
Trade disruptions can pressure manufacturers, exporters, retailers, and semiconductor supply chains.Higher tariffs can raise costs and potentially increase inflation pressure.Energy-market disruptions can affect transport, industrial, and consumer sectors.Regulatory shifts can have an outsized effect on banks, healthcare companies, technology platforms, or defense-related industries.
The key is to separate a confirmed policy action from speculation about possible policy changes. Markets may react to both, but the certainty level is very different.
10. Why a Selloff Can Feel More Violent Than the Numbers Suggest
Sharp red screens create a strong emotional impression. Investors tend to notice falling prices more intensely than rising prices, especially when large, familiar companies are moving quickly.
Several factors make declines feel especially severe:
News coverage focuses on the largest percentage moves.Social media amplifies dramatic narratives.Large individual-stock declines can overshadow mixed index performance.Intraday reversals can create stress even if the closing decline is smaller.Leveraged products and options can move much more than the underlying index.Investors may focus on portfolio losses rather than the longer market context.
That does not mean the risk is imaginary. It means that price action should be interpreted using breadth, volume, volatility, rates, earnings expectations, and economic data—not only headlines or a single trading session.
11. How to Read the Selloff Without Overreacting
A practical way to understand a sharp decline is to ask five questions:
First: How broad is the weakness?
Check whether major indices, small caps, sector ETFs, and most individual stocks are all declining.
Second: What are bond yields doing?
Rising yields often point toward rate and valuation pressure. Falling yields alongside falling stocks can point more toward growth or recession concerns.
Third: Is there a confirmed catalyst?
Look for dated economic releases, central-bank developments, earnings reports, policy announcements, or clearly identified geopolitical events.
Fourth: Are earnings expectations changing?
A short-term selloff can become more significant if analysts begin cutting revenue or profit forecasts.
Fifth: Is volatility rising?
Higher volatility can indicate that investors are paying more to protect portfolios and that market conditions are becoming less stable.
12. What Would Strengthen or Weaken the “Broad Risk-Off” Explanation
The broad risk-off interpretation becomes more convincing if several signals occur together:
Major US indices decline at the same time.Small-cap shares weaken alongside large caps.High-valuation growth shares underperform.Volatility rises.Credit-sensitive sectors such as banks weaken.Market breadth deteriorates.Investors move toward safer assets.
That interpretation becomes less convincing if the weakness is narrowly concentrated in one industry, one earnings theme, or a few heavily weighted companies while the broader market remains relatively stable.
The above is market analysis and does not constitute investment advice.
#USStocks #UsStocksMarket
3
193

·
--
#canusstocksreboundafternonfarmpayrolls?
📊 NFP just crushed forecasts — but stocks aren't cheering.
October payrolls: +165K vs ~65K expected (Reuters poll). Unemployment fell to 4.1% (exp. 4.2%). Wages +0.4% m/m, 3.1% y/y. Aug/Sep were revised up by a combined 84K.
⚡ Market reaction: Nasdaq 100 futures held a ~1.4% gain, S&P futures faded, Dow futures fell ~1%. CME FedWatch put a December hike at ~77%, up from ~68% before the data.
🧠 My read: it's "good news = bad news." Thursday's Nasdaq -5.5% rout was about AI/data-center fears, not jobs. A hot labor market keeps the Fed focused on inflation, so higher yields can cap a tech rebound.
₿ For crypto: BTC hovered near $76K after the print, so macro still drives the tape.
🔎 Watch next: CPI/PPI next week, Treasury yields, and whether chip stocks stabilize.
Bottom line: a dip-buy bounce is possible, but a lasting rebound needs AI stocks to stop sliding. Are you buying the dip or waiting for CPI? 👇
$BTC
{future}(BTCUSDT)
$QQQ
{spot}(QQQBUSDT)
$SPYB
{spot}(SPYBUSDT)
#NFP #FederalReserve #USStocks
Not financial advice.
#canusstocksreboundafternonfarmpayrolls?
📊 NFP just crushed forecasts — but stocks aren't cheering.
October payrolls: +165K vs ~65K expected (Reuters poll). Unemployment fell to 4.1% (exp. 4.2%). Wages +0.4% m/m, 3.1% y/y. Aug/Sep were revised up by a combined 84K.
⚡ Market reaction: Nasdaq 100 futures held a ~1.4% gain, S&P futures faded, Dow futures fell ~1%. CME FedWatch put a December hike at ~77%, up from ~68% before the data.
🧠 My read: it's "good news = bad news." Thursday's Nasdaq -5.5% rout was about AI/data-center fears, not jobs. A hot labor market keeps the Fed focused on inflation, so higher yields can cap a tech rebound.
₿ For crypto: BTC hovered near $76K after the print, so macro still drives the tape.
🔎 Watch next: CPI/PPI next week, Treasury yields, and whether chip stocks stabilize.
Bottom line: a dip-buy bounce is possible, but a lasting rebound needs AI stocks to stop sliding. Are you buying the dip or waiting for CPI? 👇
$BTC
$QQQ
$SPYB
#NFP #FederalReserve #USStocks
Not financial advice.
📊 NFP just crushed forecasts — but stocks aren't cheering.
October payrolls: +165K vs ~65K expected (Reuters poll). Unemployment fell to 4.1% (exp. 4.2%). Wages +0.4% m/m, 3.1% y/y. Aug/Sep were revised up by a combined 84K.
⚡ Market reaction: Nasdaq 100 futures held a ~1.4% gain, S&P futures faded, Dow futures fell ~1%. CME FedWatch put a December hike at ~77%, up from ~68% before the data.
🧠 My read: it's "good news = bad news." Thursday's Nasdaq -5.5% rout was about AI/data-center fears, not jobs. A hot labor market keeps the Fed focused on inflation, so higher yields can cap a tech rebound.
₿ For crypto: BTC hovered near $76K after the print, so macro still drives the tape.
🔎 Watch next: CPI/PPI next week, Treasury yields, and whether chip stocks stabilize.
Bottom line: a dip-buy bounce is possible, but a lasting rebound needs AI stocks to stop sliding. Are you buying the dip or waiting for CPI? 👇
$BTC
$QQQ
$SPYB
#NFP #FederalReserve #USStocks
Not financial advice.
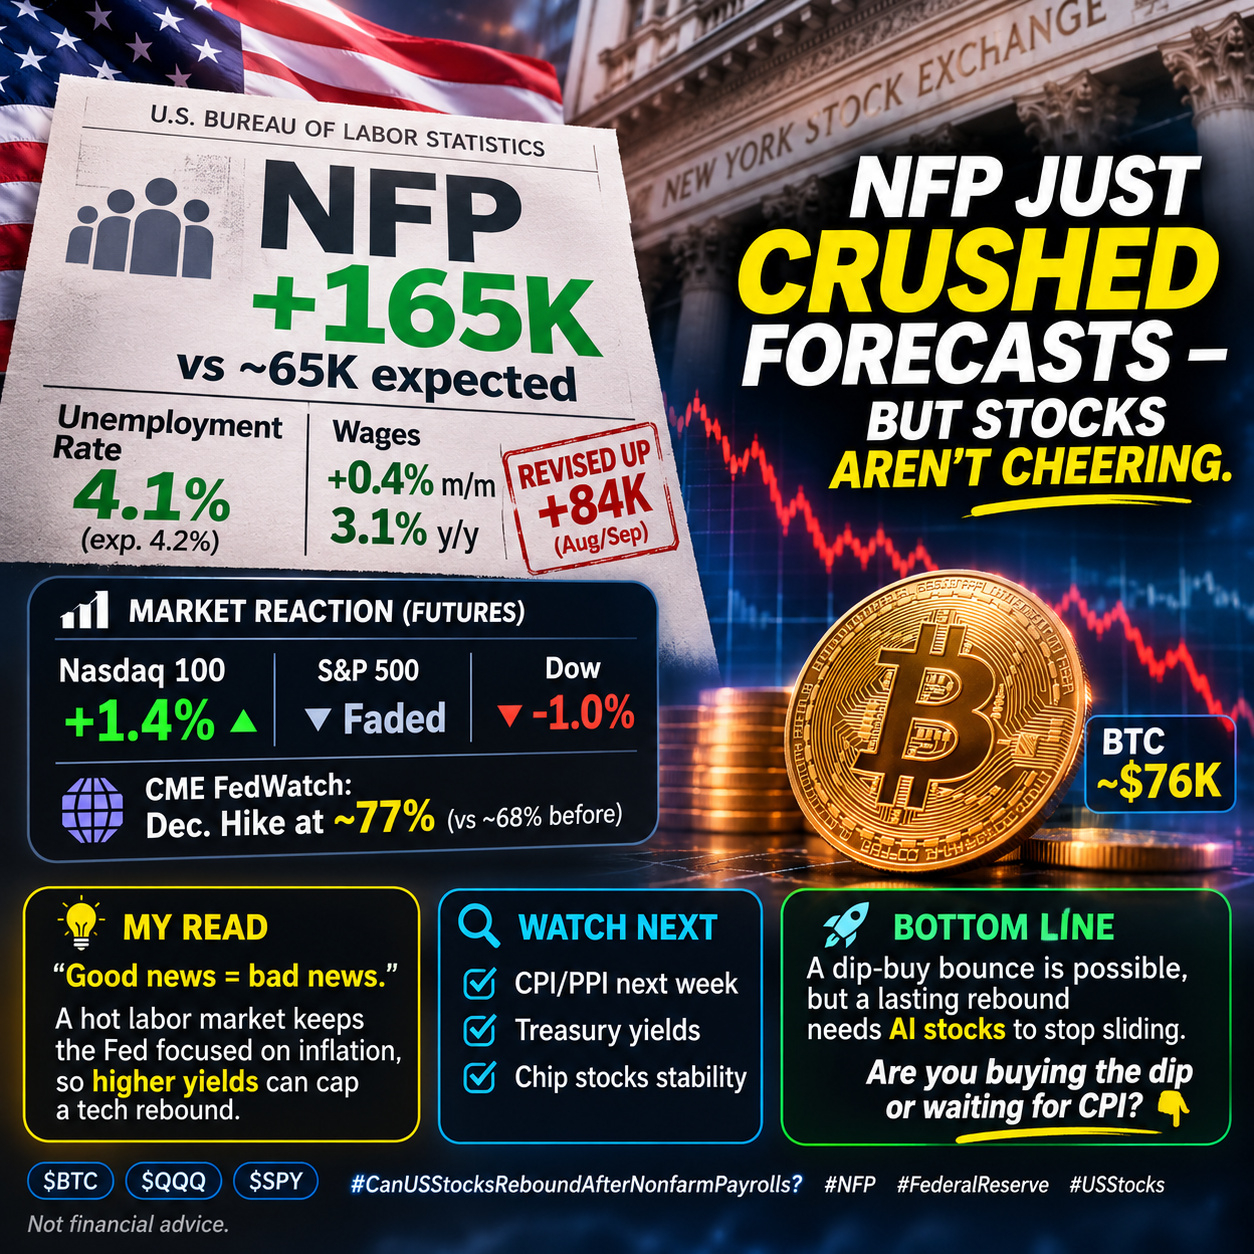
369
·
--
#CanUSStocksReboundAfterNonfarmPayrolls?
The latest US Nonfarm Payrolls report has delivered a stronger-than-expected surprise, adding a new dimension to market expectations.
October Jobs Report:
• Nonfarm Payrolls: +165,000 (vs. 65,000 expected)
• Unemployment Rate: 4.1% (down from 4.2%)
• September job gains were also revised higher.
At first glance, stronger employment signals economic resilience. However, there's another side to consider.
A stronger labor market could reduce the Federal Reserve's urgency to ease monetary policy or increase expectations of tighter policy. Higher interest-rate expectations can put pressure on growth stocks, particularly technology shares.
What happens next?
A stable economic outlook could help restore investor confidence.
Changing Fed rate expectations may keep volatility elevated.
Technology stocks and Treasury yields will remain important indicators to watch.
The key question is whether investors interpret stronger employment as economic strength or a reason to worry about interest rates.
What's your outlook for US equities?
1. Strong recovery
2. Sideways consolidation
3. Further correction
Share your market perspective below!
#USStocks #NonfarmPayrolls #FederalReserve #BinanceSquareTalks #CryptoMarket
#CanUSStocksReboundAfterNonfarmPayrolls?
The latest US Nonfarm Payrolls report has delivered a stronger-than-expected surprise, adding a new dimension to market expectations.
October Jobs Report:
• Nonfarm Payrolls: +165,000 (vs. 65,000 expected)
• Unemployment Rate: 4.1% (down from 4.2%)
• September job gains were also revised higher.
At first glance, stronger employment signals economic resilience. However, there's another side to consider.
A stronger labor market could reduce the Federal Reserve's urgency to ease monetary policy or increase expectations of tighter policy. Higher interest-rate expectations can put pressure on growth stocks, particularly technology shares.
What happens next?
A stable economic outlook could help restore investor confidence.
Changing Fed rate expectations may keep volatility elevated.
Technology stocks and Treasury yields will remain important indicators to watch.
The key question is whether investors interpret stronger employment as economic strength or a reason to worry about interest rates.
What's your outlook for US equities?
1. Strong recovery
2. Sideways consolidation
3. Further correction
Share your market perspective below!
#USStocks #NonfarmPayrolls #FederalReserve #BinanceSquareTalks #CryptoMarket
The latest US Nonfarm Payrolls report has delivered a stronger-than-expected surprise, adding a new dimension to market expectations.
October Jobs Report:
• Nonfarm Payrolls: +165,000 (vs. 65,000 expected)
• Unemployment Rate: 4.1% (down from 4.2%)
• September job gains were also revised higher.
At first glance, stronger employment signals economic resilience. However, there's another side to consider.
A stronger labor market could reduce the Federal Reserve's urgency to ease monetary policy or increase expectations of tighter policy. Higher interest-rate expectations can put pressure on growth stocks, particularly technology shares.
What happens next?
A stable economic outlook could help restore investor confidence.
Changing Fed rate expectations may keep volatility elevated.
Technology stocks and Treasury yields will remain important indicators to watch.
The key question is whether investors interpret stronger employment as economic strength or a reason to worry about interest rates.
What's your outlook for US equities?
1. Strong recovery
2. Sideways consolidation
3. Further correction
Share your market perspective below!
#USStocks #NonfarmPayrolls #FederalReserve #BinanceSquareTalks #CryptoMarket
66

·
--
Bullish
#crytoma🚨 US Stocks Slip as Crypto Market Faces Broad Pressure!
The global financial market is experiencing a major sell-off.
US stocks declined sharply, while $BITCOIN , Ethereum and other major cryptocurrencies also faced heavy selling pressure.
What's happening?
📉 Nasdaq dropped 5.5%.
📉 S&P 500 fell around 4.4%.
📉 $BITCOIN moved towards $76,000.
📉$ETH lost around 7.7%.
Main Reasons:
- Growing concerns about AI regulations.
- Heavy selling in technology stocks.
- Weak investor confidence.
- Massive crypto liquidations.
What's Next?
Investors are watching Bitcoin's recovery and the US economic data for the next market direction.
Will crypto recover, or is more downside ahead?
Share your thoughts! 👇
#CrytoMarketWatch #USStocks #BTC #ETH #BinanceSquare
{spot}(BTCUSDT)
{spot}(ETHUSDT)
{spot}(DOGEUSDT)
#crytoma🚨 US Stocks Slip as Crypto Market Faces Broad Pressure!
The global financial market is experiencing a major sell-off.
US stocks declined sharply, while $BITCOIN , Ethereum and other major cryptocurrencies also faced heavy selling pressure.
What's happening?
📉 Nasdaq dropped 5.5%.
📉 S&P 500 fell around 4.4%.
📉 $BITCOIN moved towards $76,000.
📉$ETH lost around 7.7%.
Main Reasons:
- Growing concerns about AI regulations.
- Heavy selling in technology stocks.
- Weak investor confidence.
- Massive crypto liquidations.
What's Next?
Investors are watching Bitcoin's recovery and the US economic data for the next market direction.
Will crypto recover, or is more downside ahead?
Share your thoughts! 👇
#CrytoMarketWatch #USStocks #BTC #ETH #BinanceSquare
The global financial market is experiencing a major sell-off.
US stocks declined sharply, while $BITCOIN , Ethereum and other major cryptocurrencies also faced heavy selling pressure.
What's happening?
📉 Nasdaq dropped 5.5%.
📉 S&P 500 fell around 4.4%.
📉 $BITCOIN moved towards $76,000.
📉$ETH lost around 7.7%.
Main Reasons:
- Growing concerns about AI regulations.
- Heavy selling in technology stocks.
- Weak investor confidence.
- Massive crypto liquidations.
What's Next?
Investors are watching Bitcoin's recovery and the US economic data for the next market direction.
Will crypto recover, or is more downside ahead?
Share your thoughts! 👇
#CrytoMarketWatch #USStocks #BTC #ETH #BinanceSquare
1
77

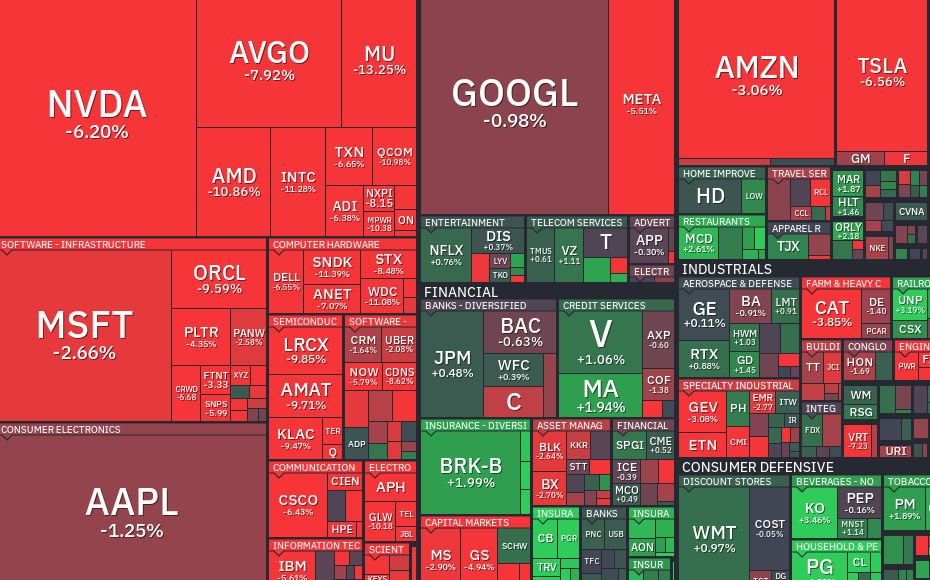
Log in to explore more content
Join global crypto users on Binance Square
⚡️ Get latest and useful information about crypto.
💬 Trusted by the world’s largest crypto exchange.
👍 Discover real insights from verified creators.
Email / Phone number
Trending Topics
1
#WhoWillSucceedJensenHuangatNvidia?
38,706 views
567 Discussing
2
#WhatWillDriveCryptoandStocks’NextRebound?
353,520 views
2,532 Discussing
3
#USPPIMissMayEaseBTCPressure
161,930 views
1,778 Discussing
4
#TONStrategyReports$23.97MQ3NetLoss
1,791 views
28 Discussing
5
#PolkadotCommunityApprovesNewStrategyWith97%Vote
9,156 views
157 Discussing
6
#dYdXPlansV9.9UpgradeToShiftUSDCToInjective
4,766 views
132 Discussing
7
#TradFiForBeginners
677,474 views
4,411 Discussing
8
#MANTRAPausesUnstakingFor7DaysAfterKeplrSecurityIncident
2,956 views
45 Discussing
9
#BitcoinCoreDisclosesTorTrafficVulnerability
71,003 views
967 Discussing
10
#BitcoinBreaksBelow200WeekMovingAverage
161,478 views
991 Discussing