

#iren
iren
38,440 views
773 Discussing
Hot
Latest

🚀 $IREN UNLEASHES $363M GPU‑FUELED FINANCING BOOST 🟢
🦈 Smart money is tapping the GPU vault, locking $363M into a debt line that rides existing revenue streams. 📊 No dilution, no share dump—just pure infrastructure leverage that sidesteps the AI‑lending hype. 🌊 This move lets $IREN double‑down on its next buildout while the market watches the liquidity tide rise.
💡 With multi‑year contracts already feeding the GPUs, the balance sheet now reads like a fortified bunker ready for the next wave of AI demand. 💬 Are you loading up on $IREN as the capital engine roars to life? 👇
⚠️ Not financial advice. Always manage your risk. 🛡️
🏷️ #IREN #AIInfrastructure #Funding #Crypto
🔥 💎
8

🦈 $IREN LOCKS $363M GPU‑BACKED FINANCE, SETTING UP NEXT AI BUILD‑OUT 🚀
📊 The $363M infusion is anchored to GPUs already under multi‑year contracts, giving smart money a low‑risk liquidity pool to draw from. 🦈 By borrowing against existing infrastructure, IREN sidesteps dilution and positions itself ahead of the next AI‑capacity wave. ⚡ This financing structure mirrors a classic order‑block retest: the asset’s underlying assets act as a demand zone, ready to absorb sell pressure while the market eyes upside bias. 📈
💬 How do you see this capital efficiency reshaping IREN’s upside trajectory? 👇
⚠️ Not financial advice. Always manage your risk. 🛡️
🏷️ #IREN #AIInfrastructure #SmartMoney #Funding #Crypto
🔥 💎
11

·
--
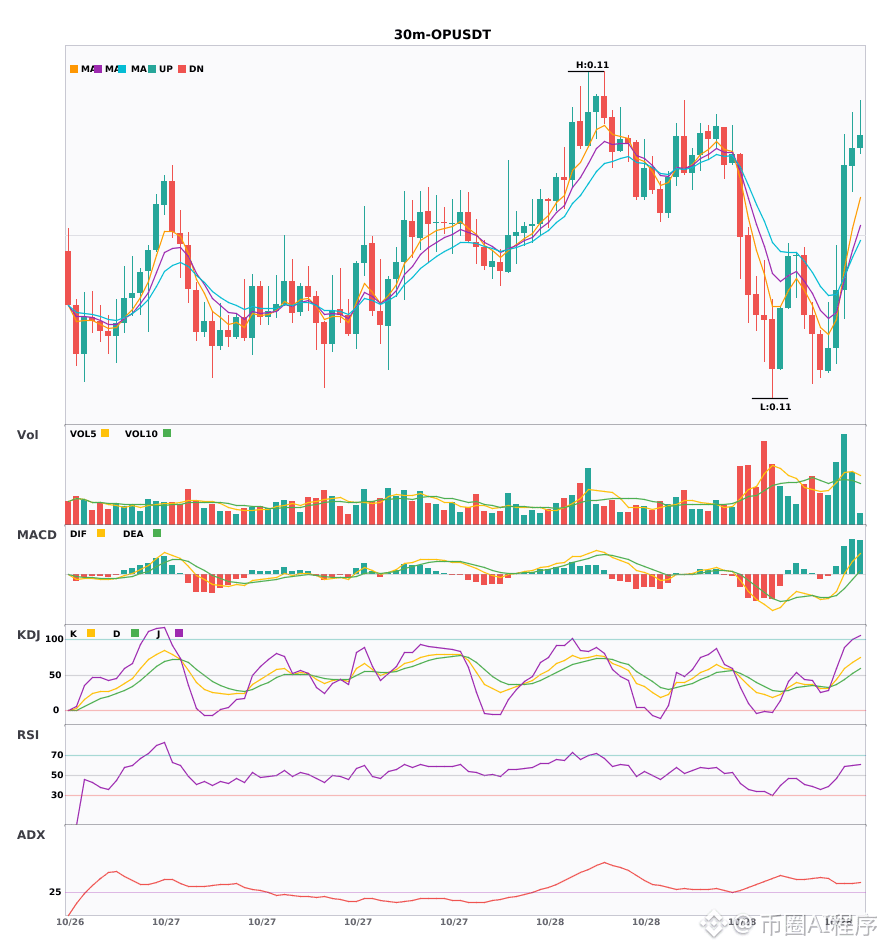
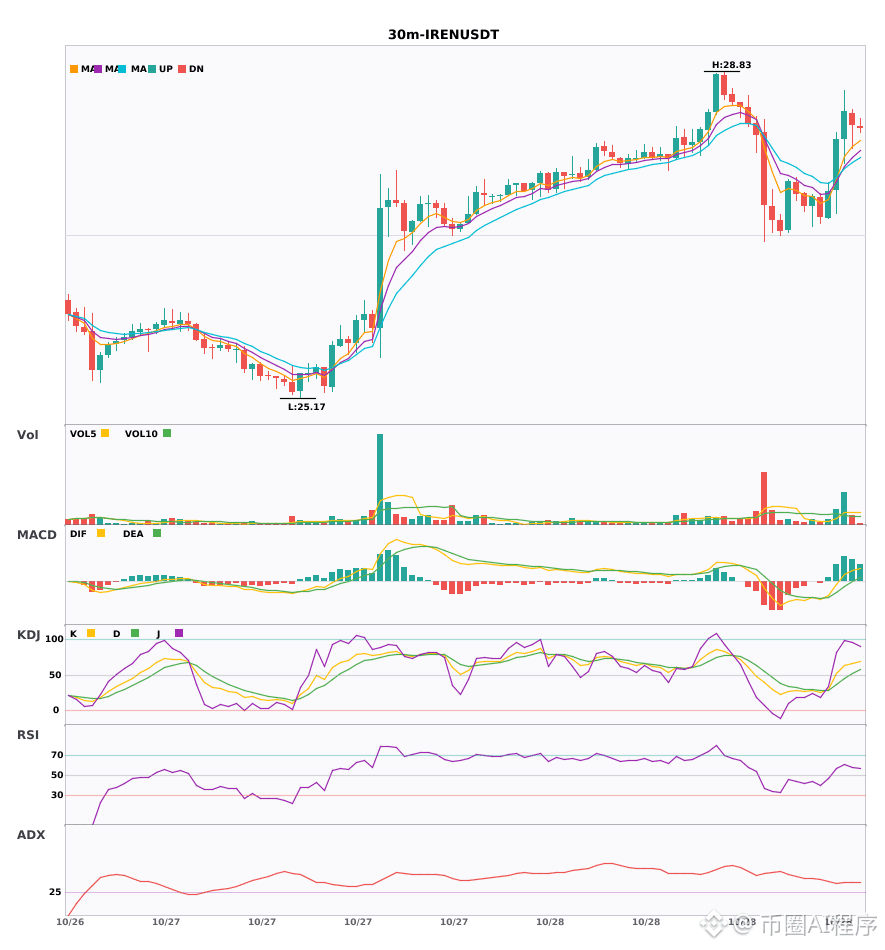
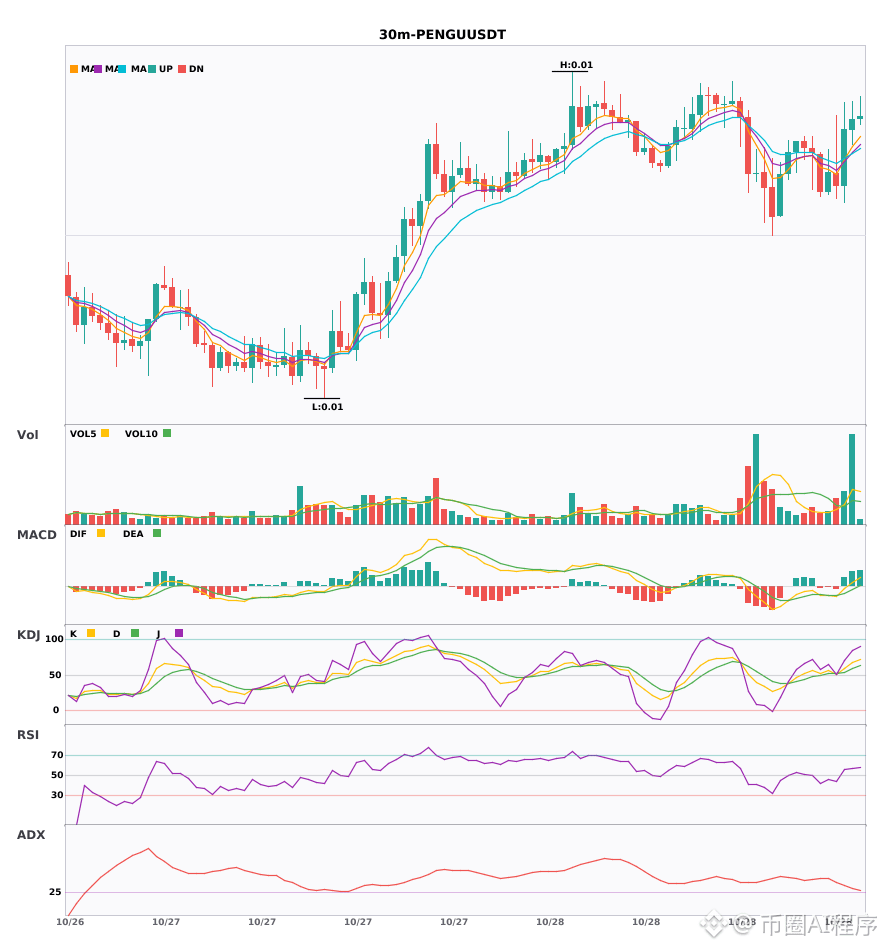
$OP / $IREN / $PENGU 30-minute bullish signals, 4-hour bullish trend confirmed 🔥
════════════════════
🔴 $OP 30-minute bullish signal
⚠️Technical analysis: 4-hour bullish confluence confirmed | 30-minute entry: MACD is bullish, trend is strong, momentum is increasing | EMA5 > EMA8 > EMA13, bullish alignment | KDJ is strong, bulls have the advantage (K: 68.0, D: 52.0) | Volume increased (2.0x)
════════════════════
🔴 $IREN 30-minute bullish signal
⚠️Technical analysis: 4-hour bullish confluence confirmed | 30-minute entry: MACD DIF broke above the zero line, trend turned bullish | EMA5 > EMA8 > EMA13, bullish alignment | Volume surged (3.6x)
════════════════════
🔴 $PENGU 30-minute bullish signal
⚠️Technical analysis: 4-hour bullish confluence confirmed | 30-minute entry: MACD DIF broke above the zero line, trend turned bullish | EMA5 > EMA8 > EMA13, bullish alignment | KDJ is strong, bulls have the advantage (K: 67.0, D: 58.4) | Volume surged (3.7x)
════════════════════
🔔 Follow us for first-hand market updates 🔔
#多周期共振 #OP #IREN #PENGU
📌 When trading, check whether the candlestick pattern is consistent
════════════════════
🔴 $OP 30-minute bullish signal
⚠️Technical analysis: 4-hour bullish confluence confirmed | 30-minute entry: MACD is bullish, trend is strong, momentum is increasing | EMA5 > EMA8 > EMA13, bullish alignment | KDJ is strong, bulls have the advantage (K: 68.0, D: 52.0) | Volume increased (2.0x)
════════════════════
🔴 $IREN 30-minute bullish signal
⚠️Technical analysis: 4-hour bullish confluence confirmed | 30-minute entry: MACD DIF broke above the zero line, trend turned bullish | EMA5 > EMA8 > EMA13, bullish alignment | Volume surged (3.6x)
════════════════════
🔴 $PENGU 30-minute bullish signal
⚠️Technical analysis: 4-hour bullish confluence confirmed | 30-minute entry: MACD DIF broke above the zero line, trend turned bullish | EMA5 > EMA8 > EMA13, bullish alignment | KDJ is strong, bulls have the advantage (K: 67.0, D: 58.4) | Volume surged (3.7x)
════════════════════
🔔 Follow us for first-hand market updates 🔔
#多周期共振 #OP #IREN #PENGU
📌 When trading, check whether the candlestick pattern is consistent
8

·
--
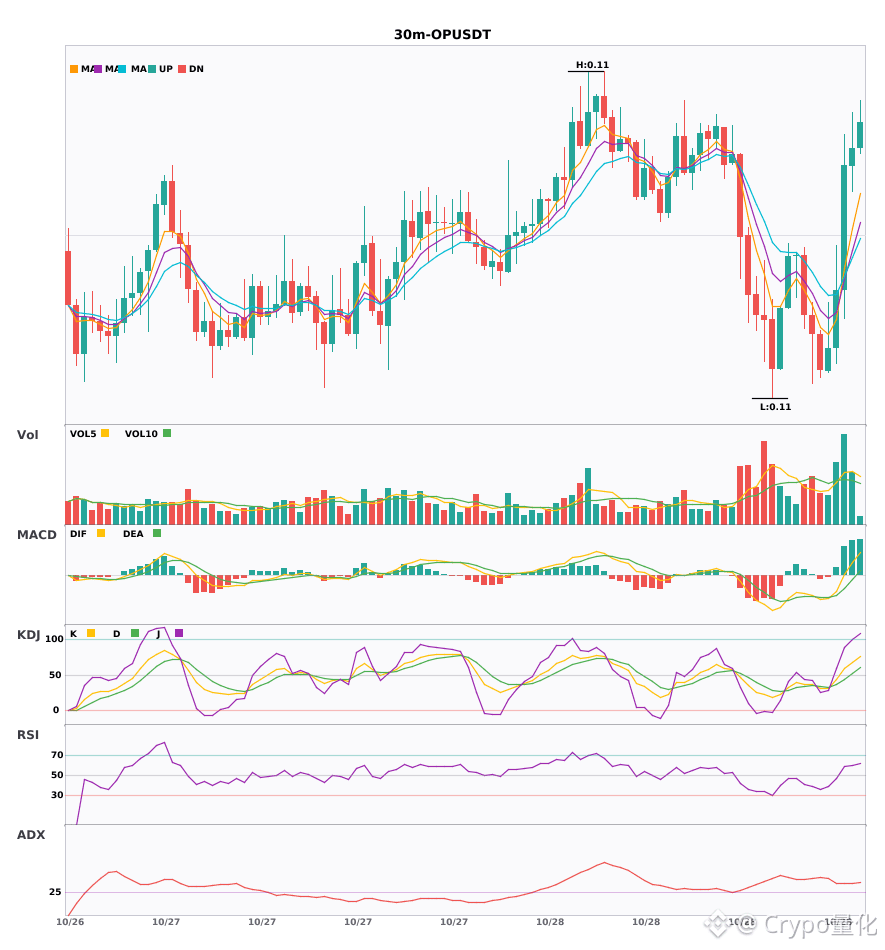
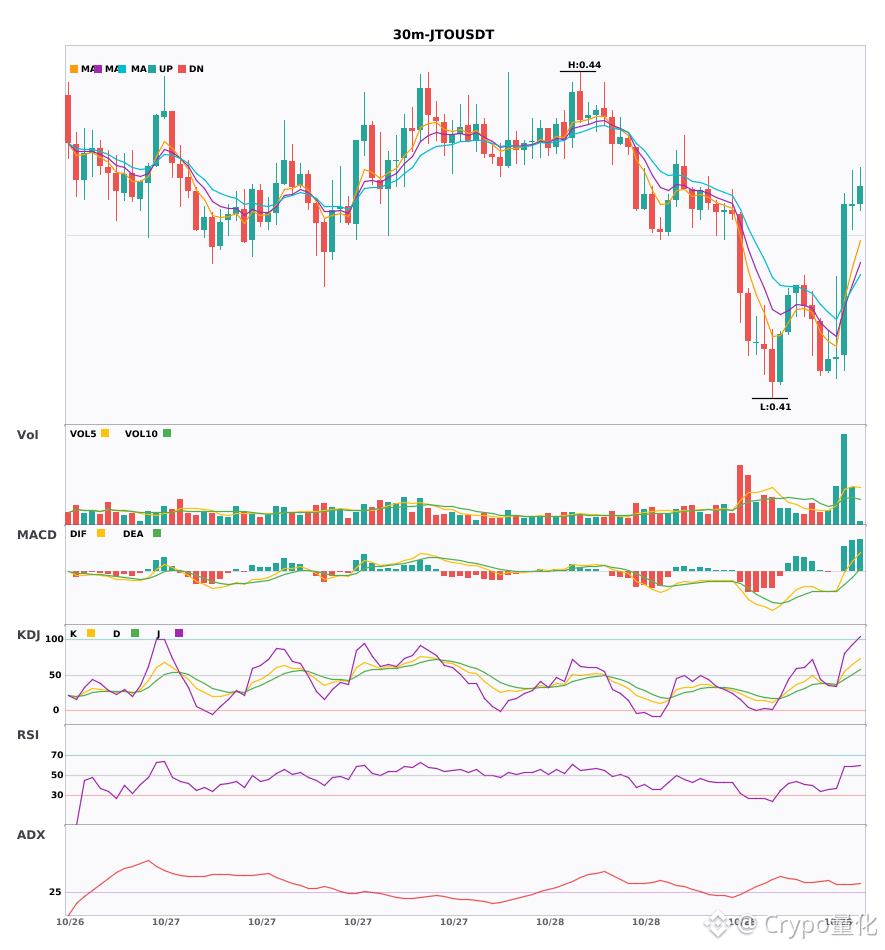
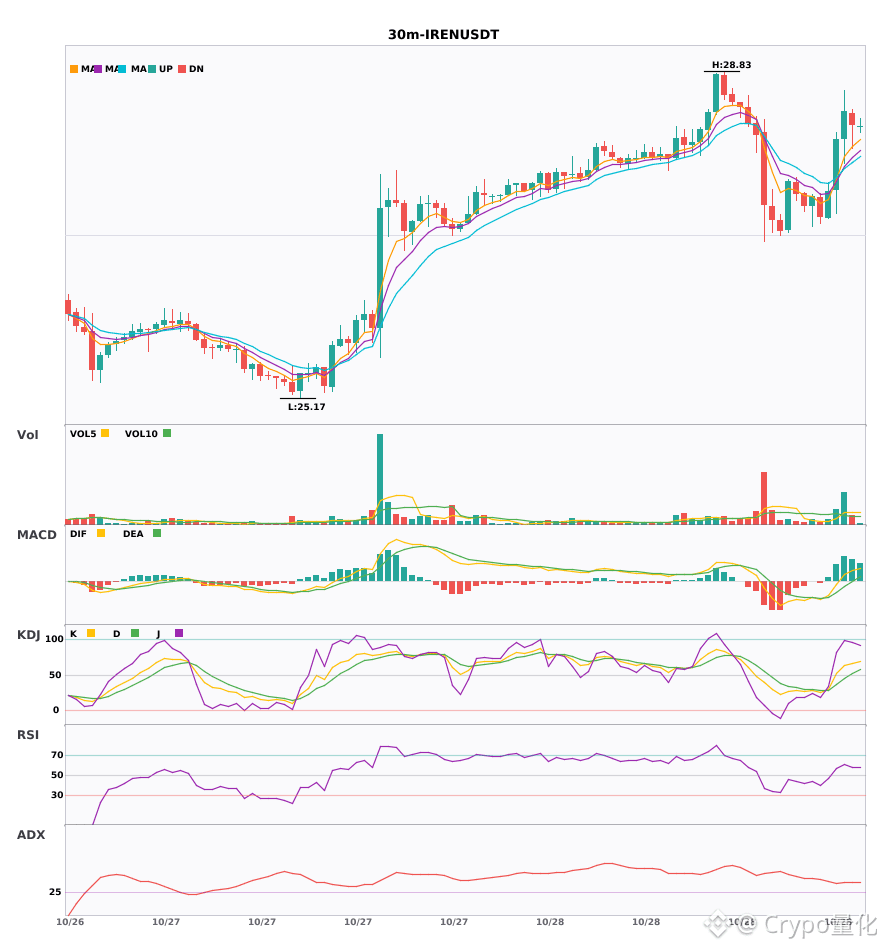
$OP / $JTO / $IREN 30-minute resonance turns bullish, with bullish signals appearing simultaneously🔥
════════════════════
🔴 $OP 30-minute bullish signal
⚠️Technical analysis: ADX(38) indicates a clear trending market | MACD is bullish, with a strong trend and increasing momentum | EMA5 > EMA8 > EMA13, bullish alignment | KDJ is running strongly, with bulls in control (K: 68.0, D: 52.0) | Volume increased (2.0x)
════════════════════
🔴 $JTO 30-minute bullish signal
⚠️Technical analysis: ADX(36) indicates a clear trending market | MACD DIF breaks above the zero line, signaling a bullish trend reversal | EMA5 > EMA8 > EMA13, bullish alignment | KDJ is running strongly, with bulls in control (K: 64.7, D: 50.3) | Volume surges (3.5x)
════════════════════
🔴 $IREN 30-minute bullish signal
⚠️Technical analysis: ADX(37) indicates a clear trending market | MACD DIF breaks above the zero line, signaling a bullish trend reversal | EMA5 > EMA8 > EMA13, bullish alignment | Volume surges (3.6x)
════════════════════
🔔 Follow us for first-hand market updates 🔔
#技术分析 #OP #JTO #IREN
📌 When trading, pay attention to whether the candlestick patterns confirm the signal
════════════════════
🔴 $OP 30-minute bullish signal
⚠️Technical analysis: ADX(38) indicates a clear trending market | MACD is bullish, with a strong trend and increasing momentum | EMA5 > EMA8 > EMA13, bullish alignment | KDJ is running strongly, with bulls in control (K: 68.0, D: 52.0) | Volume increased (2.0x)
════════════════════
🔴 $JTO 30-minute bullish signal
⚠️Technical analysis: ADX(36) indicates a clear trending market | MACD DIF breaks above the zero line, signaling a bullish trend reversal | EMA5 > EMA8 > EMA13, bullish alignment | KDJ is running strongly, with bulls in control (K: 64.7, D: 50.3) | Volume surges (3.5x)
════════════════════
🔴 $IREN 30-minute bullish signal
⚠️Technical analysis: ADX(37) indicates a clear trending market | MACD DIF breaks above the zero line, signaling a bullish trend reversal | EMA5 > EMA8 > EMA13, bullish alignment | Volume surges (3.6x)
════════════════════
🔔 Follow us for first-hand market updates 🔔
#技术分析 #OP #JTO #IREN
📌 When trading, pay attention to whether the candlestick patterns confirm the signal
26

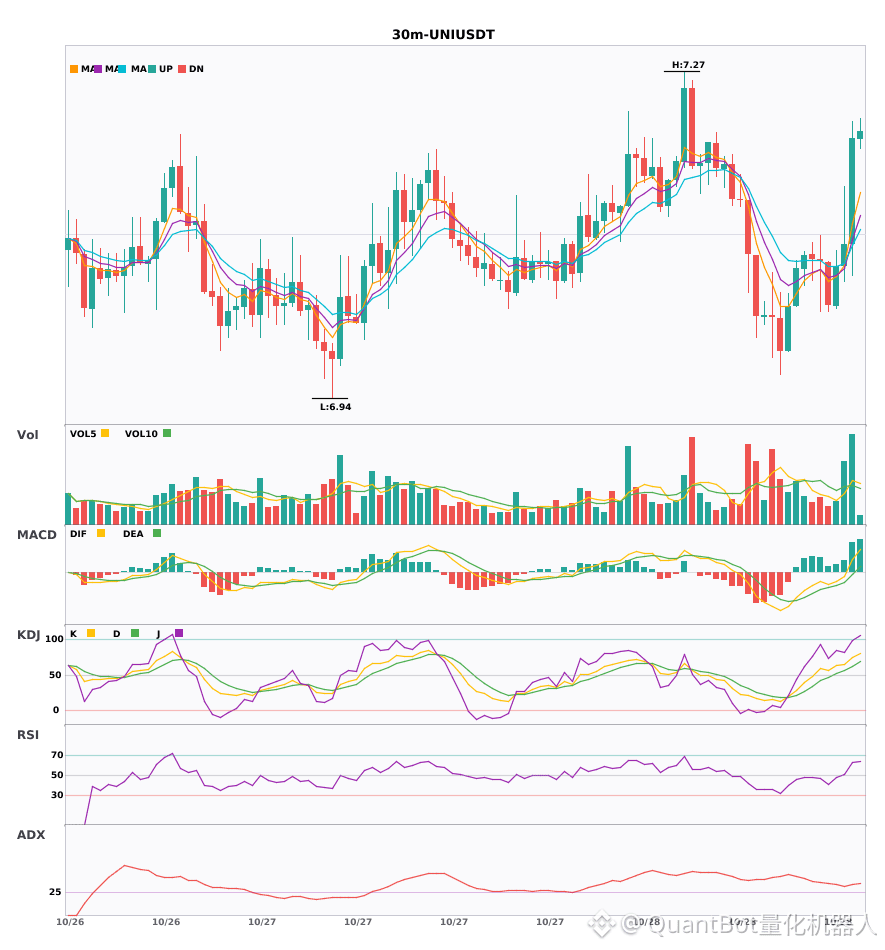
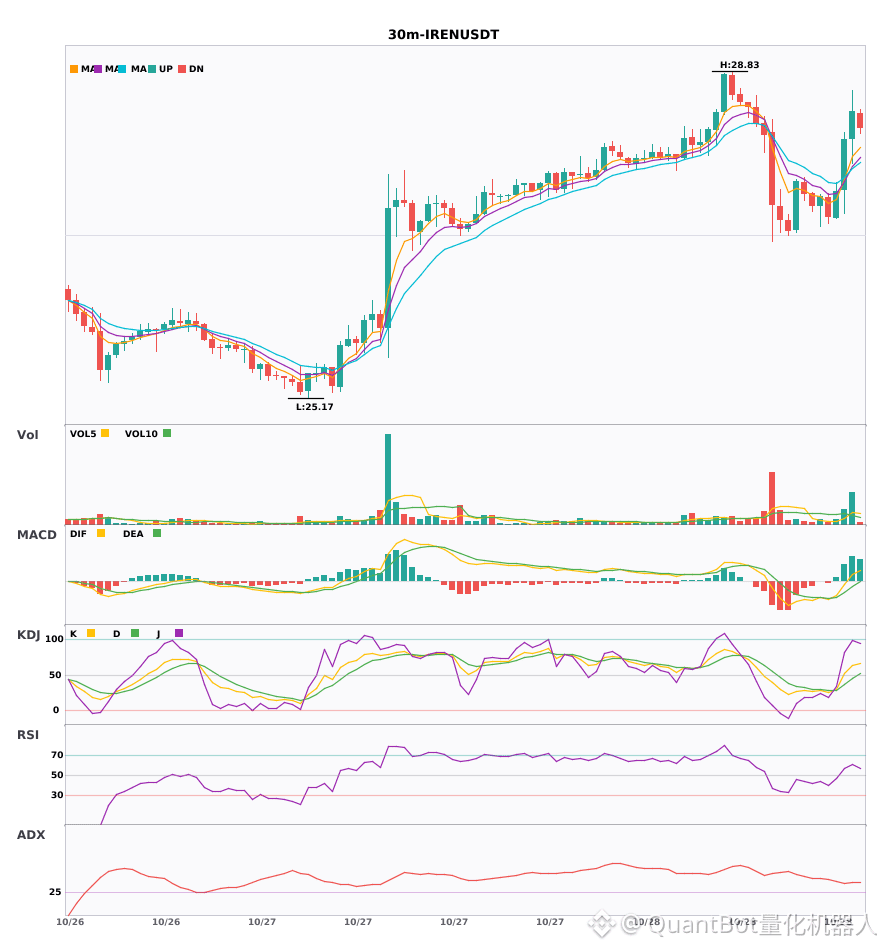
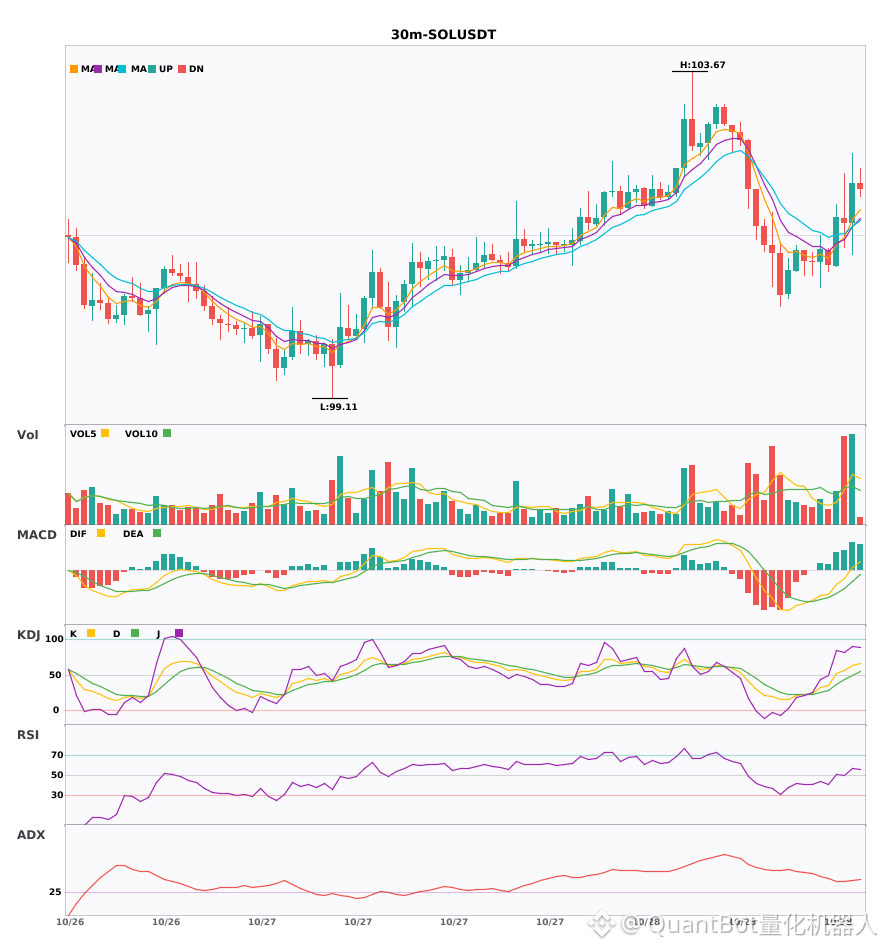
$UNI / $IREN / $SOL 30-minute technical indicators are strengthening in sync—which has the greatest breakout potential?
📈 $UNI | 30-minute bullish signal
━━━━━━━━━━━━━━━━━━
Technical analysis: ADX (35): clear trending market | MACD DIF breaks above the zero line, signaling a bullish trend | EMA5 > EMA8 > EMA13, bullish alignment | KDJ is strong, with bulls in control (K: 74.3, D: 62.6) | Trading volume expands (2.3x)
Price change: 1.5100%
📈 $IREN | 30-minute bullish signal
━━━━━━━━━━━━━━━━━━
Technical analysis: ADX (37): clear trending market | MACD DIF breaks above the zero line, signaling a bullish trend | EMA5 > EMA8 > EMA13, bullish alignment | Trading volume surges (3.6x)
Price change: 1.1000%
📈 $SOL | 30-minute bullish signal
━━━━━━━━━━━━━━━━━━
Technical analysis: ADX (41): clear trending market | MACD DIF breaks above the zero line, signaling a bullish trend | Moving averages are converging, building momentum before an imminent directional move | Trading volume expands (2.4x)
Price change: 0.5400%
📌 Market update: Solflare Validator Stops Earning Rewards After Provider Security Incident - Validator trackers show about 1.56 million SOL staked with the node. Solflare says user funds are safe and is preparing an in-app migration.
━━━━━━━━━━━━━━━━━━
#技术分析 #UNI #IREN #SOL
📌 The above content is for reference only and does not constitute investment advice
3
·
--
$UNI / $IREN / $SOL — bullish on the 30-minute timeframe, with short-term confluence opportunities 🔥
════════════════════
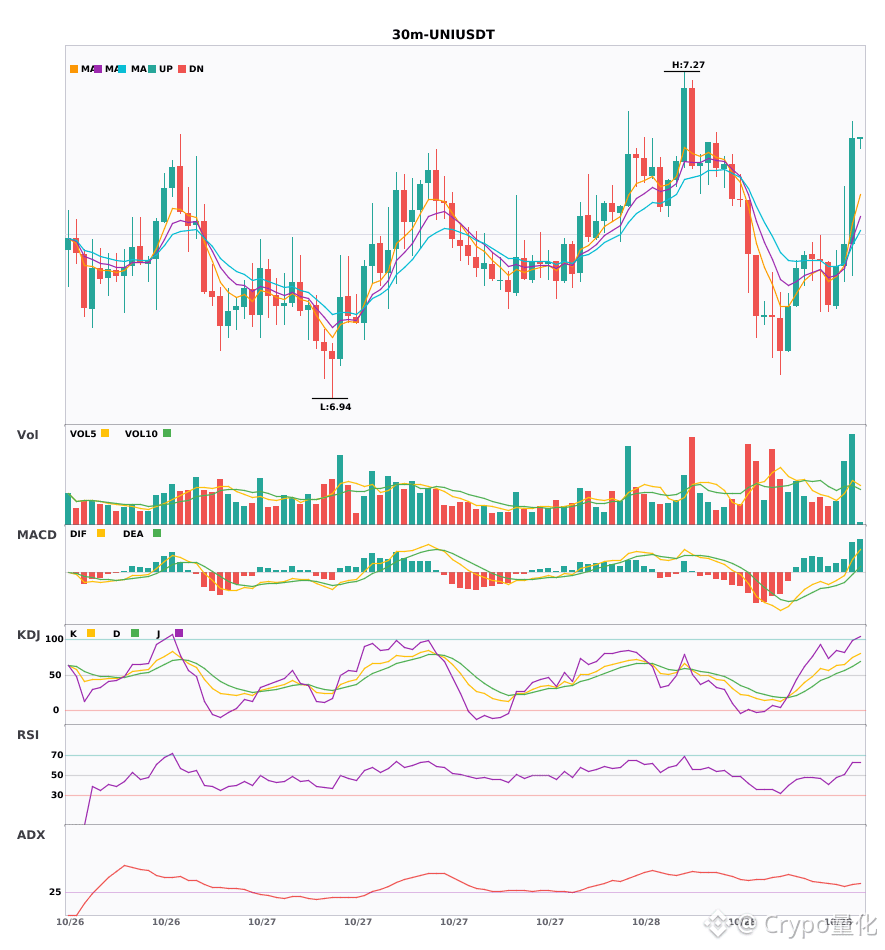
🔴 $UNI 30-minute bullish signal
⚠️Technical: ADX(35) indicates a clear trend | MACD DIF breaks above zero, signaling a bullish trend | EMA5 > EMA8 > EMA13, bullish alignment | KDJ is running strong, with bulls in control (K: 74.3, D: 62.6) | Volume increases (2.3x)
════════════════════
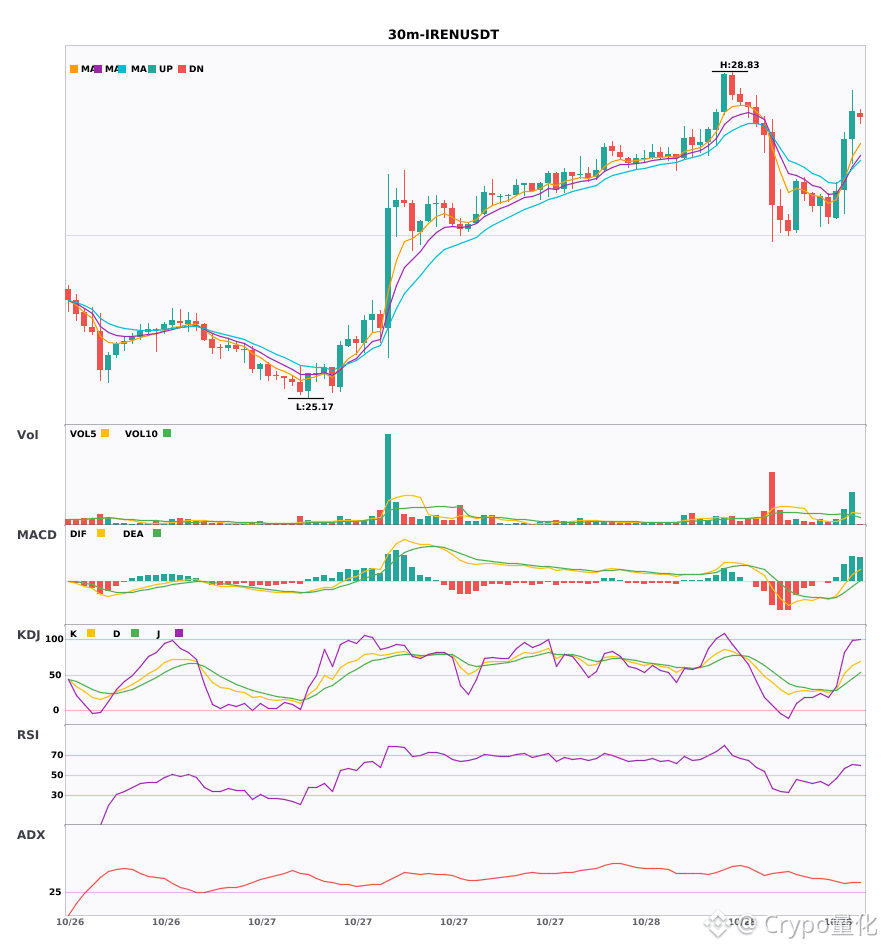
🔴 $IREN 30-minute bullish signal
⚠️Technical: ADX(37) indicates a clear trend | MACD DIF breaks above zero, signaling a bullish trend | EMA5 > EMA8 > EMA13, bullish alignment | Volume surges (3.6x)
════════════════════
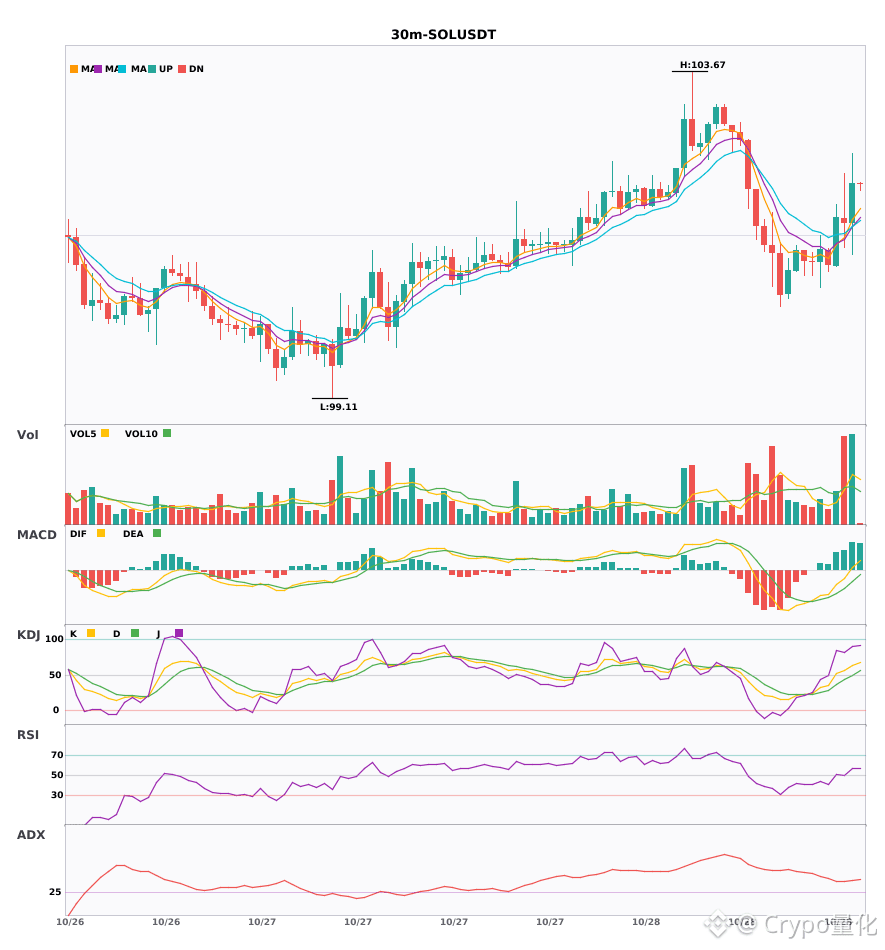
🔴 $SOL 30-minute bullish signal
⚠️Technical: ADX(41) indicates a clear trend | MACD DIF breaks above zero, signaling a bullish trend | Moving averages are converging and gathering momentum, poised to choose a direction | Volume increases (2.4x)
📢Market update: Solflare Validator Stops Earning Rewards After Provider Security Incident - Validator trackers show about 1.56 million SOL staked with the node. Solflare says user funds are safe and is preparing an in-app migration.
════════════════════
🔔 Follow for first-hand market movement alerts 🔔
#技术分析 #UNI #IREN #SOL
📌 When trading, pay attention to whether the candlestick pattern meets the criteria.
════════════════════
🔴 $UNI 30-minute bullish signal
⚠️Technical: ADX(35) indicates a clear trend | MACD DIF breaks above zero, signaling a bullish trend | EMA5 > EMA8 > EMA13, bullish alignment | KDJ is running strong, with bulls in control (K: 74.3, D: 62.6) | Volume increases (2.3x)
════════════════════
🔴 $IREN 30-minute bullish signal
⚠️Technical: ADX(37) indicates a clear trend | MACD DIF breaks above zero, signaling a bullish trend | EMA5 > EMA8 > EMA13, bullish alignment | Volume surges (3.6x)
════════════════════
🔴 $SOL 30-minute bullish signal
⚠️Technical: ADX(41) indicates a clear trend | MACD DIF breaks above zero, signaling a bullish trend | Moving averages are converging and gathering momentum, poised to choose a direction | Volume increases (2.4x)
📢Market update: Solflare Validator Stops Earning Rewards After Provider Security Incident - Validator trackers show about 1.56 million SOL staked with the node. Solflare says user funds are safe and is preparing an in-app migration.
════════════════════
🔔 Follow for first-hand market movement alerts 🔔
#技术分析 #UNI #IREN #SOL
📌 When trading, pay attention to whether the candlestick pattern meets the criteria.
5


·
--
Bullish
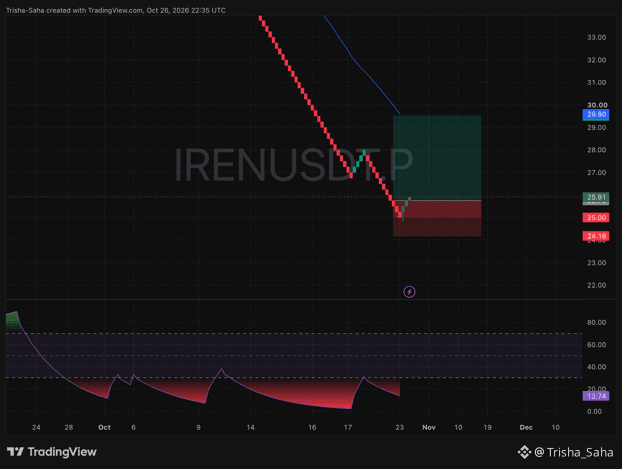
⚡ $IREN has officially bottomed out and a massive bounce is starting right now! 🎯
📍 Trade Setup:
• Entry Zone: $25.50 –$25.95
• Stop Loss: $24.18
• Target: $29.60
📌 Chart Analysis:
• Sellers are completely out of steam after a brutal drop, with momentum crushed down at rock-bottom levels (13.74).
• Three fresh green candles just printed off the $25.00 floor, confirming big buyers are stepping in aggressively.
• Wide-open upside straight toward the blue trendline sitting right near our $29.60 target.
🛡️ Lock in a risk-free trade by sliding your Stop Loss to Break-Even the moment we hit +3% to +4% profit.
I've already loaded my bag. Who is catching this reversal with me? Drop a 🚀 in the comments! 👇
#IREN #IRENUSDT #CryptoTrading #Altcoins
{future}(IRENUSDT)
⚡ $IREN has officially bottomed out and a massive bounce is starting right now! 🎯
📍 Trade Setup:
• Entry Zone: $25.50 –$25.95
• Stop Loss: $24.18
• Target: $29.60
📌 Chart Analysis:
• Sellers are completely out of steam after a brutal drop, with momentum crushed down at rock-bottom levels (13.74).
• Three fresh green candles just printed off the $25.00 floor, confirming big buyers are stepping in aggressively.
• Wide-open upside straight toward the blue trendline sitting right near our $29.60 target.
🛡️ Lock in a risk-free trade by sliding your Stop Loss to Break-Even the moment we hit +3% to +4% profit.
I've already loaded my bag. Who is catching this reversal with me? Drop a 🚀 in the comments! 👇
#IREN #IRENUSDT #CryptoTrading #Altcoins
1
236

$IREN PIVOTS FROM BITCOIN MINING TO A $17B AI CLOUD POWERHOUSE BY 2030! ⚡ 🚀
Bernstein projections show $IREN winding down Bitcoin operations by 2026 to unlock a staggering $17B annual AI revenue stream by 2030. 📊 Contract pricing has surged 125% since November, proving institutional demand for 2GW computing capacity is devouring supply.
💡 Smart money recognizes when a miner turns into an AI compute powerhouse before the market re-rates the narrative. 💬 Is $IREN paving the ultimate playbook for legacy mining infrastructure, or is exiting BTC too risky? 👇
⚠️ Not financial advice. Always manage your risk. 🛡️
🏷️ #IREN #BTC #AI #Crypto #CloudComputing
⚡ 💎
16
·
--
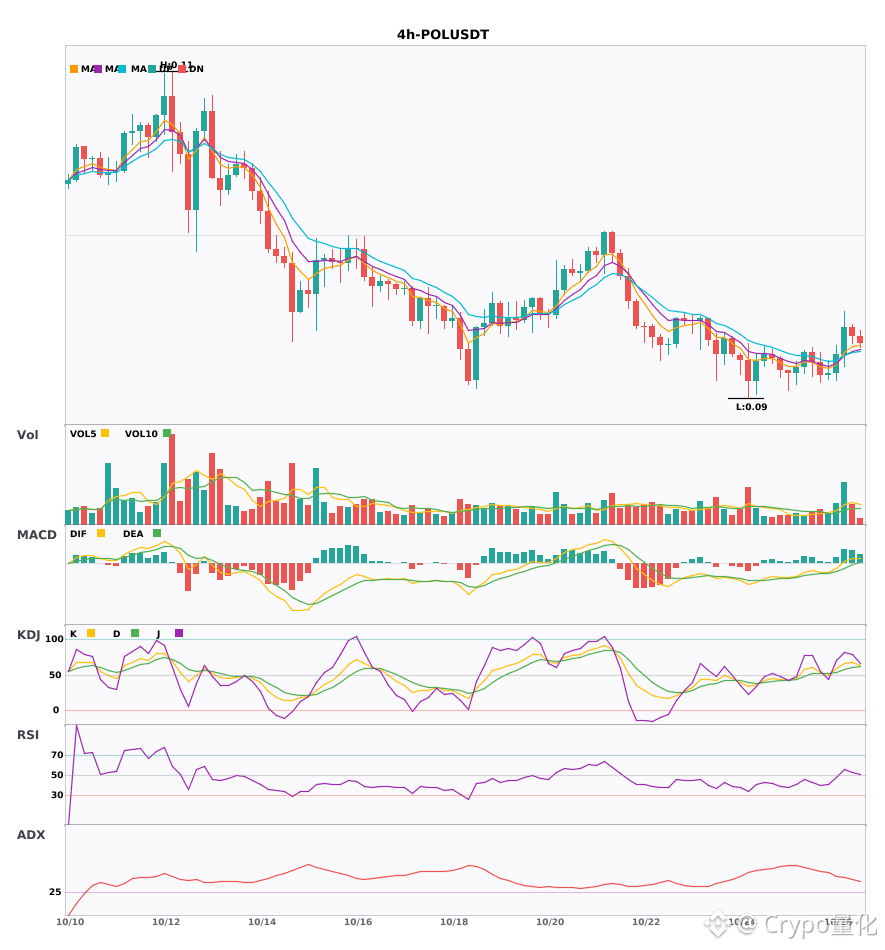
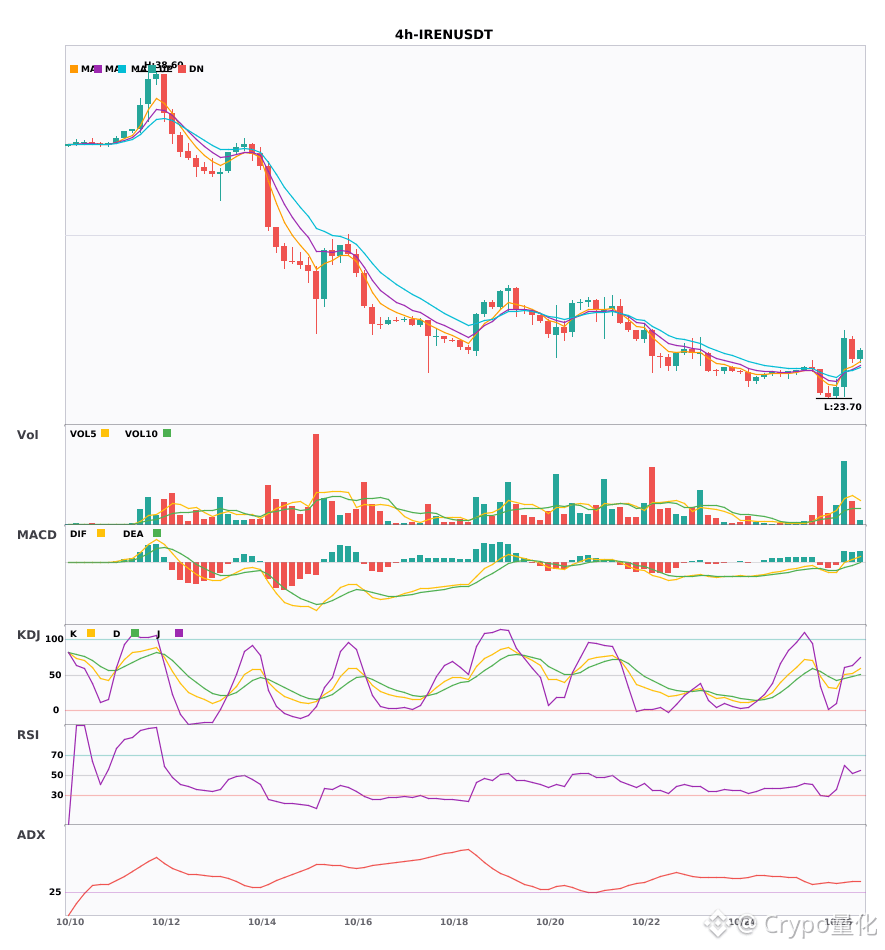
Two 4-hour bullish signals appeared simultaneously: $POL / $IREN🔥
════════════════════
🔴 $POL 4-hour bullish signal
⚠️Technical analysis: ADX(40) indicates a clear trending market | MACD is bullish, with a strong trend but weakening momentum | EMA5 > EMA8 > EMA13, bullish alignment | KDJ is strong, with bulls in control (K: 66.9, D: 61.0) | Volume surge (2.8x)
════════════════════
🔴 $IREN 4-hour bullish signal
⚠️Technical analysis: ADX(38) indicates a clear trending market | MACD is bullish, with a strong trend but weakening momentum | EMA5 > EMA8 > EMA13, bullish alignment | Volume surge (4.5x)
════════════════════
🔔 Follow for first-hand market updates 🔔
#技术分析 #POL #IREN
📌 When trading, pay attention to whether the candlestick pattern matches the setup.
Two 4-hour bullish signals appeared simultaneously: $POL / $IREN 🔥
════════════════════
🔴 $POL 4-hour bullish signal
⚠️Technical analysis: ADX(40) indicates a clear trending market | MACD is bullish, with a strong trend but weakening momentum | EMA5 > EMA8 > EMA13, bullish alignment | KDJ is strong, with bulls in control (K: 66.9, D: 61.0) | Volume surge (2.8x)
════════════════════
🔴 $IREN 4-hour bullish signal
⚠️Technical analysis: ADX(38) indicates a clear trending market | MACD is bullish, with a strong trend but weakening momentum | EMA5 > EMA8 > EMA13, bullish alignment | Volume surge (4.5x)
════════════════════
🔔 Follow for first-hand market updates 🔔
#技术分析 #POL #IREN
📌 When trading, pay attention to whether the candlestick pattern matches the setup.
════════════════════
🔴 $POL 4-hour bullish signal
⚠️Technical analysis: ADX(40) indicates a clear trending market | MACD is bullish, with a strong trend but weakening momentum | EMA5 > EMA8 > EMA13, bullish alignment | KDJ is strong, with bulls in control (K: 66.9, D: 61.0) | Volume surge (2.8x)
════════════════════
🔴 $IREN 4-hour bullish signal
⚠️Technical analysis: ADX(38) indicates a clear trending market | MACD is bullish, with a strong trend but weakening momentum | EMA5 > EMA8 > EMA13, bullish alignment | Volume surge (4.5x)
════════════════════
🔔 Follow for first-hand market updates 🔔
#技术分析 #POL #IREN
📌 When trading, pay attention to whether the candlestick pattern matches the setup.
3
·
--
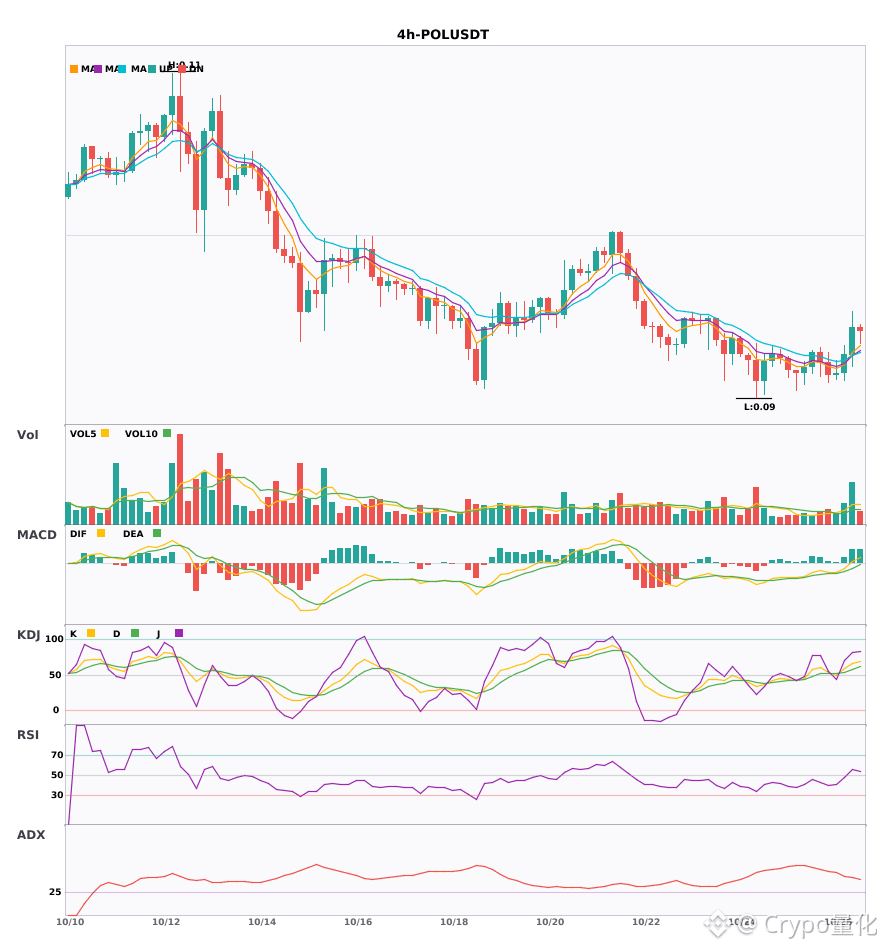
$POL / $IREN / $SPCX hourly charts are bullish, with short-term confluence opportunities 🔥
════════════════════
🔴 $POL 4-hour bullish signal
⚠️Technical analysis: ADX(41) indicates a clear trending market | MACD DIF breaks above the zero line, signaling a bullish trend reversal | EMA5 crosses above EMA8, turning bullish in the short term | KDJ is strong, with bulls in control (K: 66.0, D: 58.0) | Volume surge (2.8x)
════════════════════
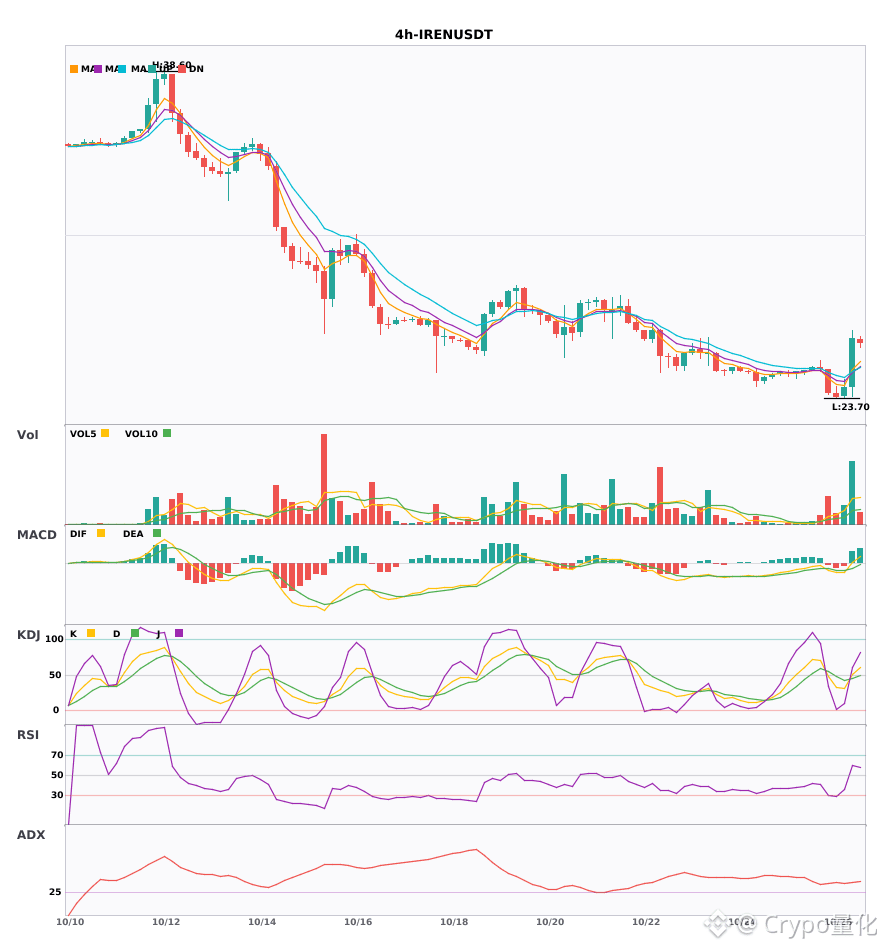
🔴 $IREN 4-hour bullish signal
⚠️Technical analysis: ADX(36) indicates a clear trending market | MACD golden cross above zero, releasing bullish momentum | EMA5 crosses above EMA8, turning bullish in the short term | KDJ golden cross, bullish outlook in the short term (K: 50.1, D: 44.7) | Volume surge (4.5x)
════════════════════
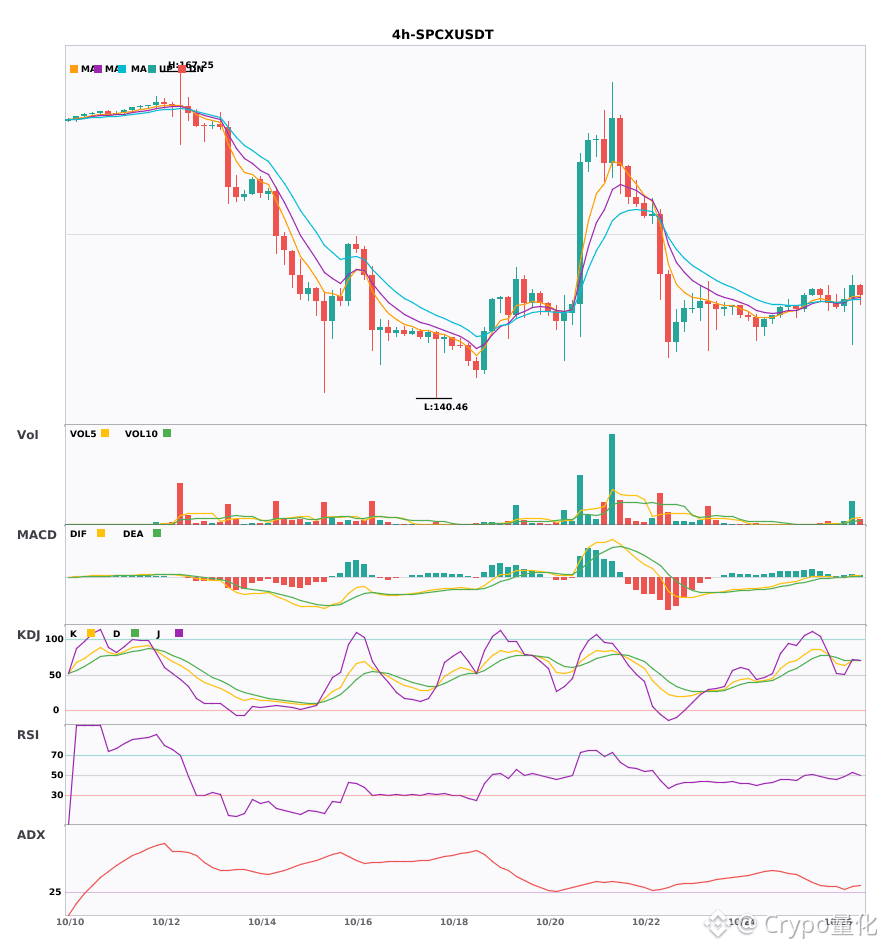
🔴 $SPCX 4-hour bullish signal
⚠️Technical analysis: ADX(29) indicates a trend is forming and an opportunity to participate | MACD is bullish, with a strong trend and increasing momentum | EMA5 > EMA8 > EMA13, bullish alignment | KDJ golden cross, bullish outlook in the short term (K: 70.7, D: 70.6) | Volume surge (6.6x)
════════════════════
🔔 Follow for first-hand market updates 🔔
#技术分析 #POL #IREN #SPCX
📌 When trading, check whether the candlestick pattern confirms the signal
════════════════════
🔴 $POL 4-hour bullish signal
⚠️Technical analysis: ADX(41) indicates a clear trending market | MACD DIF breaks above the zero line, signaling a bullish trend reversal | EMA5 crosses above EMA8, turning bullish in the short term | KDJ is strong, with bulls in control (K: 66.0, D: 58.0) | Volume surge (2.8x)
════════════════════
🔴 $IREN 4-hour bullish signal
⚠️Technical analysis: ADX(36) indicates a clear trending market | MACD golden cross above zero, releasing bullish momentum | EMA5 crosses above EMA8, turning bullish in the short term | KDJ golden cross, bullish outlook in the short term (K: 50.1, D: 44.7) | Volume surge (4.5x)
════════════════════
🔴 $SPCX 4-hour bullish signal
⚠️Technical analysis: ADX(29) indicates a trend is forming and an opportunity to participate | MACD is bullish, with a strong trend and increasing momentum | EMA5 > EMA8 > EMA13, bullish alignment | KDJ golden cross, bullish outlook in the short term (K: 70.7, D: 70.6) | Volume surge (6.6x)
════════════════════
🔔 Follow for first-hand market updates 🔔
#技术分析 #POL #IREN #SPCX
📌 When trading, check whether the candlestick pattern confirms the signal
25

·
--
#IREN
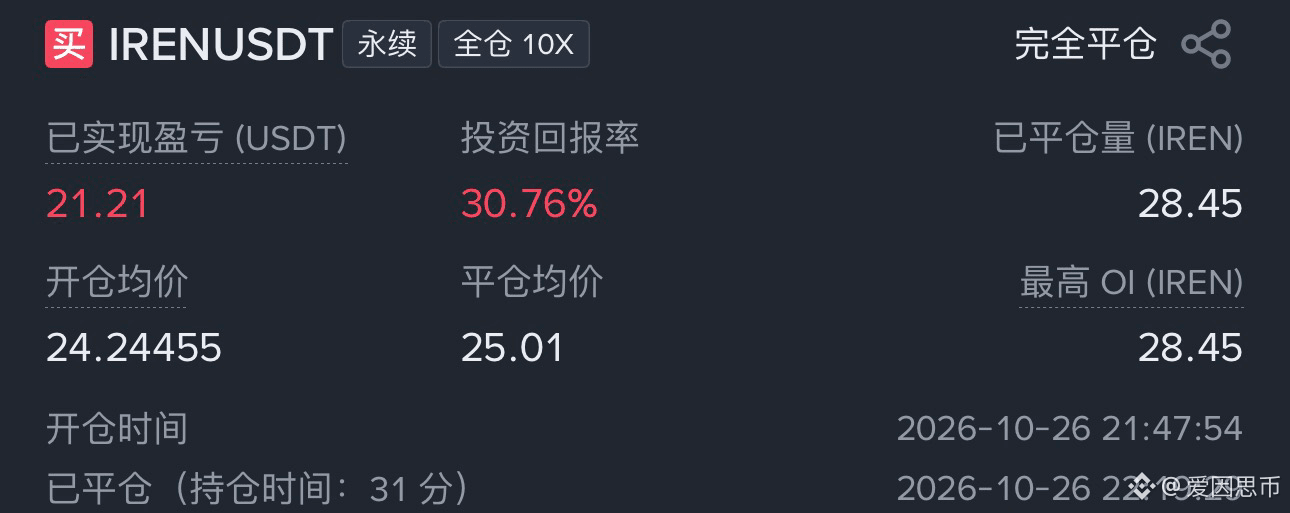
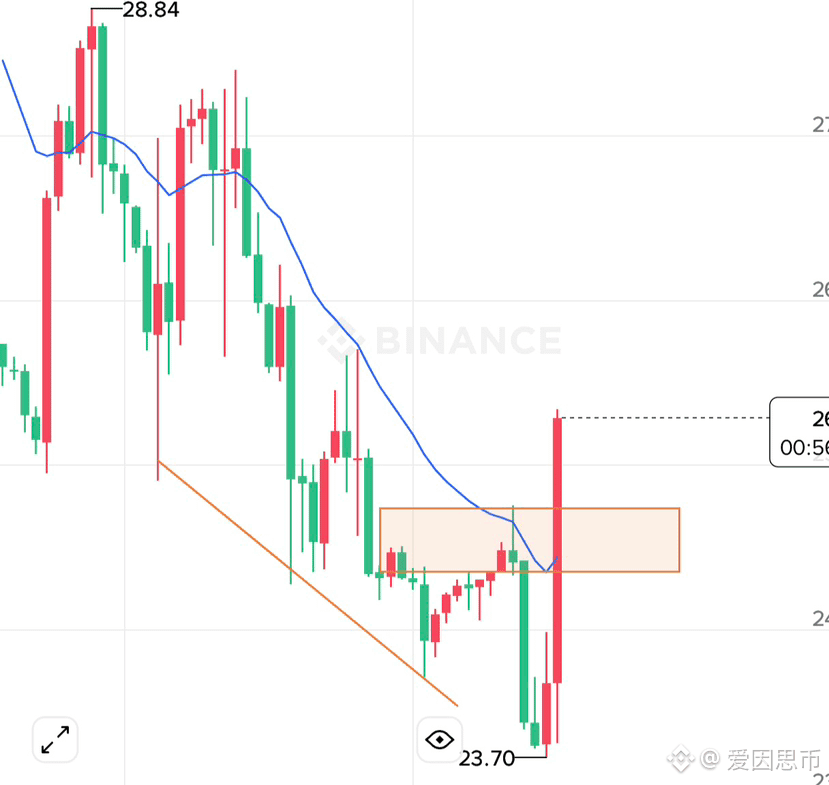
🌙 Late-night review: talking about my stop-losses, entries, and multi-timeframe logic
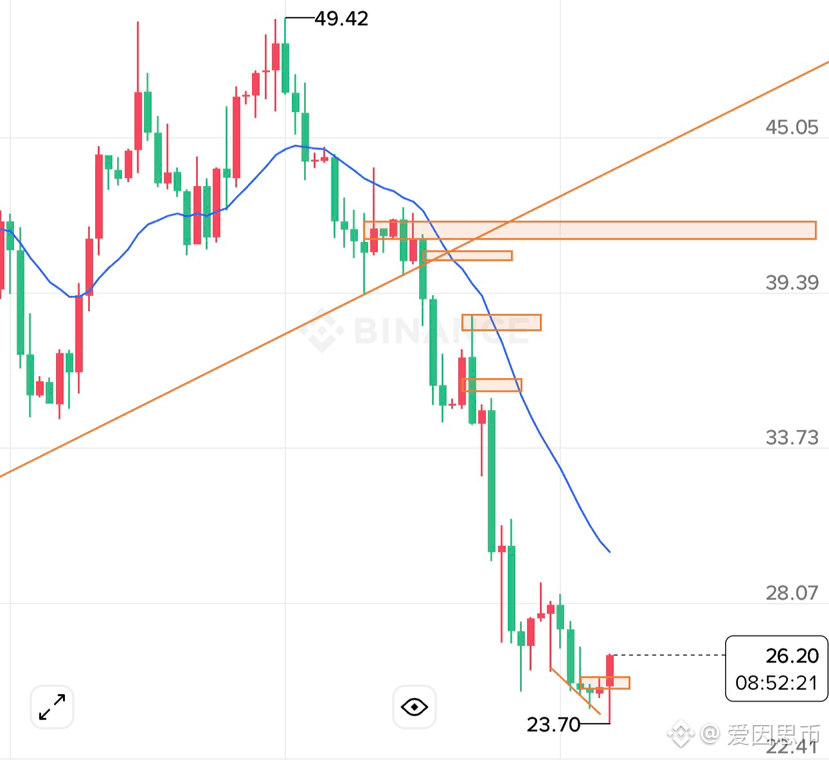
Current IREN trend and core idea
The daily trend is still bearish, with the 20-period moving average firmly suppressing price overhead; but on the 4-hour timeframe, it has already broken above the previous minor high, forming a "small-scale reversal."
📉 Stop-loss logic (painful lesson)
For the first losing trade, I missed the high-2 opportunity and ended up buying at high-3. Because the stop-loss was too far away and I was afraid of losing too much, I violated the rule by forcibly tightening the stop-loss to a local low, and then got stopped out by normal volatility.
👉 Lesson: if you miss the high-2 entry, and the high-3 entry is too far from the stop-loss, then this trade should not be taken, or it should only be taken with a very small position.
📈 Entry logic (following the right side)
For the second winning trade, I patiently waited for the right side. Price stabilized and bounced at the bottom, then pulled back to the 50% level (the SMC FVG gap area), and I entered after a confirmation signal appeared.
👉 Experience: never chase price higher; wait for a pullback confirmation on the right side before entering. That makes the stop-loss easy to set and gives an excellent risk-reward ratio.
👉 Core idea: a reversal on a smaller timeframe often leads to a major reversal on a larger timeframe. But right now, price has run into the dual resistance of the "downtrend starting point + 20-period moving average," so the rally has stalled.
🎯 Next plan
The profit has already been locked in, so absolutely no chasing. From here, it’s time to stay flat and watch, waiting for it to pull back to the FVG area and stabilize, or waiting for a strong bullish candle to break above the daily moving average and then confirm on the pullback. Let the market create the "small move turning into a big move" setup on its own; we will only be followers on the right side.
159
·
--
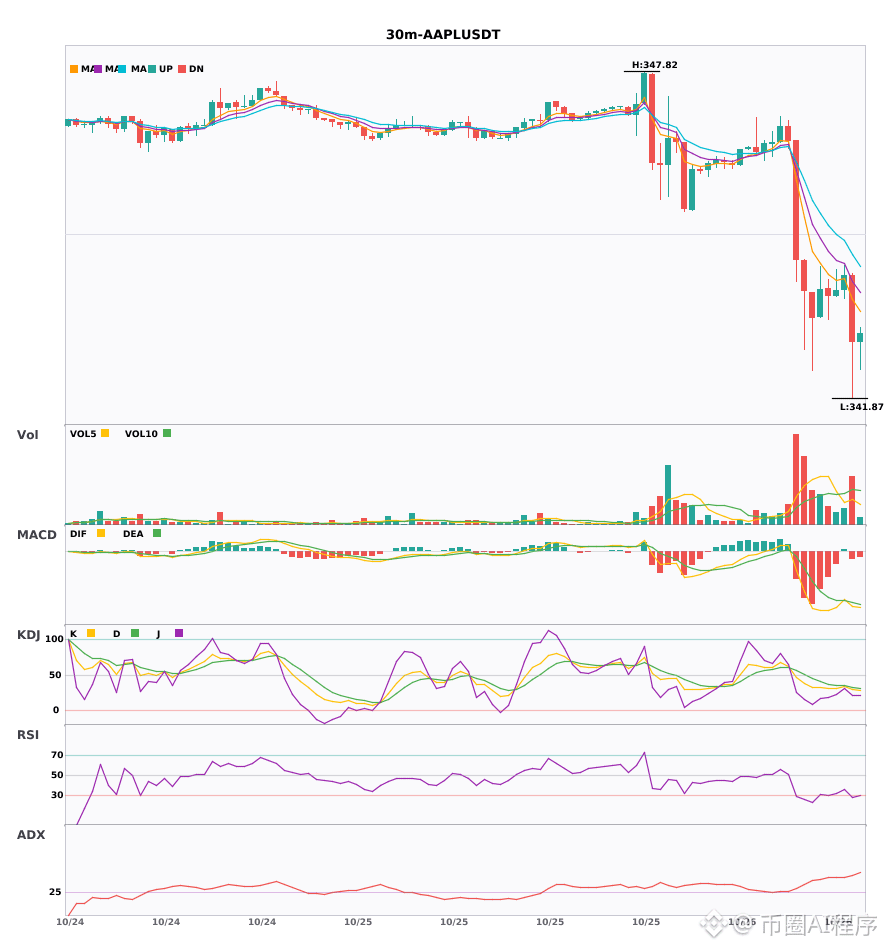
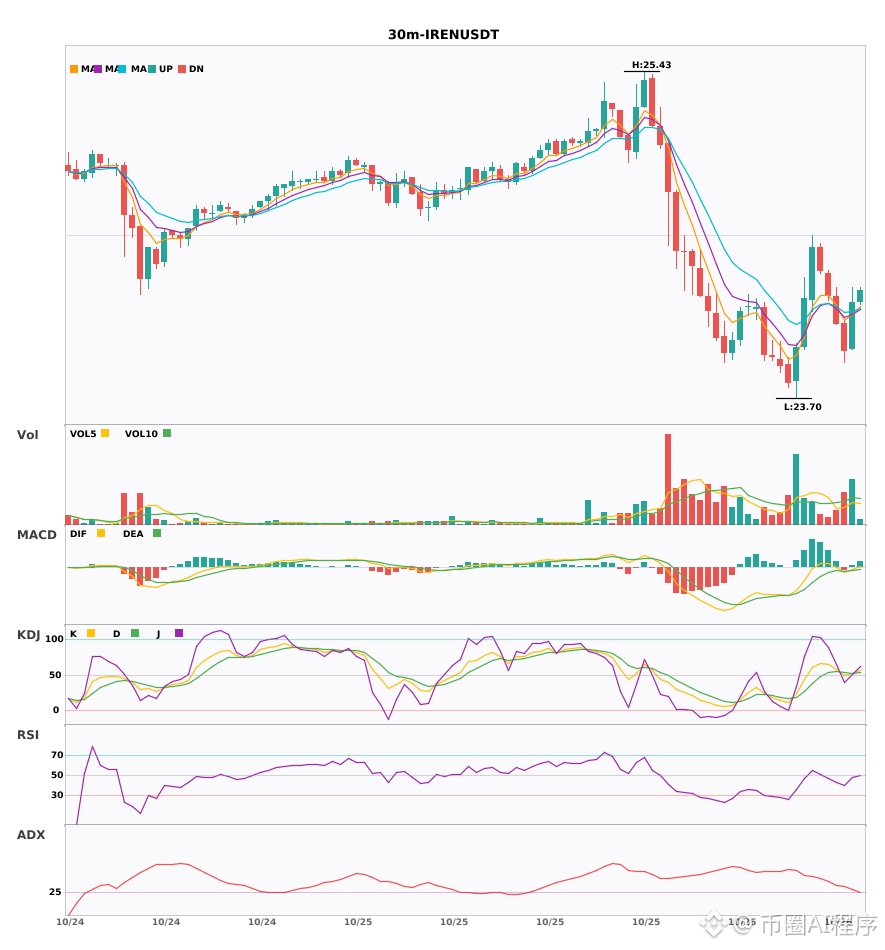
$AAPL / $IREN 30-minute bearish + 4-hour bearish alignment, multi-timeframe resonance turns bearish 🔥
════════════════════
🟢 $AAPL 30-minute bearish signal
⚠️Technical analysis: 4-hour bearish resonance confirmed | 30-minute entry: MACD bearish cross below zero, bearish momentum accelerating | EMA5 < EMA8 < EMA13, bearish alignment | KDJ trending weakly, bears in control (K=29.0, D=32.8) | Normal volume (1.4x)
════════════════════
🟢 $IREN 30-minute bearish signal
⚠️Technical analysis: 4-hour bearish resonance confirmed | 30-minute entry: MACD bearish cross below zero, bearish momentum accelerating | EMA5 crossed below EMA8, short-term outlook turns bearish | KDJ bearish cross, short-term outlook bearish (K=48.6, D=52.8) | Normal volume (1.4x)
════════════════════
🔔 Follow for first-hand market movement alerts 🔔
#多周期共振 #AAPL #IREN
📌 When trading, check whether the candlestick patterns align
════════════════════
🟢 $AAPL 30-minute bearish signal
⚠️Technical analysis: 4-hour bearish resonance confirmed | 30-minute entry: MACD bearish cross below zero, bearish momentum accelerating | EMA5 < EMA8 < EMA13, bearish alignment | KDJ trending weakly, bears in control (K=29.0, D=32.8) | Normal volume (1.4x)
════════════════════
🟢 $IREN 30-minute bearish signal
⚠️Technical analysis: 4-hour bearish resonance confirmed | 30-minute entry: MACD bearish cross below zero, bearish momentum accelerating | EMA5 crossed below EMA8, short-term outlook turns bearish | KDJ bearish cross, short-term outlook bearish (K=48.6, D=52.8) | Normal volume (1.4x)
════════════════════
🔔 Follow for first-hand market movement alerts 🔔
#多周期共振 #AAPL #IREN
📌 When trading, check whether the candlestick patterns align
11

·
--
🧠 Galeon Brain Result
❌ LONG $IREN [OI_DUMP]
━━━━━━━━━━━━━━━━
Entry $24.16 → $23.92
P&L -8.03% 🔴
⚠️ Signals are for reference only. Please be aware of the risks and make your own decisions.
Source: Galeon Brain | Follow X @hellogaleon
#GaleonBrain #IREN #Futures
🧠 Galeon Brain Result
❌ LONG $IREN [OI_DUMP]
━━━━━━━━━━━━━━━━
Entry $24.16 → $23.92
P&L -8.03% 🔴
⚠️ Signals are for reference only. Please be aware of the risks and make your own decisions.
Source: Galeon Brain | Follow X @hellogaleon
#GaleonBrain #IREN #Futures
❌ LONG $IREN [OI_DUMP]
━━━━━━━━━━━━━━━━
Entry $24.16 → $23.92
P&L -8.03% 🔴
⚠️ Signals are for reference only. Please be aware of the risks and make your own decisions.
Source: Galeon Brain | Follow X @hellogaleon
#GaleonBrain #IREN #Futures
44

·
--
Article
Market Divergence: Analyzing Trends, Drivers, and Risks for IREN, BE, and MAXThe digital asset landscape is currently displaying sharp divergence, with market attention splitting between institutional AI infrastructure plays, earnings-driven momentum, and ultra-high-risk micro-cap rotations. Among the distinct assets drawing attention across trading desks and social feeds are IREN, BE, and MAX. Whether monitoring established derivatives flow or screening high-velocity movers under automated watchlist labels like IREN,BEAT MAX, market participants must distinguish between fundamental catalysts and speculative momentum.
IREN: Options Flow and the AI Infrastructure Narrative
IREN has recorded elevated social engagement, registering positive sentiment with a social hype score surpassing 209,000. Much of this interest reflects active repositioning between bears and bulls. While short sellers previously logged over $1.2 billion in combined paper gains across bets on IREN and APLD, aggressive long-term call accumulation has surfaced. Notably, bullish 149-day $39 calls recently absorbed $970,000 in premium, alongside 120-day $30 calls capturing $412,000 in premium. Influential analysts have highlighted IREN as an AI trade that still has legs, expanding its appeal beyond pure-play mining.
Risks & What to Watch: The key risk for IREN lies in volatility amplified by heavy derivatives positioning and persistent short interest. While large call premiums signal upside conviction, sudden market corrections can trigger rapid de-risking. Traders should watch whether spot buying volume validates the options activity and monitor broader tech sector sentiment for sustained momentum.
BE: Pre-Earnings Momentum and Defined Volatility Ranges
In the tokenized and equity-linked sector, BE has garnered considerable attention, capturing a positive sentiment profile with a social hype score exceeding 717,000. The catalyst is a well-defined pre-earnings rally ahead of Q3 reporting. Consensus estimates anticipate $1.07 billion in revenue and an earnings per share (EPS) figure of $0.70. With derivatives pricing reflecting an expected move of roughly 8.40%, market volatility is projected to spike around the release. Consequently, analysts have noted a clear "no-trade" caution for participants seeking to avoid binary earnings risk.
Risks & What to Watch: The primary hazard for BE is an earnings-day volatility crush or an adverse reaction if actual revenue misses the $1.07 billion benchmark. Traders should avoid chasing the immediate announcement spike and instead watch post-earnings stabilization to see if price holds key support levels once the 8.40% expected move plays out.
MAX: Micro-Cap Speculation and Liquidity Realities
On the opposite end of the market capitalization spectrum, MAX has experienced an explosive 24-hour rally of 448.33%, pushing its price to approximately 0.00003533. This move generated a 24-hour trading volume of roughly $167,835 against a market capitalization of $34,504. The rapid ascent has placed MAX on high-momentum screeners where traders track assets attempting to beat max resistance boundaries (frequently tracked as BEAT MAX setups). However, the underlying on-chain profile indicates an extremely fragile market structure.
Risks & What to Watch: MAX presents acute structural risks. The token maintains only $17,982 in pooled liquidity across just 345 holders. In an environment with such shallow liquidity, even moderate sell orders can cause severe price slippage and rapid capital drawdown. Traders tracking MAX must look beyond percentage gains and closely watch on-chain liquidity depth and wallet concentration before engaging.
Strategic Outlook
Successfully navigating these trending assets requires recognizing that each represents a completely different risk-reward profile. While IREN and BE provide institutional-scale liquidity driven by options flows and quarterly earnings metrics, micro-cap movers like MAX rely on fragile liquidity pools that can evaporate quickly. When analyzing high-momentum candidates such as IREN, BE, and MAX—or scanning watchlists grouped under BEAT MAX—investors should prioritize risk management, confirm volume validity, and avoid overextending into low-liquidity spikes.
#IREN #QQQ #BITCOIN
Tickers covered: IREN, BEAT, MAX.
Market Divergence: Analyzing Trends, Drivers, and Risks for IREN, BE, and MAX
The digital asset landscape is currently displaying sharp divergence, with market attention splitting between institutional AI infrastructure plays, earnings-driven momentum, and ultra-high-risk micro-cap rotations. Among the distinct assets drawing attention across trading desks and social feeds are IREN, BE, and MAX. Whether monitoring established derivatives flow or screening high-velocity movers under automated watchlist labels like IREN,BEAT MAX, market participants must distinguish between fundamental catalysts and speculative momentum.
IREN: Options Flow and the AI Infrastructure Narrative
IREN has recorded elevated social engagement, registering positive sentiment with a social hype score surpassing 209,000. Much of this interest reflects active repositioning between bears and bulls. While short sellers previously logged over $1.2 billion in combined paper gains across bets on IREN and APLD, aggressive long-term call accumulation has surfaced. Notably, bullish 149-day $39 calls recently absorbed $970,000 in premium, alongside 120-day $30 calls capturing $412,000 in premium. Influential analysts have highlighted IREN as an AI trade that still has legs, expanding its appeal beyond pure-play mining.
Risks & What to Watch: The key risk for IREN lies in volatility amplified by heavy derivatives positioning and persistent short interest. While large call premiums signal upside conviction, sudden market corrections can trigger rapid de-risking. Traders should watch whether spot buying volume validates the options activity and monitor broader tech sector sentiment for sustained momentum.
BE: Pre-Earnings Momentum and Defined Volatility Ranges
In the tokenized and equity-linked sector, BE has garnered considerable attention, capturing a positive sentiment profile with a social hype score exceeding 717,000. The catalyst is a well-defined pre-earnings rally ahead of Q3 reporting. Consensus estimates anticipate $1.07 billion in revenue and an earnings per share (EPS) figure of $0.70. With derivatives pricing reflecting an expected move of roughly 8.40%, market volatility is projected to spike around the release. Consequently, analysts have noted a clear "no-trade" caution for participants seeking to avoid binary earnings risk.
Risks & What to Watch: The primary hazard for BE is an earnings-day volatility crush or an adverse reaction if actual revenue misses the $1.07 billion benchmark. Traders should avoid chasing the immediate announcement spike and instead watch post-earnings stabilization to see if price holds key support levels once the 8.40% expected move plays out.
MAX: Micro-Cap Speculation and Liquidity Realities
On the opposite end of the market capitalization spectrum, MAX has experienced an explosive 24-hour rally of 448.33%, pushing its price to approximately 0.00003533. This move generated a 24-hour trading volume of roughly $167,835 against a market capitalization of $34,504. The rapid ascent has placed MAX on high-momentum screeners where traders track assets attempting to beat max resistance boundaries (frequently tracked as BEAT MAX setups). However, the underlying on-chain profile indicates an extremely fragile market structure.
Risks & What to Watch: MAX presents acute structural risks. The token maintains only $17,982 in pooled liquidity across just 345 holders. In an environment with such shallow liquidity, even moderate sell orders can cause severe price slippage and rapid capital drawdown. Traders tracking MAX must look beyond percentage gains and closely watch on-chain liquidity depth and wallet concentration before engaging.
Strategic Outlook
Successfully navigating these trending assets requires recognizing that each represents a completely different risk-reward profile. While IREN and BE provide institutional-scale liquidity driven by options flows and quarterly earnings metrics, micro-cap movers like MAX rely on fragile liquidity pools that can evaporate quickly. When analyzing high-momentum candidates such as IREN, BE, and MAX—or scanning watchlists grouped under BEAT MAX—investors should prioritize risk management, confirm volume validity, and avoid overextending into low-liquidity spikes.
#IREN #QQQ #BITCOIN
Tickers covered: IREN, BEAT, MAX.
8

·
--

Article
Over the past 24 hours, IREN long liquidations outpaced shorts by about 18xOver the past 24 hours, IREN on the US stock side saw about $128,000 in long liquidations, while shorts totaled only about $7,100—nearly an 18-to-1 gap.
#TradFi #IREN #美股 #Liquidations
TradFi liquidations in the same window totaled about $30.05 million: roughly $22.1 million in longs and $7.95 million in shorts. IREN alone saw about $128,000 in long liquidations versus roughly $7,100 in shorts—about an 18-to-1 ratio.
Among US stock names, long liquidations are nearly 18 times higher while shorts are almost quiet—is all the leverage piled on the IREN side?
View in real time: https://www.coinboss.com/tradfi-liquidations
Over the past 24 hours, IREN long liquidations outpaced shorts by about 18x
Over the past 24 hours, IREN on the US stock side saw about $128,000 in long liquidations, while shorts totaled only about $7,100—nearly an 18-to-1 gap.
#TradFi #IREN #美股 #Liquidations
TradFi liquidations in the same window totaled about $30.05 million: roughly $22.1 million in longs and $7.95 million in shorts. IREN alone saw about $128,000 in long liquidations versus roughly $7,100 in shorts—about an 18-to-1 ratio.
Among US stock names, long liquidations are nearly 18 times higher while shorts are almost quiet—is all the leverage piled on the IREN side?
View in real time: https://www.coinboss.com/tradfi-liquidations
30
·
--
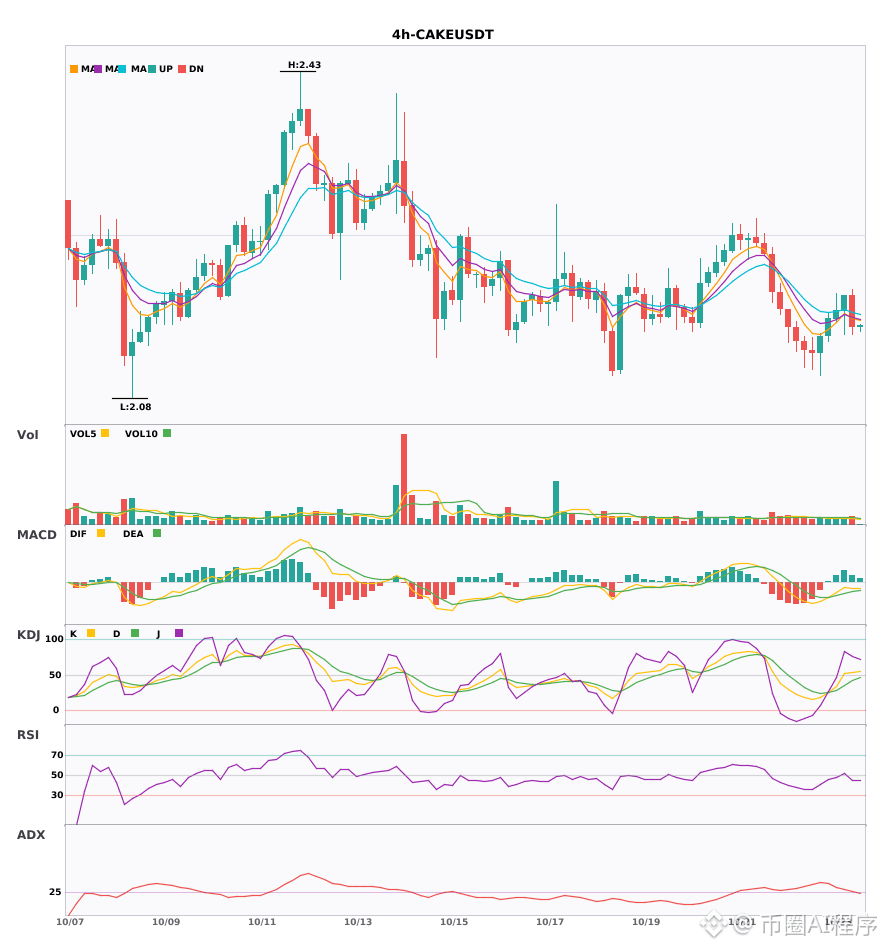
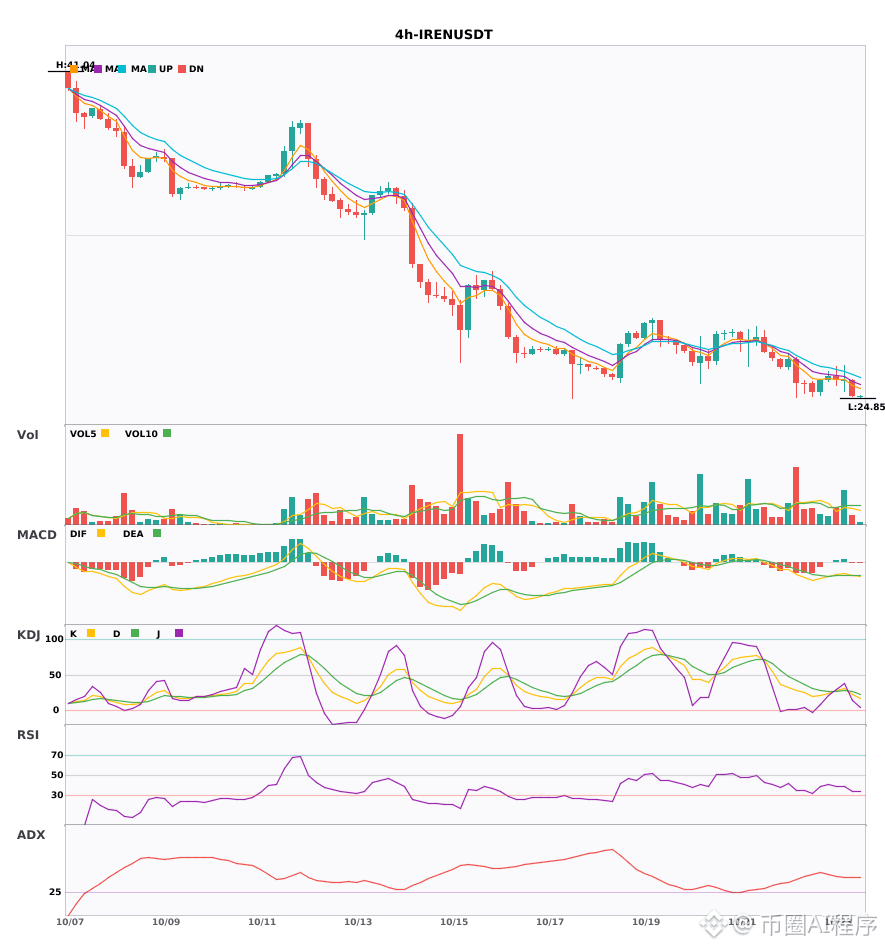
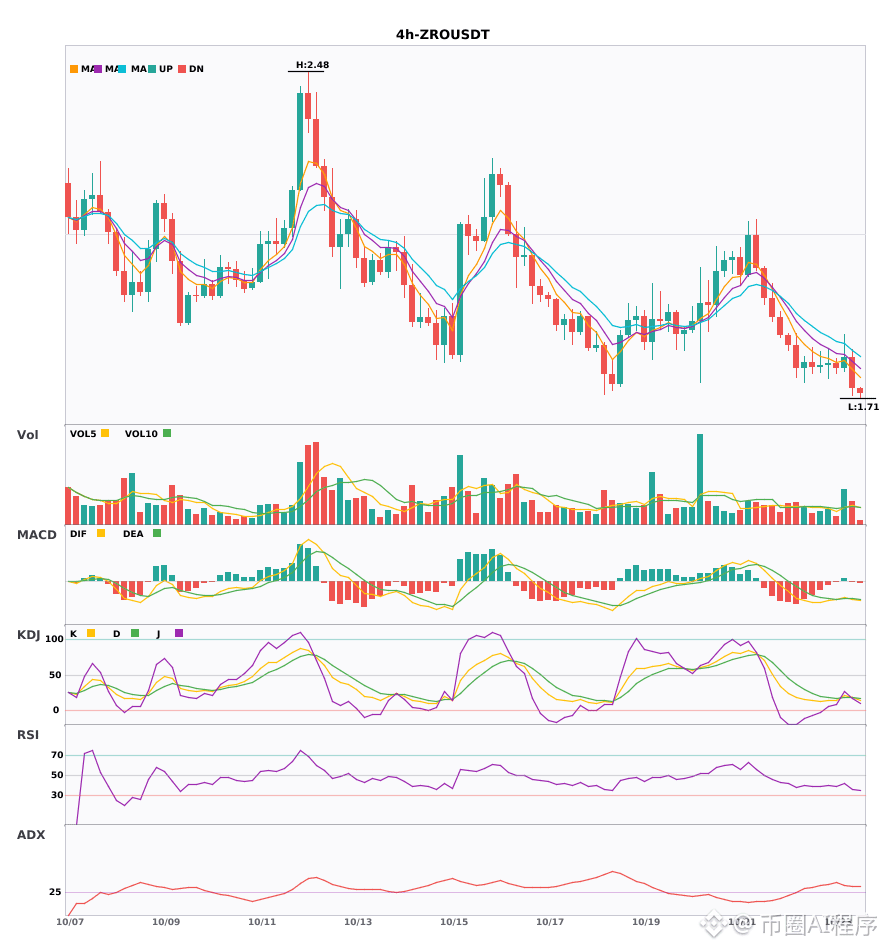
Multi-timeframe confluence: $CAKE / $IREN / $ZRO -hour weakness; daily bearish trend confirmed 🔥
════════════════════
🟢 $CAKE 4-hour bearish signal
⚠️Technical analysis: Daily bearish confluence confirmed | 4-hour entry: EMA5 crosses below EMA8, short-term bearish | Volume normal (1.2x)
════════════════════
🟢 $IREN 4-hour bearish signal
⚠️Technical analysis: Daily bearish confluence confirmed | 4-hour entry: MACD bearish cross below zero, bearish momentum accelerating | EMA5 < EMA8 < EMA13, bearish alignment | KDJ death cross, short-term bearish (K: 22.2, D: 26.4) | Volume increased (1.8x)
════════════════════
🟢 $ZRO 4-hour bearish signal
⚠️Technical analysis: Daily bearish confluence confirmed | 4-hour entry: MACD bearish cross below zero, bearish momentum accelerating | EMA5 < EMA8 < EMA13, bearish alignment | KDJ death cross, short-term bearish (K: 18.0, D: 18.2) | Volume increased (2.0x)
📢Market update: Binance Has Completed the Stargate Finance (STG) Token Merge to LayerZero (ZRO)
════════════════════
🔔 Follow for first-hand market movement alerts 🔔
#多周期共振 #CAKE #IREN #ZRO
📌 When trading, pay attention to whether the candlestick pattern matches
════════════════════
🟢 $CAKE 4-hour bearish signal
⚠️Technical analysis: Daily bearish confluence confirmed | 4-hour entry: EMA5 crosses below EMA8, short-term bearish | Volume normal (1.2x)
════════════════════
🟢 $IREN 4-hour bearish signal
⚠️Technical analysis: Daily bearish confluence confirmed | 4-hour entry: MACD bearish cross below zero, bearish momentum accelerating | EMA5 < EMA8 < EMA13, bearish alignment | KDJ death cross, short-term bearish (K: 22.2, D: 26.4) | Volume increased (1.8x)
════════════════════
🟢 $ZRO 4-hour bearish signal
⚠️Technical analysis: Daily bearish confluence confirmed | 4-hour entry: MACD bearish cross below zero, bearish momentum accelerating | EMA5 < EMA8 < EMA13, bearish alignment | KDJ death cross, short-term bearish (K: 18.0, D: 18.2) | Volume increased (2.0x)
📢Market update: Binance Has Completed the Stargate Finance (STG) Token Merge to LayerZero (ZRO)
════════════════════
🔔 Follow for first-hand market movement alerts 🔔
#多周期共振 #CAKE #IREN #ZRO
📌 When trading, pay attention to whether the candlestick pattern matches
21
·
--
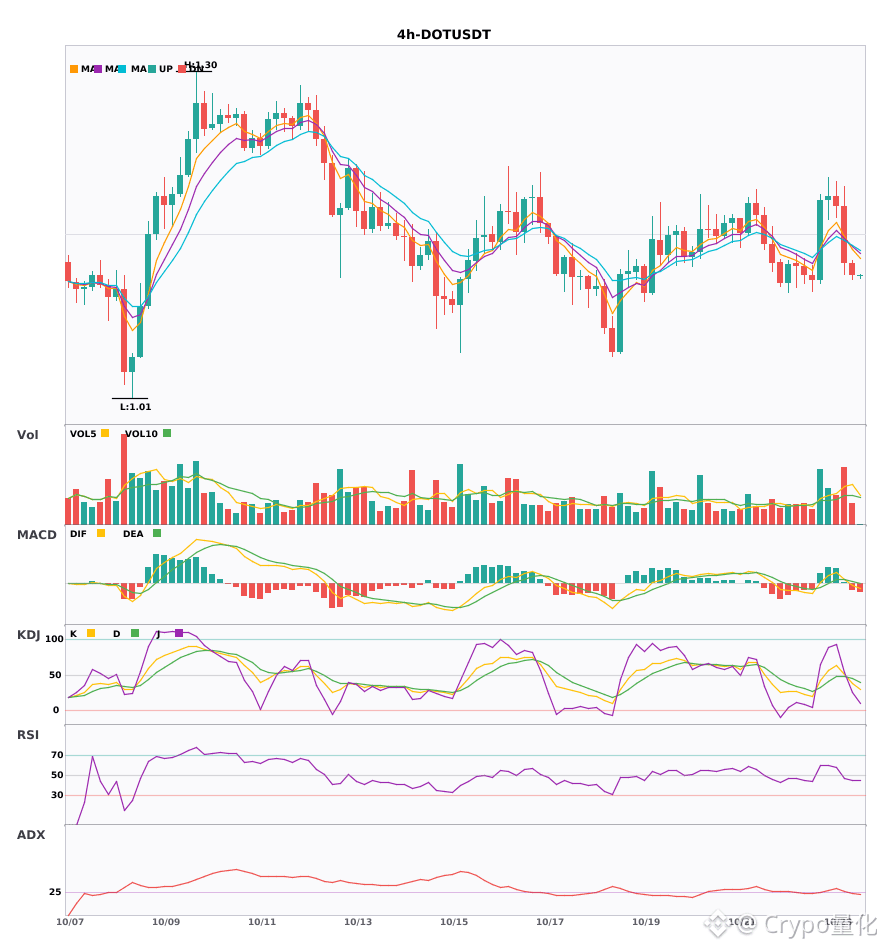
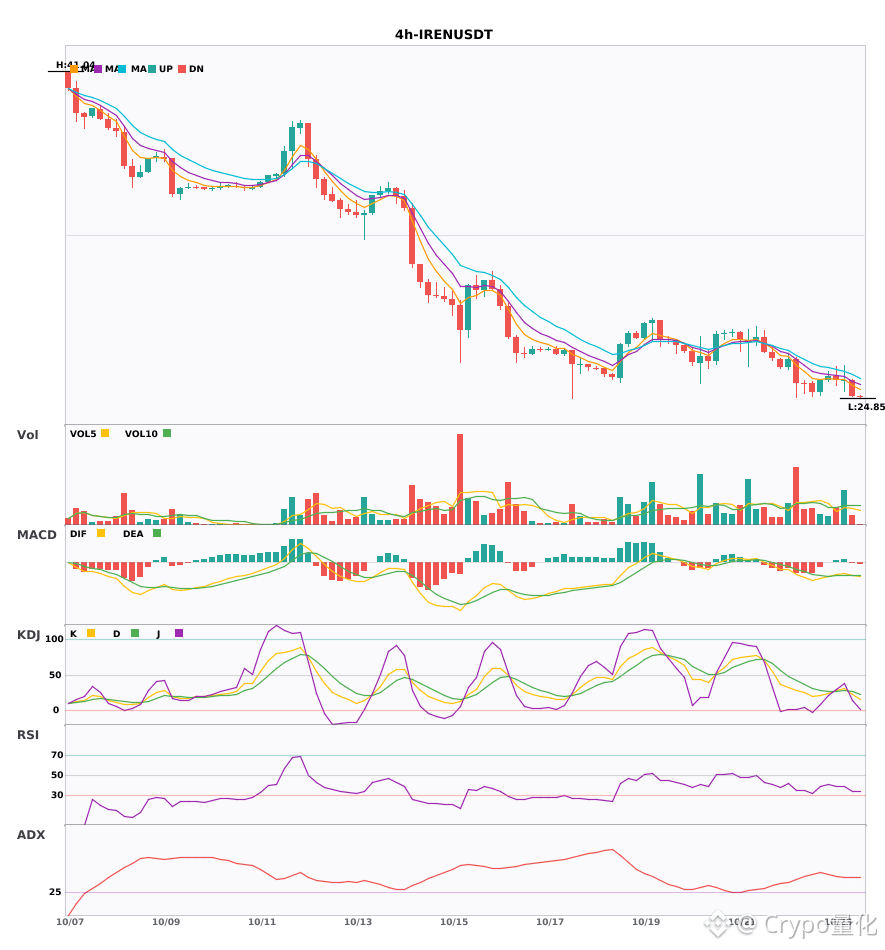
3 4-hour bearish alerts: $APE / $DOT / $IREN🔥
════════════════════
🟢 $APE 4-hour bearish signal
⚠️Technical analysis: ADX(36): strong trending market | MACD bearish crossover below zero, bearish momentum accelerating | EMA5 < EMA8 < EMA13, bearish alignment | KDJ in oversold territory; watch for a potential rebound (K: 18.5, D: 18.5) | Volume increased (1.6x)
📢Market update: Binance Has Completed the Wise Monkey (MONKY) Airdrop Distribution to FLOKI (FLOKI) and ApeCoin (APE)
════════════════════
🟢 $DOT 4-hour bearish signal
⚠️Technical analysis: ADX(27): trend is forming; opportunity to participate | MACD bearish crossover below zero, bearish momentum accelerating | EMA5 crossed below EMA8, short-term outlook turning bearish | KDJ bearish crossover, short-term outlook bearish (K: 38.4, D: 45.1) | Volume increased (1.9x)
════════════════════
🟢 $IREN 4-hour bearish signal
⚠️Technical analysis: ADX(42): strong trending market | MACD bearish crossover below zero, bearish momentum accelerating | EMA5 < EMA8 < EMA13, bearish alignment | KDJ bearish crossover, short-term outlook bearish (K: 22.2, D: 26.4) | Volume increased (1.8x)
════════════════════
🔔 Follow for real-time market alerts 🔔
#技术分析 #APE #DOT #IREN
📌 When trading, pay attention to whether the candlestick pattern confirms the signal
3 4-hour bearish alerts: $APE / $DOT / $IREN 🔥
════════════════════
🟢 $APE 4-hour bearish signal
⚠️Technical analysis: ADX(36): strong trending market | MACD bearish crossover below zero, bearish momentum accelerating | EMA5 < EMA8 < EMA13, bearish alignment | KDJ in oversold territory; watch for a potential rebound (K: 18.5, D: 18.5) | Volume increased (1.6x)
📢Market update: Binance Has Completed the Wise Monkey (MONKY) Airdrop Distribution to FLOKI (FLOKI) and ApeCoin (APE)
════════════════════
🟢 $DOT 4-hour bearish signal
⚠️Technical analysis: ADX(27): trend is forming; opportunity to participate | MACD bearish crossover below zero, bearish momentum accelerating | EMA5 crossed below EMA8, short-term outlook turning bearish | KDJ bearish crossover, short-term outlook bearish (K: 38.4, D: 45.1) | Volume increased (1.9x)
════════════════════
🟢 $IREN 4-hour bearish signal
⚠️Technical analysis: ADX(42): strong trending market | MACD bearish crossover below zero, bearish momentum accelerating | EMA5 < EMA8 < EMA13, bearish alignment | KDJ bearish crossover, short-term outlook bearish (K: 22.2, D: 26.4) | Volume increased (1.8x)
════════════════════
🔔 Follow for real-time market alerts 🔔
#技术分析 #APE #DOT #IREN
📌 When trading, pay attention to whether the candlestick pattern confirms the signal
════════════════════
🟢 $APE 4-hour bearish signal
⚠️Technical analysis: ADX(36): strong trending market | MACD bearish crossover below zero, bearish momentum accelerating | EMA5 < EMA8 < EMA13, bearish alignment | KDJ in oversold territory; watch for a potential rebound (K: 18.5, D: 18.5) | Volume increased (1.6x)
📢Market update: Binance Has Completed the Wise Monkey (MONKY) Airdrop Distribution to FLOKI (FLOKI) and ApeCoin (APE)
════════════════════
🟢 $DOT 4-hour bearish signal
⚠️Technical analysis: ADX(27): trend is forming; opportunity to participate | MACD bearish crossover below zero, bearish momentum accelerating | EMA5 crossed below EMA8, short-term outlook turning bearish | KDJ bearish crossover, short-term outlook bearish (K: 38.4, D: 45.1) | Volume increased (1.9x)
════════════════════
🟢 $IREN 4-hour bearish signal
⚠️Technical analysis: ADX(42): strong trending market | MACD bearish crossover below zero, bearish momentum accelerating | EMA5 < EMA8 < EMA13, bearish alignment | KDJ bearish crossover, short-term outlook bearish (K: 22.2, D: 26.4) | Volume increased (1.8x)
════════════════════
🔔 Follow for real-time market alerts 🔔
#技术分析 #APE #DOT #IREN
📌 When trading, pay attention to whether the candlestick pattern confirms the signal
4
·
--
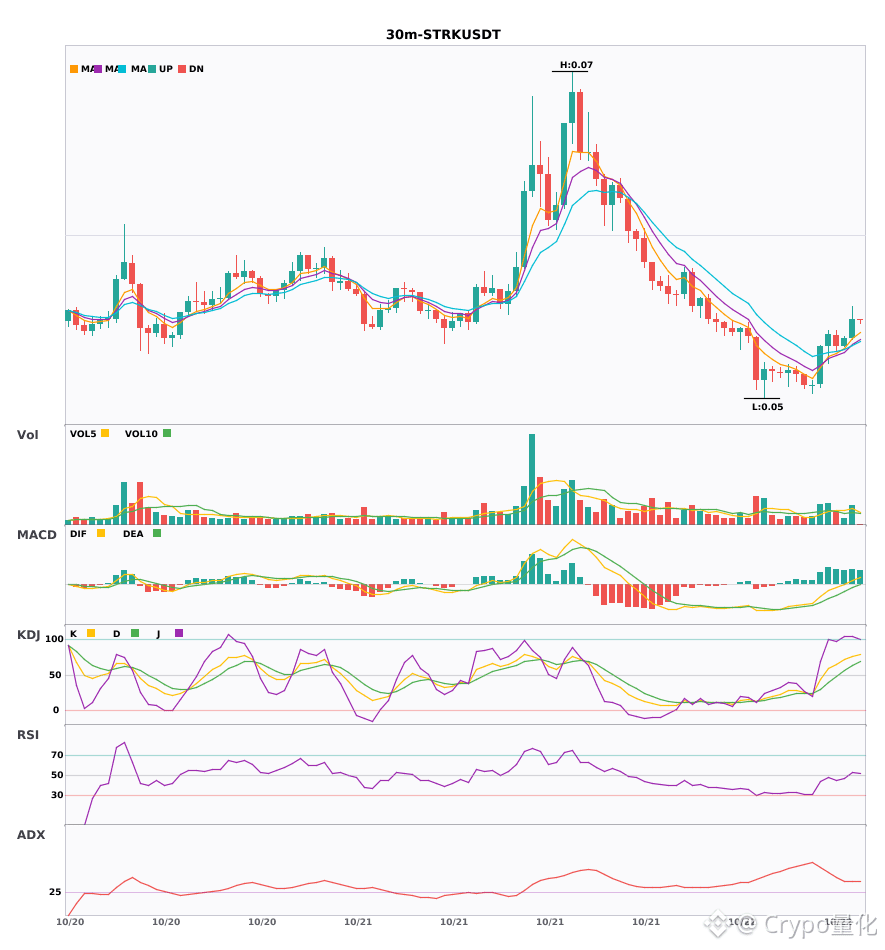
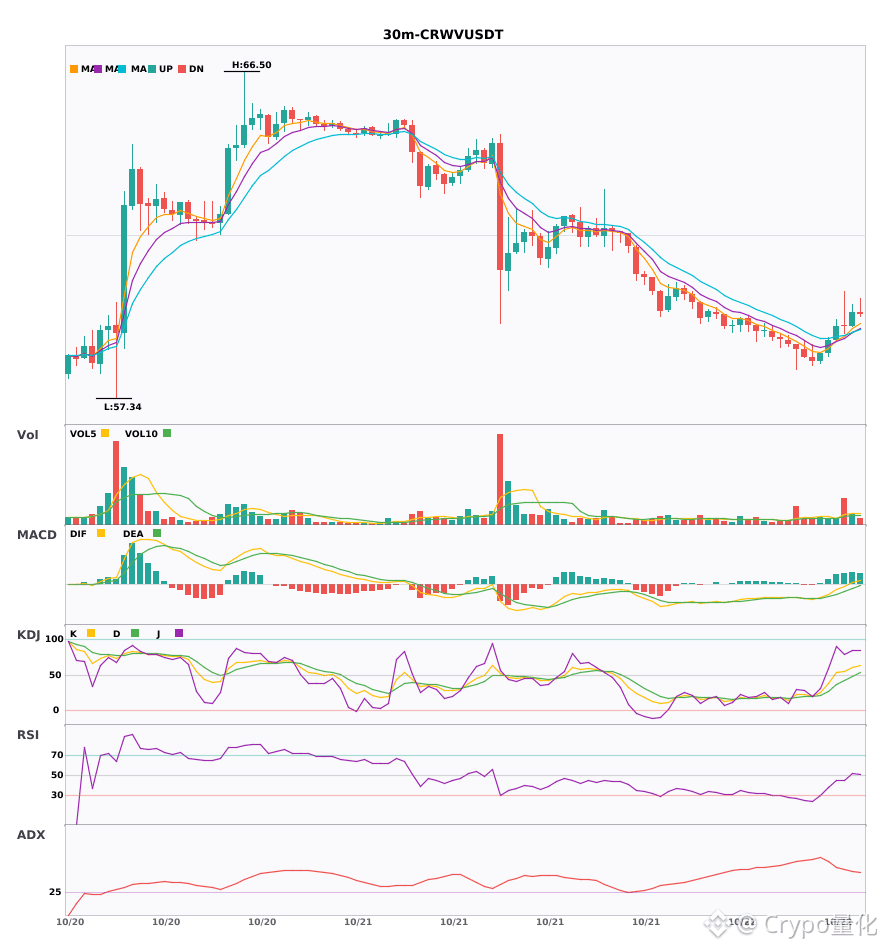
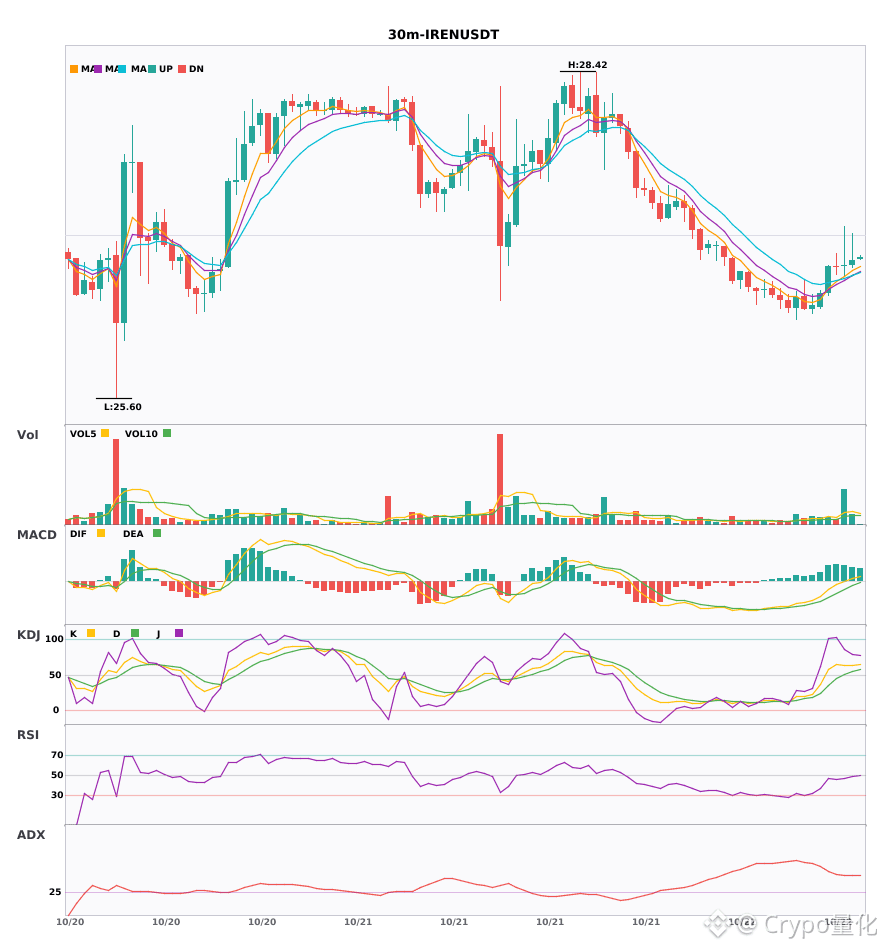
$STRK / $CRWV / $IREN 30-minute bullish bias, short-term confluence opportunity 🔥
════════════════════
🔴 $STRK 30-minute bullish signal
⚠️ Technical analysis: ADX(41) indicates a clear trending market | MACD DIF breaks above the zero line, signaling a bullish trend | EMA5 > EMA8 > EMA13, bullish alignment | KDJ is strong, with bulls in control (K: 76.5, D: 63.0) | Volume increases (1.6x)
════════════════════
🔴 $CRWV 30-minute bullish signal
⚠️ Technical analysis: ADX(51) indicates a very strong trend (watch for an overheated pullback) | MACD DIF breaks above the zero line, signaling a bullish trend | Moving averages are converging as momentum builds; a directional move is imminent | Volume surges (3.0x)
════════════════════
🔴 $IREN 30-minute bullish signal
⚠️ Technical analysis: ADX(47) indicates a very strong trend (watch for an overheated pullback) | MACD DIF breaks above the zero line, signaling a bullish trend | Moving averages are converging as momentum builds; a directional move is imminent | KDJ is strong, with bulls in control (K: 63.0, D: 55.0) | Volume surges (3.9x)
════════════════════
🔔 Follow for first-hand updates on unusual market movements 🔔
#技术分析 #STRK #CRWV #IREN
📌 When trading, pay attention to whether the candlestick pattern confirms the setup
════════════════════
🔴 $STRK 30-minute bullish signal
⚠️ Technical analysis: ADX(41) indicates a clear trending market | MACD DIF breaks above the zero line, signaling a bullish trend | EMA5 > EMA8 > EMA13, bullish alignment | KDJ is strong, with bulls in control (K: 76.5, D: 63.0) | Volume increases (1.6x)
════════════════════
🔴 $CRWV 30-minute bullish signal
⚠️ Technical analysis: ADX(51) indicates a very strong trend (watch for an overheated pullback) | MACD DIF breaks above the zero line, signaling a bullish trend | Moving averages are converging as momentum builds; a directional move is imminent | Volume surges (3.0x)
════════════════════
🔴 $IREN 30-minute bullish signal
⚠️ Technical analysis: ADX(47) indicates a very strong trend (watch for an overheated pullback) | MACD DIF breaks above the zero line, signaling a bullish trend | Moving averages are converging as momentum builds; a directional move is imminent | KDJ is strong, with bulls in control (K: 63.0, D: 55.0) | Volume surges (3.9x)
════════════════════
🔔 Follow for first-hand updates on unusual market movements 🔔
#技术分析 #STRK #CRWV #IREN
📌 When trading, pay attention to whether the candlestick pattern confirms the setup
16

·
--
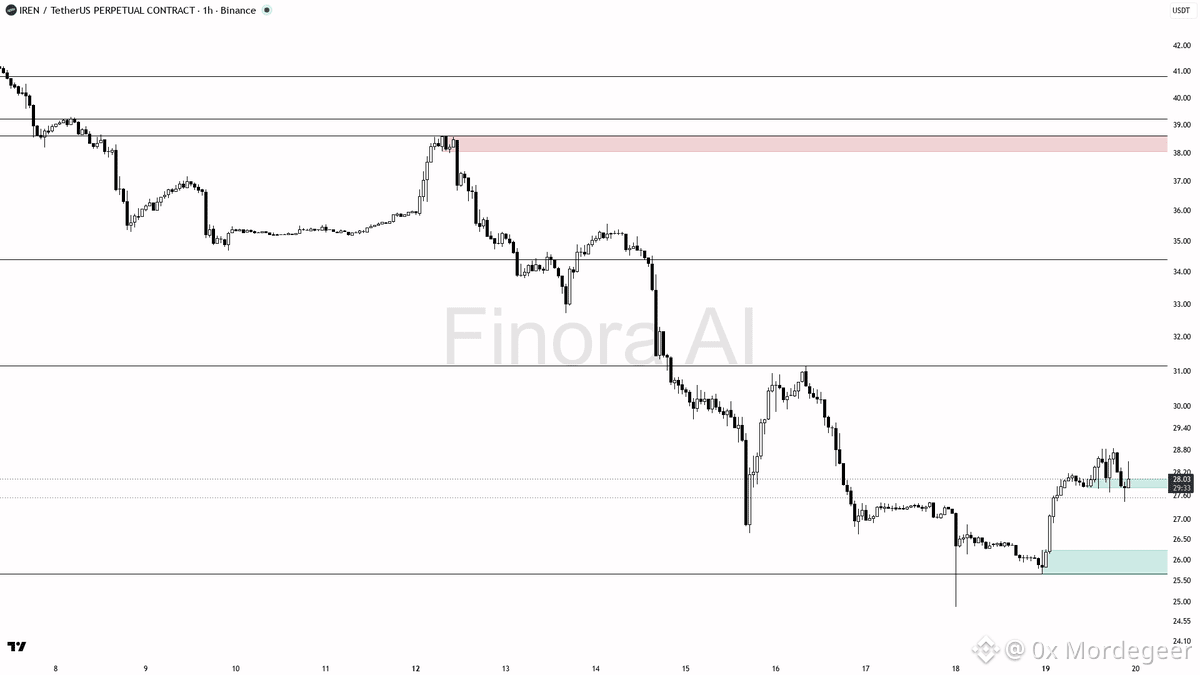
📊 $IREN Technical Analysis & Setup
$IREN is showing strong bullish momentum, up 8% over the last 24 hours after a clean liquidity sweep above the 28.07 resistance level. Price action is currently maintaining an aggressive upward structure across lower timeframes.
• Key Support / Demand: 25.50, 26.20 zone
• Resistance / Supply Targets: 30.00 and 32.50
• Trigger / Confirmation: Daily candle close holding above 28.10
• Risk / Invalidation: Clean break and close below 24.80
• Market Execution: Monitor order book depth and volume continuation before scaling into positions during volatility.
Always prioritize risk management and wait for confirmation.
DYOR — Educational setup, not financial advice.
#BinanceSquare #Crypto #IREN #Trading
8

·
--
IREN Binance TradFi perpetual (traditional finance category)—let’s start with the data. What matters more now is watching the decline and trading volume together to tell whether this is panic selling. At the 5-minute close at 2026-10-20 21:35 Beijing time: -4.06%. At 2026-10-20 21:35:01 Beijing time, the price was 25.69, 24h turnover was 18.6987 million, below the VWAP of 26.6455, with volume at 11.1x.
Can the price reclaim the VWAP at 26.6455 on a pullback? After volume surged to 11.1x, will it immediately contract again? Don’t jump to conclusions in the short term—let the next candle’s trading speak for itself.
#IREN #Unusual Activity Alert
Can the price reclaim the VWAP at 26.6455 on a pullback? After volume surged to 11.1x, will it immediately contract again? Don’t jump to conclusions in the short term—let the next candle’s trading speak for itself.
#IREN #Unusual Activity Alert
6
Log in to explore more content
Join global crypto users on Binance Square
⚡️ Get latest and useful information about crypto.
💬 Trusted by the world’s largest crypto exchange.
👍 Discover real insights from verified creators.
Email / Phone number
Trending Topics
1
#BinanceReports80%Recoveryof$6.3BillioninLossesfromHackIncident
15,622 views
149 Discussing
2
#HeYiSaysWithdrawalsExpectedtoResumeWithin42Hours
27,086 views
548 Discussing
3
#CZSaysCompensationIsinPlaceUsersAreProtected
30,433 views
435 Discussing
4
#RichardTengSaysBinanceWillCoverAllHackedLosseswithCompanyFunds
5,019 views
33 Discussing
5
#IntelHasItsWorstDaySince1974
3,768 views
135 Discussing
6
#TRMCambodianCasinosReceived$1.07BInCrypto
1,234 views
43 Discussing
7
#USDCCirculationFallsAbout800MInSevenDays
18,719 views
309 Discussing
8
#SuspectedNorthKoreaAttacksAccountForNearly89%OfCryptoHackLosses
8,067 views
72 Discussing
9
#OpenAICutsFundraisingTargetBy$10B
1,555 views
56 Discussing
10
#ASICHasReceivedNoPredictionMarketApplications
30,845 views
731 Discussing