

#glassnode
glassnode
236,774 views
661 Discussing
Hot
Latest

🚨 BITCOIN UPDATE: MOST BTC HOLDERS ARE IN PROFIT! 📈🔥
According to Glassnode, nearly three-quarters of Bitcoin’s circulating supply is currently in profit. Meanwhile, the average US spot Bitcoin ETF holder is sitting on unusually large unrealized gains. 👀
💡 What does this mean?
It shows that a large portion of Bitcoin holders are currently in a profitable position. However, if prices rise further, the market could continue moving upward. On the other hand, some holders may decide to take profits, which could create selling pressure.
The big question is: Will Bitcoin continue its upward move, or will profit-taking bring a pullback? 🤔
What do you think, BTC holders? Bullish or bearish from here? 👇
$BTC
#Bitcoin #Glassnode #BinanceSquare
🚨 BITCOIN UPDATE: MOST BTC HOLDERS ARE IN PROFIT! 📈🔥
According to Glassnode, nearly three-quarters of Bitcoin’s circulating supply is currently in profit. Meanwhile, the average US spot Bitcoin ETF holder is sitting on unusually large unrealized gains. 👀
💡 What does this mean?
It shows that a large portion of Bitcoin holders are currently in a profitable position. However, if prices rise further, the market could continue moving upward. On the other hand, some holders may decide to take profits, which could create selling pressure.
The big question is: Will Bitcoin continue its upward move, or will profit-taking bring a pullback? 🤔
What do you think, BTC holders? Bullish or bearish from here? 👇
$BTC
#Bitcoin #Glassnode #BinanceSquare
According to Glassnode, nearly three-quarters of Bitcoin’s circulating supply is currently in profit. Meanwhile, the average US spot Bitcoin ETF holder is sitting on unusually large unrealized gains. 👀
💡 What does this mean?
It shows that a large portion of Bitcoin holders are currently in a profitable position. However, if prices rise further, the market could continue moving upward. On the other hand, some holders may decide to take profits, which could create selling pressure.
The big question is: Will Bitcoin continue its upward move, or will profit-taking bring a pullback? 🤔
What do you think, BTC holders? Bullish or bearish from here? 👇
$BTC
#Bitcoin #Glassnode #BinanceSquare


7
2
552

·
--
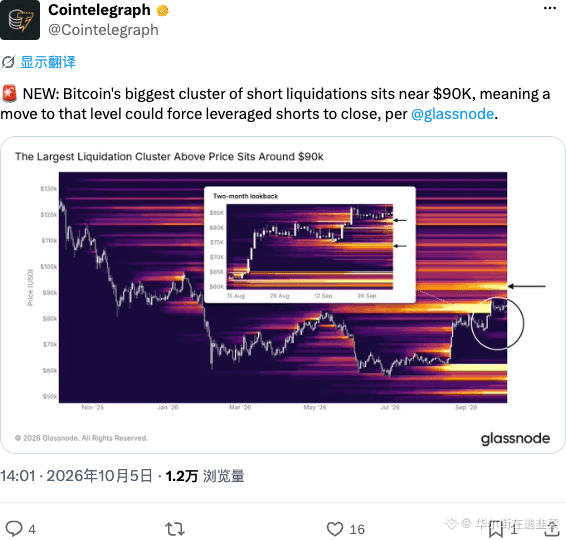
Glassnode exposes the truth: the largest nationwide short liquidation crowd is sitting around 90K.
The more bullish shorts gamble, the thicker the liquidation “fuel” piles up. Once the price taps up, forced liquidations instantly turn into buy orders—domino liquidations send it flying.
Fear is at an all-time low, yet the liquidation chart is nothing but a graveyard of shorts—textbook turning-point recipe.
Don’t take sides based on emotions—take sides based on the liquidation chart.
$BTC #Glassnode
Glassnode exposes the truth: the largest nationwide short liquidation crowd is sitting around 90K.
The more bullish shorts gamble, the thicker the liquidation “fuel” piles up. Once the price taps up, forced liquidations instantly turn into buy orders—domino liquidations send it flying.
Fear is at an all-time low, yet the liquidation chart is nothing but a graveyard of shorts—textbook turning-point recipe.
Don’t take sides based on emotions—take sides based on the liquidation chart.
$BTC #Glassnode
The more bullish shorts gamble, the thicker the liquidation “fuel” piles up. Once the price taps up, forced liquidations instantly turn into buy orders—domino liquidations send it flying.
Fear is at an all-time low, yet the liquidation chart is nothing but a graveyard of shorts—textbook turning-point recipe.
Don’t take sides based on emotions—take sides based on the liquidation chart.
$BTC #Glassnode
198

·
--
📰 Glassnode has marked the largest liquidation cluster above Bitcoin at around $90,000. As soon as the price touches this area, leveraged shorts may be forced to liquidate; consecutive buy-backs could further amplify volatility.
🔥 This is also the spot near $90,000 where things are truly most likely to “go wrong.” It’s not a simple price line, but a liquidation zone packed with a large number of short positions. Once triggering begins, the subsequent move could unfold faster than many people expect, even leading to a chain of liquidations.
👀 In the data from the past two months, there have also been smaller liquidation clusters around $83,000 and $75,000. That means it’s not only the path of squeezing shorts upward—if the price hits a dense area on the other side, it could just as easily accelerate.
To be honest, the structure’s biggest fear is leverage being taken too far. Even if you guess the direction correctly, you might not be able to hold through it. One quick sweep in the middle could first wipe out the high-leverage positions.
🤔 If the price first approaches these liquidation zones, will you reduce leverage in advance, or wait until they trigger and then trade along the direction?
#BTC #比特币 #合约清算 #Glassnode
📰 Glassnode has marked the largest liquidation cluster above Bitcoin at around $90,000. As soon as the price touches this area, leveraged shorts may be forced to liquidate; consecutive buy-backs could further amplify volatility.
🔥 This is also the spot near $90,000 where things are truly most likely to “go wrong.” It’s not a simple price line, but a liquidation zone packed with a large number of short positions. Once triggering begins, the subsequent move could unfold faster than many people expect, even leading to a chain of liquidations.
👀 In the data from the past two months, there have also been smaller liquidation clusters around $83,000 and $75,000. That means it’s not only the path of squeezing shorts upward—if the price hits a dense area on the other side, it could just as easily accelerate.
To be honest, the structure’s biggest fear is leverage being taken too far. Even if you guess the direction correctly, you might not be able to hold through it. One quick sweep in the middle could first wipe out the high-leverage positions.
🤔 If the price first approaches these liquidation zones, will you reduce leverage in advance, or wait until they trigger and then trade along the direction?
#BTC #比特币 #合约清算 #Glassnode
🔥 This is also the spot near $90,000 where things are truly most likely to “go wrong.” It’s not a simple price line, but a liquidation zone packed with a large number of short positions. Once triggering begins, the subsequent move could unfold faster than many people expect, even leading to a chain of liquidations.
👀 In the data from the past two months, there have also been smaller liquidation clusters around $83,000 and $75,000. That means it’s not only the path of squeezing shorts upward—if the price hits a dense area on the other side, it could just as easily accelerate.
To be honest, the structure’s biggest fear is leverage being taken too far. Even if you guess the direction correctly, you might not be able to hold through it. One quick sweep in the middle could first wipe out the high-leverage positions.
🤔 If the price first approaches these liquidation zones, will you reduce leverage in advance, or wait until they trigger and then trade along the direction?
#BTC #比特币 #合约清算 #Glassnode

43
·
--
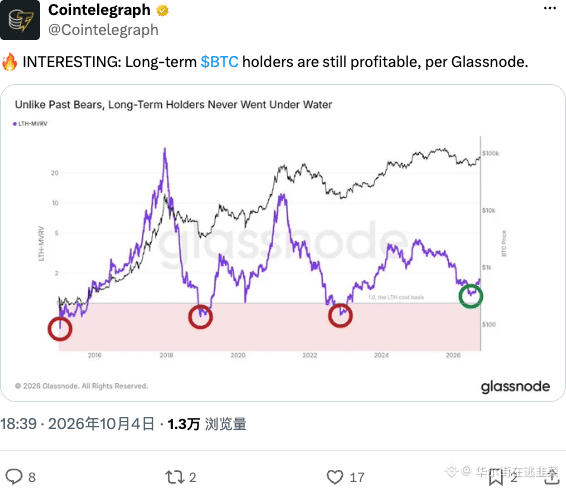
Down to now, long-term holders are still all in profit—Glassnode on-chain data is right here. The old holders’ cost basis is extremely low, and panic selling can’t squeeze out at all; the bottom-lot structure is harder than you’d imagine. But the thicker the profits, the stronger the urge to take profits: next, keep a close watch on the LTH supply—once it declines continuously, it likely means that big whales are quietly distributing. Don’t just stare at the candlestick chart.
$BTC #Glassnode #On-chain data
Down to now, long-term holders are still all in profit—Glassnode on-chain data is right here. The old holders’ cost basis is extremely low, and panic selling can’t squeeze out at all; the bottom-lot structure is harder than you’d imagine. But the thicker the profits, the stronger the urge to take profits: next, keep a close watch on the LTH supply—once it declines continuously, it likely means that big whales are quietly distributing. Don’t just stare at the candlestick chart.
$BTC #Glassnode #On-chain data
$BTC #Glassnode #On-chain data
146

·
--
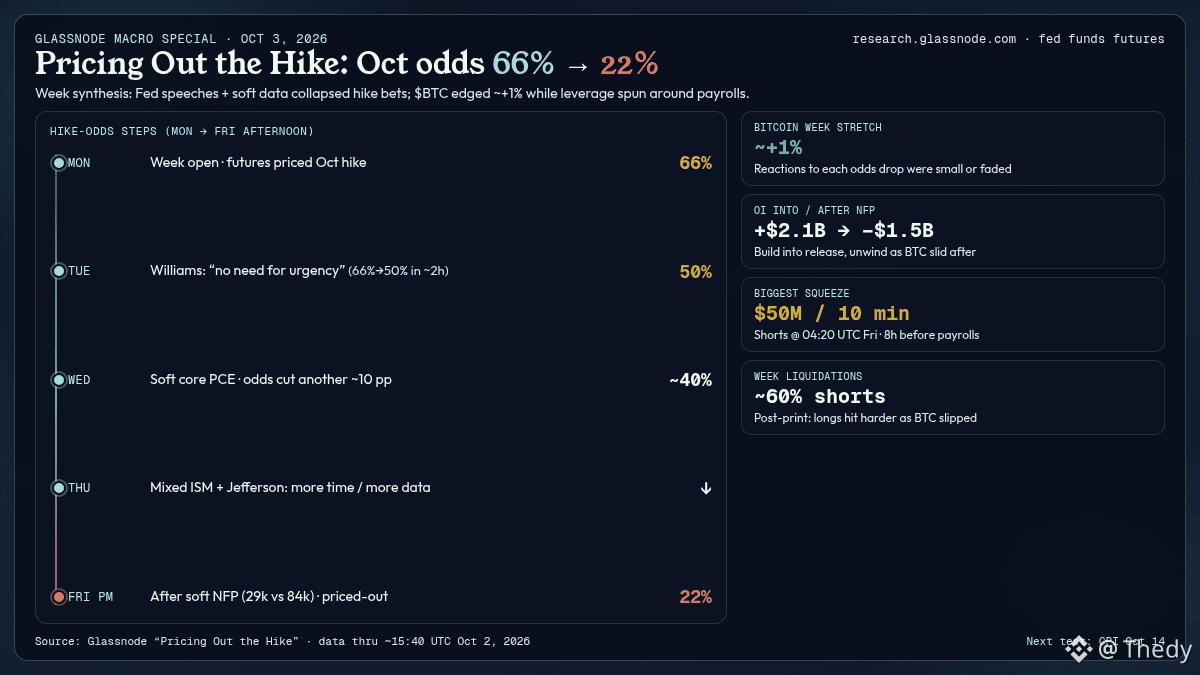
Glassnode (Macro Special, 03/10/2026) : « Pricing Out the Hike ». The odds of a Fed hike in October (fed funds futures) fell from 66% on Monday to 22% on Friday afternoon. Over the same stretch, $BTC a gained about +1 %.
FACTS (Glassnode, data up to ~15:40 UTC on 02/10)
• Monday 66% → after Williams (« no need for urgency ») 50% in ~2 h ; soft core PCE (~−10 pp) ; Jefferson + mixed ISM ; Friday PM 22% after soft NFP (29k vs 84k expected).
• Open interest : +$2.1B in the 24 hours before the NFP, then −$1.5B after the post-print slide.
• Biggest squeeze of the week : ~50M$ of shorts liquidated in 10 minutes at 04:20 UTC Friday (8 hours before the payrolls). Shorts ≈ 60% of the week’s liquidations.
• Yield curve : 10y–2y spread back to ~42 bp (after ~20 bp around the September hike). Next test cited : CPI on 14/10.
• Spot ~22:48 UTC 03/10 : $BTC ~84 780–84 800 (+~0.3% over 24h).
INTERPRETATION
This is not « BTC exploded on the soft NFP ». Glassnode mainly shows a gradual « pricing-out » of the October hike, with small price reactions—or reactions that were quickly reversed—and a leverage microstructure (build OI → overnight squeeze → unwind longs after the print). Dominant read = the market removed the October hike before the print; the NFP mostly confirmed.
SCENARIOS
• Base : October odds stay below ~30% and $BTC consolidates 84k–86k while awaiting CPI on 14/10.
• Extension : core CPI below consensus → hike pushed to December, attempt to reclaim 87k.
• Risk : core CPI above → October odds rise toward 40%+ and pressure below 84k / a wall at 85k.
Question : for the next $BTC move, do you first look at the CPI on 14/10 or the open interest level before the print?
$BTC
#Bitcoin #Fed #Glassnode
Glassnode (Macro Special, 03/10/2026) : « Pricing Out the Hike ». The odds of a Fed hike in October (fed funds futures) fell from 66% on Monday to 22% on Friday afternoon. Over the same stretch, $BTC a gained about +1 %.
FACTS (Glassnode, data up to ~15:40 UTC on 02/10)
• Monday 66% → after Williams (« no need for urgency ») 50% in ~2 h ; soft core PCE (~−10 pp) ; Jefferson + mixed ISM ; Friday PM 22% after soft NFP (29k vs 84k expected).
• Open interest : +$2.1B in the 24 hours before the NFP, then −$1.5B after the post-print slide.
• Biggest squeeze of the week : ~50M$ of shorts liquidated in 10 minutes at 04:20 UTC Friday (8 hours before the payrolls). Shorts ≈ 60% of the week’s liquidations.
• Yield curve : 10y–2y spread back to ~42 bp (after ~20 bp around the September hike). Next test cited : CPI on 14/10.
• Spot ~22:48 UTC 03/10 : $BTC ~84 780–84 800 (+~0.3% over 24h).
INTERPRETATION
This is not « BTC exploded on the soft NFP ». Glassnode mainly shows a gradual « pricing-out » of the October hike, with small price reactions—or reactions that were quickly reversed—and a leverage microstructure (build OI → overnight squeeze → unwind longs after the print). Dominant read = the market removed the October hike before the print; the NFP mostly confirmed.
SCENARIOS
• Base : October odds stay below ~30% and $BTC consolidates 84k–86k while awaiting CPI on 14/10.
• Extension : core CPI below consensus → hike pushed to December, attempt to reclaim 87k.
• Risk : core CPI above → October odds rise toward 40%+ and pressure below 84k / a wall at 85k.
Question : for the next $BTC move, do you first look at the CPI on 14/10 or the open interest level before the print?
$BTC
#Bitcoin #Fed #Glassnode
FACTS (Glassnode, data up to ~15:40 UTC on 02/10)
• Monday 66% → after Williams (« no need for urgency ») 50% in ~2 h ; soft core PCE (~−10 pp) ; Jefferson + mixed ISM ; Friday PM 22% after soft NFP (29k vs 84k expected).
• Open interest : +$2.1B in the 24 hours before the NFP, then −$1.5B after the post-print slide.
• Biggest squeeze of the week : ~50M$ of shorts liquidated in 10 minutes at 04:20 UTC Friday (8 hours before the payrolls). Shorts ≈ 60% of the week’s liquidations.
• Yield curve : 10y–2y spread back to ~42 bp (after ~20 bp around the September hike). Next test cited : CPI on 14/10.
• Spot ~22:48 UTC 03/10 : $BTC ~84 780–84 800 (+~0.3% over 24h).
INTERPRETATION
This is not « BTC exploded on the soft NFP ». Glassnode mainly shows a gradual « pricing-out » of the October hike, with small price reactions—or reactions that were quickly reversed—and a leverage microstructure (build OI → overnight squeeze → unwind longs after the print). Dominant read = the market removed the October hike before the print; the NFP mostly confirmed.
SCENARIOS
• Base : October odds stay below ~30% and $BTC consolidates 84k–86k while awaiting CPI on 14/10.
• Extension : core CPI below consensus → hike pushed to December, attempt to reclaim 87k.
• Risk : core CPI above → October odds rise toward 40%+ and pressure below 84k / a wall at 85k.
Question : for the next $BTC move, do you first look at the CPI on 14/10 or the open interest level before the print?
$BTC
#Bitcoin #Fed #Glassnode
52

·
--
Bullish
📊 Bitcoin vs. S&P 500: BTC Outperformance Momentum Flips Bullish!
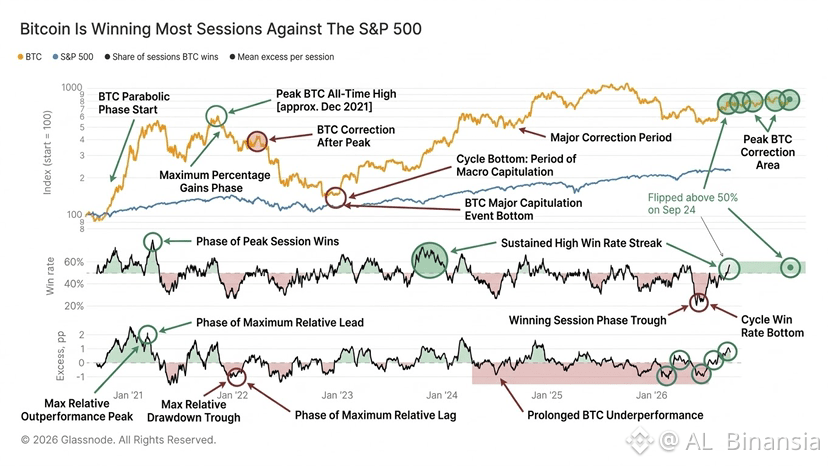
Glassnode data shows a significant macro shift: Bitcoin is winning the majority of trading sessions against the S&P 500 once again!
📌 Key Metric Breakdown:
• Win Rate Flip: BTC’s session win rate against the S&P 500 crossed above 50% on September 24.
• Mean Excess Return: Mean excess return per session turned positive, indicating strong relative alpha generation.
• Macro Context: Historically, sustained periods where BTC's win rate stays above 50% coincide with early-to-mid bull market acceleration phases.
🧠 Strategic Takeaway:
When Bitcoin consistently outperforms tradfi benchmarks like the S&P 500 on a daily basis, institutional capital allocation tends to shift from defensive equity positioning into digital asset exposure.
Are you overweight BTC or TradFi equities in Q4? Let’s discuss below! 👇
$BTC #Bitcoin #Glassnode #MacroEconomy #CryptoVsTradFi #BinanceSquare
📊 Bitcoin vs. S&P 500: BTC Outperformance Momentum Flips Bullish!
Glassnode data shows a significant macro shift: Bitcoin is winning the majority of trading sessions against the S&P 500 once again!
📌 Key Metric Breakdown:
• Win Rate Flip: BTC’s session win rate against the S&P 500 crossed above 50% on September 24.
• Mean Excess Return: Mean excess return per session turned positive, indicating strong relative alpha generation.
• Macro Context: Historically, sustained periods where BTC's win rate stays above 50% coincide with early-to-mid bull market acceleration phases.
🧠 Strategic Takeaway:
When Bitcoin consistently outperforms tradfi benchmarks like the S&P 500 on a daily basis, institutional capital allocation tends to shift from defensive equity positioning into digital asset exposure.
Are you overweight BTC or TradFi equities in Q4? Let’s discuss below! 👇
$BTC #Bitcoin #Glassnode #MacroEconomy #CryptoVsTradFi #BinanceSquare
Glassnode data shows a significant macro shift: Bitcoin is winning the majority of trading sessions against the S&P 500 once again!
📌 Key Metric Breakdown:
• Win Rate Flip: BTC’s session win rate against the S&P 500 crossed above 50% on September 24.
• Mean Excess Return: Mean excess return per session turned positive, indicating strong relative alpha generation.
• Macro Context: Historically, sustained periods where BTC's win rate stays above 50% coincide with early-to-mid bull market acceleration phases.
🧠 Strategic Takeaway:
When Bitcoin consistently outperforms tradfi benchmarks like the S&P 500 on a daily basis, institutional capital allocation tends to shift from defensive equity positioning into digital asset exposure.
Are you overweight BTC or TradFi equities in Q4? Let’s discuss below! 👇
$BTC #Bitcoin #Glassnode #MacroEconomy #CryptoVsTradFi #BinanceSquare
1
84

·
--
Ads and external links have been removed, and the following has been optimized:
📊 Glassnode Data:
• Average cost basis for BTC holders aged 1–2 years is approximately $97,000
• Average cost basis for holders aged 6–12 months is approximately $89,000
Both groups are currently in an unrealized loss position.
During the 2025 uptrend phase, investors who bought near the highs are seeing their daily outflow amounts at a yearly high; in the subsequent downtrend phase, investors who bought later face less selling pressure. The cost basis is influencing the selling behavior of different groups.
#BTC #Bitcoin #Glassnode
Ads and external links have been removed, and the following has been optimized:
📊 Glassnode Data:
• Average cost basis for BTC holders aged 1–2 years is approximately $97,000
• Average cost basis for holders aged 6–12 months is approximately $89,000
Both groups are currently in an unrealized loss position.
During the 2025 uptrend phase, investors who bought near the highs are seeing their daily outflow amounts at a yearly high; in the subsequent downtrend phase, investors who bought later face less selling pressure. The cost basis is influencing the selling behavior of different groups.
#BTC #Bitcoin #Glassnode
📊 Glassnode Data:
• Average cost basis for BTC holders aged 1–2 years is approximately $97,000
• Average cost basis for holders aged 6–12 months is approximately $89,000
Both groups are currently in an unrealized loss position.
During the 2025 uptrend phase, investors who bought near the highs are seeing their daily outflow amounts at a yearly high; in the subsequent downtrend phase, investors who bought later face less selling pressure. The cost basis is influencing the selling behavior of different groups.
#BTC #Bitcoin #Glassnode
10

·
--
📊 Glassnode data shows: BTC investors who bought at higher levels are selling.
▪️ Buyers who bought 1-2 years ago had a cost basis of about $97,000, in unrealized losses
▪️ Buyers who bought 6-12 months ago had a cost basis of about $89,000, in unrealized losses
▪️ During the 2025 uptrend, the highest daily selling volume was recorded among these buyers
▪️ During the pullback period, buyers did not show a similar sell-off
Are high-level holdings starting to loosen?
#BTC #Bitcoin #Glassnode
📊 Glassnode data shows: BTC investors who bought at higher levels are selling.
▪️ Buyers who bought 1-2 years ago had a cost basis of about $97,000, in unrealized losses
▪️ Buyers who bought 6-12 months ago had a cost basis of about $89,000, in unrealized losses
▪️ During the 2025 uptrend, the highest daily selling volume was recorded among these buyers
▪️ During the pullback period, buyers did not show a similar sell-off
Are high-level holdings starting to loosen?
#BTC #Bitcoin #Glassnode
▪️ Buyers who bought 1-2 years ago had a cost basis of about $97,000, in unrealized losses
▪️ Buyers who bought 6-12 months ago had a cost basis of about $89,000, in unrealized losses
▪️ During the 2025 uptrend, the highest daily selling volume was recorded among these buyers
▪️ During the pullback period, buyers did not show a similar sell-off
Are high-level holdings starting to loosen?
#BTC #Bitcoin #Glassnode
49

·
--
Removed trailing ads/source, optimized for Twitter format:
🚨 Glassnode: BTC short-term holders showing selling pressure
Loss group:
• Average entry price 1-2 years ago: $97,000
• Average entry price 6-12 months ago: $89,000
Those who entered during the 2025 uptrend period are currently showing the highest daily sell-off volume; dip-buyers during the downtrend have a strong willingness to hold, and no large-scale selling has been observed.
#Bitcoin #BTC #Glassnode #Onchain
Removed trailing ads/source, optimized for Twitter format:
🚨 Glassnode: BTC short-term holders showing selling pressure
Loss group:
• Average entry price 1-2 years ago: $97,000
• Average entry price 6-12 months ago: $89,000
Those who entered during the 2025 uptrend period are currently showing the highest daily sell-off volume; dip-buyers during the downtrend have a strong willingness to hold, and no large-scale selling has been observed.
#Bitcoin #BTC #Glassnode #Onchain
🚨 Glassnode: BTC short-term holders showing selling pressure
Loss group:
• Average entry price 1-2 years ago: $97,000
• Average entry price 6-12 months ago: $89,000
Those who entered during the 2025 uptrend period are currently showing the highest daily sell-off volume; dip-buyers during the downtrend have a strong willingness to hold, and no large-scale selling has been observed.
#Bitcoin #BTC #Glassnode #Onchain
110
·
--
Glassnode data shows that Bitcoin short-term holders’ selling pressure has increased, and some high-level buyers are already in a loss:
- Buyers who purchased at $97,000 1-2 years ago are at a loss
- Buyers who purchased at $89,000 6-12 months ago are at a loss
Investors who entered during the 2025 uptrend are selling the most per day; investors who bought the dip during the downtrend have not exited in large numbers.
#Bitcoin #BTC #Glassnode
Glassnode data shows that Bitcoin short-term holders’ selling pressure has increased, and some high-level buyers are already in a loss:
- Buyers who purchased at $97,000 1-2 years ago are at a loss
- Buyers who purchased at $89,000 6-12 months ago are at a loss
Investors who entered during the 2025 uptrend are selling the most per day; investors who bought the dip during the downtrend have not exited in large numbers.
#Bitcoin #BTC #Glassnode
- Buyers who purchased at $97,000 1-2 years ago are at a loss
- Buyers who purchased at $89,000 6-12 months ago are at a loss
Investors who entered during the 2025 uptrend are selling the most per day; investors who bought the dip during the downtrend have not exited in large numbers.
#Bitcoin #BTC #Glassnode
14
·
--
📰 Glassnode monitoring shows that investors who previously bought Bitcoin at high prices have started to sell.
Currently, two groups of buyers are in losses: one group bought at $97,000 one to two years ago; the other bought at $89,000 six to twelve months ago. Honestly, once people who bought at the top begin to sell, the pressure will naturally start to show up gradually.
🔥 Even more interesting: investors who entered during the 2025 rally are now selling the most Bitcoin each day. I didn’t expect that the ones who are genuinely in a rush to exit would be the group that chased the rally and bought back then.
💡 On the other hand, during the market downturn, investors who bought the dip have held up better and there hasn’t been large-scale selling. Different entry points make a huge difference in how people respond to volatility.
🤔 If you bought at a high price and you’re currently at a loss, would you choose to sell part of your position first, or keep holding?
#BTC #Glassnode #链上数据 #Bitcoin
📰 Glassnode monitoring shows that investors who previously bought Bitcoin at high prices have started to sell.
Currently, two groups of buyers are in losses: one group bought at $97,000 one to two years ago; the other bought at $89,000 six to twelve months ago. Honestly, once people who bought at the top begin to sell, the pressure will naturally start to show up gradually.
🔥 Even more interesting: investors who entered during the 2025 rally are now selling the most Bitcoin each day. I didn’t expect that the ones who are genuinely in a rush to exit would be the group that chased the rally and bought back then.
💡 On the other hand, during the market downturn, investors who bought the dip have held up better and there hasn’t been large-scale selling. Different entry points make a huge difference in how people respond to volatility.
🤔 If you bought at a high price and you’re currently at a loss, would you choose to sell part of your position first, or keep holding?
#BTC #Glassnode #链上数据 #Bitcoin
Currently, two groups of buyers are in losses: one group bought at $97,000 one to two years ago; the other bought at $89,000 six to twelve months ago. Honestly, once people who bought at the top begin to sell, the pressure will naturally start to show up gradually.
🔥 Even more interesting: investors who entered during the 2025 rally are now selling the most Bitcoin each day. I didn’t expect that the ones who are genuinely in a rush to exit would be the group that chased the rally and bought back then.
💡 On the other hand, during the market downturn, investors who bought the dip have held up better and there hasn’t been large-scale selling. Different entry points make a huge difference in how people respond to volatility.
🤔 If you bought at a high price and you’re currently at a loss, would you choose to sell part of your position first, or keep holding?
#BTC #Glassnode #链上数据 #Bitcoin

19
·
--
📰 Glassnode mentioned that the sell wall of 85,000 USDT above Bitcoin has already been digested by buyers.
This level was repeatedly tested for nearly a week, but it never managed to truly break through. After buyers ate through this layer of pressure yesterday, the sell orders previously resting above also seem to have been gradually withdrawn, and the chart suddenly has far less resistance.
🔥 To be honest, the disappearance of the sell wall doesn’t necessarily mean an immediate rally is guaranteed, but at least it indicates that there are fewer people willing to keep selling at the top. Previously, every time the price approached 85,000 USDT, it had to face sell pressure. Now that wall is gone, and the upward pace could indeed pick up.
💡 Glassnode’s view is also quite straightforward: with reduced sell-side liquidity above, pushing the price upward may become smoother. Who would have thought that a level that kept stalling for a week would ultimately be hard-consumed by buyers.
🤔 Do you think this is a release of pressure before a breakout, or will new resistance reappear after the sell orders are withdrawn?
#BTC #Glassnode #链上数据 #Bitcoin
📰 Glassnode mentioned that the sell wall of 85,000 USDT above Bitcoin has already been digested by buyers.
This level was repeatedly tested for nearly a week, but it never managed to truly break through. After buyers ate through this layer of pressure yesterday, the sell orders previously resting above also seem to have been gradually withdrawn, and the chart suddenly has far less resistance.
🔥 To be honest, the disappearance of the sell wall doesn’t necessarily mean an immediate rally is guaranteed, but at least it indicates that there are fewer people willing to keep selling at the top. Previously, every time the price approached 85,000 USDT, it had to face sell pressure. Now that wall is gone, and the upward pace could indeed pick up.
💡 Glassnode’s view is also quite straightforward: with reduced sell-side liquidity above, pushing the price upward may become smoother. Who would have thought that a level that kept stalling for a week would ultimately be hard-consumed by buyers.
🤔 Do you think this is a release of pressure before a breakout, or will new resistance reappear after the sell orders are withdrawn?
#BTC #Glassnode #链上数据 #Bitcoin
This level was repeatedly tested for nearly a week, but it never managed to truly break through. After buyers ate through this layer of pressure yesterday, the sell orders previously resting above also seem to have been gradually withdrawn, and the chart suddenly has far less resistance.
🔥 To be honest, the disappearance of the sell wall doesn’t necessarily mean an immediate rally is guaranteed, but at least it indicates that there are fewer people willing to keep selling at the top. Previously, every time the price approached 85,000 USDT, it had to face sell pressure. Now that wall is gone, and the upward pace could indeed pick up.
💡 Glassnode’s view is also quite straightforward: with reduced sell-side liquidity above, pushing the price upward may become smoother. Who would have thought that a level that kept stalling for a week would ultimately be hard-consumed by buyers.
🤔 Do you think this is a release of pressure before a breakout, or will new resistance reappear after the sell orders are withdrawn?
#BTC #Glassnode #链上数据 #Bitcoin

74

·
--
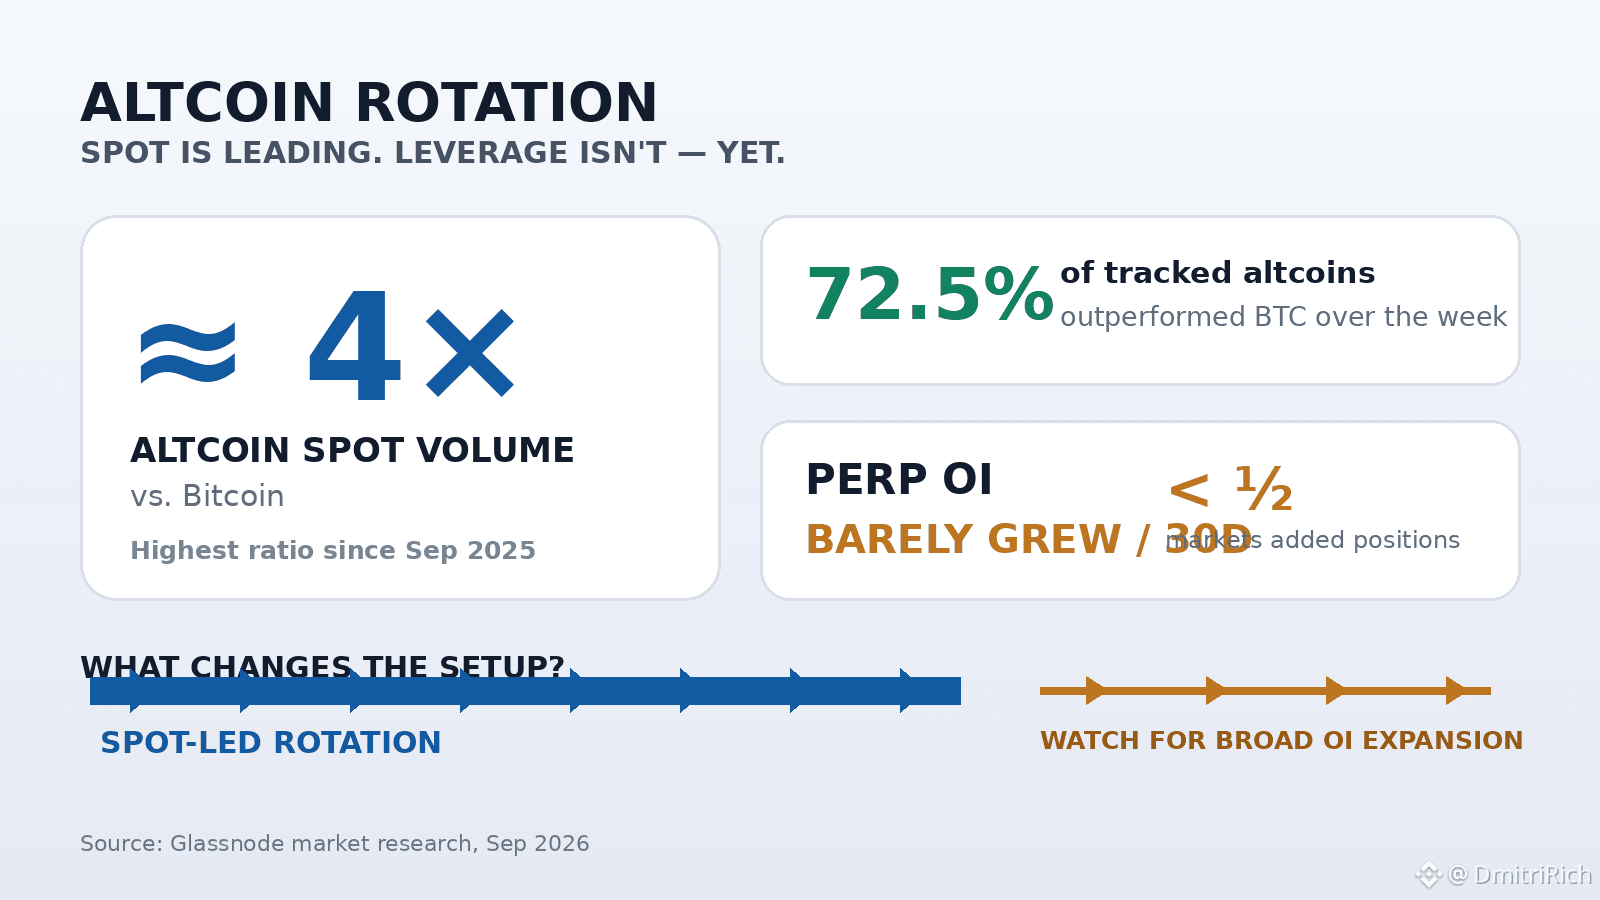
Altcoin spot volume is now running close to 4x Bitcoin’s, the highest ratio since September 2025.
That sounds like “altseason.” The leverage data says something more useful.
#Glassnode found that 72.5% of tracked altcoins outperformed $BTC over the prior week, while altcoin perpetual open interest barely grew over 30 days and fewer than half of markets added positions.
So this rotation is still being driven mostly by spot activity, not a broad leverage build. That lowers the risk of a sudden liquidation cascade compared with the overheated setups seen in 2021 and 2024.
But 4x volume does not mean 4x new money. Volume measures trading activity, not net buying. Glassnode also notes that this kind of high-risk demand has often appeared near local $BTC tops.
The signal I’d watch next is simple: broad altcoin OI expansion.
Spot rotation is healthy. A leverage chase would change the setup fast.
{future}(BTCUSDT)
Altcoin spot volume is now running close to 4x Bitcoin’s, the highest ratio since September 2025.
That sounds like “altseason.” The leverage data says something more useful.
#Glassnode found that 72.5% of tracked altcoins outperformed $BTC over the prior week, while altcoin perpetual open interest barely grew over 30 days and fewer than half of markets added positions.
So this rotation is still being driven mostly by spot activity, not a broad leverage build. That lowers the risk of a sudden liquidation cascade compared with the overheated setups seen in 2021 and 2024.
But 4x volume does not mean 4x new money. Volume measures trading activity, not net buying. Glassnode also notes that this kind of high-risk demand has often appeared near local $BTC tops.
The signal I’d watch next is simple: broad altcoin OI expansion.
Spot rotation is healthy. A leverage chase would change the setup fast.
That sounds like “altseason.” The leverage data says something more useful.
#Glassnode found that 72.5% of tracked altcoins outperformed $BTC over the prior week, while altcoin perpetual open interest barely grew over 30 days and fewer than half of markets added positions.
So this rotation is still being driven mostly by spot activity, not a broad leverage build. That lowers the risk of a sudden liquidation cascade compared with the overheated setups seen in 2021 and 2024.
But 4x volume does not mean 4x new money. Volume measures trading activity, not net buying. Glassnode also notes that this kind of high-risk demand has often appeared near local $BTC tops.
The signal I’d watch next is simple: broad altcoin OI expansion.
Spot rotation is healthy. A leverage chase would change the setup fast.
78

Glassnode just dropped their new report and the data is screaming at us. Spot ETF netflow just exploded +367% to 261.5M. This is the classic battle between Wall Street smart money and over-leveraged degens. Historically, ETF inflows always win. I'm longing BTC on the dip here. Target is 92k, invalidated below $82k. Wall Street is buying right now while degens panic. If you wait for the green candle, you'll be buying their bags at $92k. Execute the long before the next ETF print drops.
#Glassnode
$BTC $ETH
{spot}(ETHUSDT)
{spot}(BTCUSDT)
Glassnode just dropped their new report and the data is screaming at us. Spot ETF netflow just exploded +367% to 261.5M. This is the classic battle between Wall Street smart money and over-leveraged degens. Historically, ETF inflows always win. I'm longing BTC on the dip here. Target is 92k, invalidated below $82k. Wall Street is buying right now while degens panic. If you wait for the green candle, you'll be buying their bags at $92k. Execute the long before the next ETF print drops.
#Glassnode
$BTC $ETH
#Glassnode
$BTC $ETH
1
79
·
--
📰 Glassnode’s assessment directly hits the “four-year cycle” that many people are familiar with: in the later stage of this market cycle, the likelihood of another deep drawdown like those in past cycles is decreasing.
In the past three cycles, Bitcoin’s pullbacks were more than twice as large as this cycle’s, and at the time there were still several weeks left until the cycle low. By contrast, in this cycle, BTC has currently fallen only about 30% from its all-time high, and the price is already rebounding.
🔥 Honestly, this doesn’t quite match the script many people originally expected. In the past, the market often seemed to assume that at a certain stage, it would repeat a major drop according to the four-year cycle. But this pattern has not fully played out in this bear market.
💡 Of course, what Glassnode is saying is that the “chance of a deep selloff is declining,” not that there won’t be any further declines. Since the cycle pattern didn’t follow the old template, it may indicate that the timing and rhythm of this rally are different from the previous three.
👀 The hardest part to judge turns out not to be whether a pullback will happen, but whether this pullback will replicate the same depth as in the past. Do you think the four-year cycle has failed, or is it just temporarily moving to a different pace?
#比特币 #BTC #Glassnode #market cycle
📰 Glassnode’s assessment directly hits the “four-year cycle” that many people are familiar with: in the later stage of this market cycle, the likelihood of another deep drawdown like those in past cycles is decreasing.
In the past three cycles, Bitcoin’s pullbacks were more than twice as large as this cycle’s, and at the time there were still several weeks left until the cycle low. By contrast, in this cycle, BTC has currently fallen only about 30% from its all-time high, and the price is already rebounding.
🔥 Honestly, this doesn’t quite match the script many people originally expected. In the past, the market often seemed to assume that at a certain stage, it would repeat a major drop according to the four-year cycle. But this pattern has not fully played out in this bear market.
💡 Of course, what Glassnode is saying is that the “chance of a deep selloff is declining,” not that there won’t be any further declines. Since the cycle pattern didn’t follow the old template, it may indicate that the timing and rhythm of this rally are different from the previous three.
👀 The hardest part to judge turns out not to be whether a pullback will happen, but whether this pullback will replicate the same depth as in the past. Do you think the four-year cycle has failed, or is it just temporarily moving to a different pace?
#比特币 #BTC #Glassnode #market cycle
In the past three cycles, Bitcoin’s pullbacks were more than twice as large as this cycle’s, and at the time there were still several weeks left until the cycle low. By contrast, in this cycle, BTC has currently fallen only about 30% from its all-time high, and the price is already rebounding.
🔥 Honestly, this doesn’t quite match the script many people originally expected. In the past, the market often seemed to assume that at a certain stage, it would repeat a major drop according to the four-year cycle. But this pattern has not fully played out in this bear market.
💡 Of course, what Glassnode is saying is that the “chance of a deep selloff is declining,” not that there won’t be any further declines. Since the cycle pattern didn’t follow the old template, it may indicate that the timing and rhythm of this rally are different from the previous three.
👀 The hardest part to judge turns out not to be whether a pullback will happen, but whether this pullback will replicate the same depth as in the past. Do you think the four-year cycle has failed, or is it just temporarily moving to a different pace?
#比特币 #BTC #Glassnode #market cycle

128
·
--
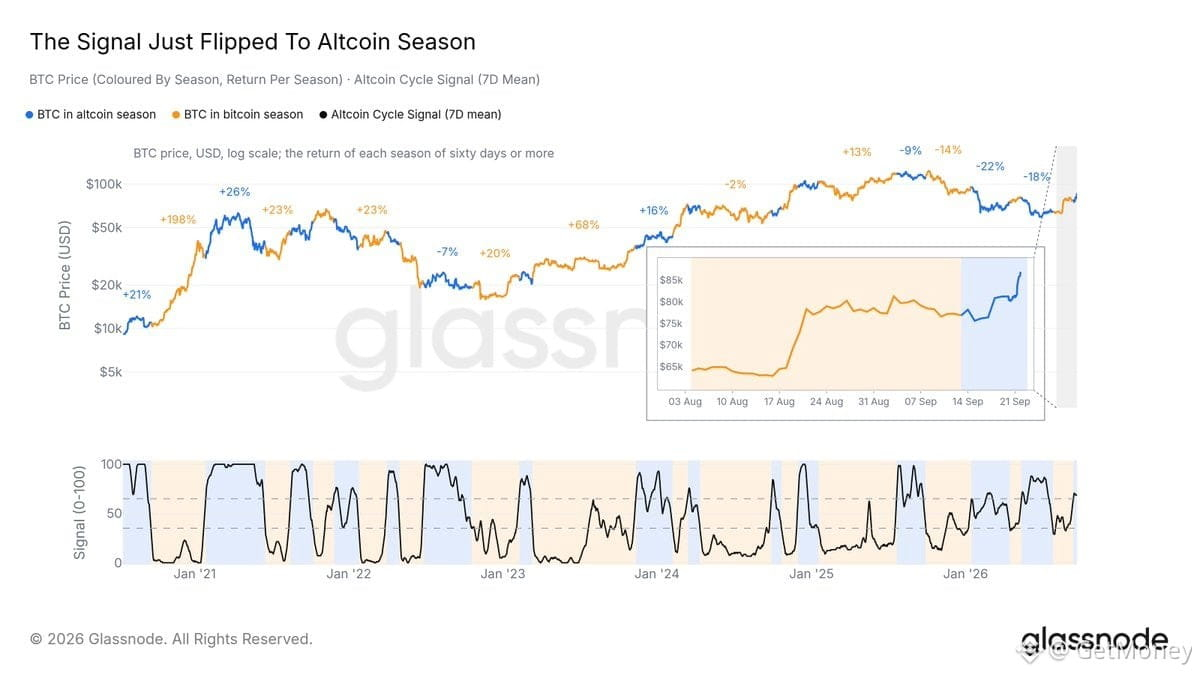
📰 Glassnode’s conclusion is very direct this time: the signal for the altcoin cycle has just shifted from Bitcoin dominance to altcoin season.
During the first round of rallies in August, even though Bitcoin’s price saw fluctuations, the overall performance of altcoins was fairly muted. That round was more like Bitcoin was moving on its own rhythm first, and altcoins didn’t immediately follow.
🔥 But today’s rise is different. Glassnode believes this market move has fully ignited the altcoin market. Honestly, when the market switches from “Bitcoin moves first” to “altcoins take the baton,” discussions in the group usually become lively in an instant.
💡 Of course, this assessment is about a change in the cycle signal—it doesn’t mean all altcoins will perform in sync. Unexpectedly, the relatively quiet altcoin segment earlier has quickly been pushed to the center of the market.
🤔 Do you think this is the real start of altcoin season, or just a temporary rotation within an overall uptrend?
#山寨币 #山寨季 #Glassnode #加密市场
📰 Glassnode’s conclusion is very direct this time: the signal for the altcoin cycle has just shifted from Bitcoin dominance to altcoin season.
During the first round of rallies in August, even though Bitcoin’s price saw fluctuations, the overall performance of altcoins was fairly muted. That round was more like Bitcoin was moving on its own rhythm first, and altcoins didn’t immediately follow.
🔥 But today’s rise is different. Glassnode believes this market move has fully ignited the altcoin market. Honestly, when the market switches from “Bitcoin moves first” to “altcoins take the baton,” discussions in the group usually become lively in an instant.
💡 Of course, this assessment is about a change in the cycle signal—it doesn’t mean all altcoins will perform in sync. Unexpectedly, the relatively quiet altcoin segment earlier has quickly been pushed to the center of the market.
🤔 Do you think this is the real start of altcoin season, or just a temporary rotation within an overall uptrend?
#山寨币 #山寨季 #Glassnode #加密市场
During the first round of rallies in August, even though Bitcoin’s price saw fluctuations, the overall performance of altcoins was fairly muted. That round was more like Bitcoin was moving on its own rhythm first, and altcoins didn’t immediately follow.
🔥 But today’s rise is different. Glassnode believes this market move has fully ignited the altcoin market. Honestly, when the market switches from “Bitcoin moves first” to “altcoins take the baton,” discussions in the group usually become lively in an instant.
💡 Of course, this assessment is about a change in the cycle signal—it doesn’t mean all altcoins will perform in sync. Unexpectedly, the relatively quiet altcoin segment earlier has quickly been pushed to the center of the market.
🤔 Do you think this is the real start of altcoin season, or just a temporary rotation within an overall uptrend?
#山寨币 #山寨季 #Glassnode #加密市场
50
·
--
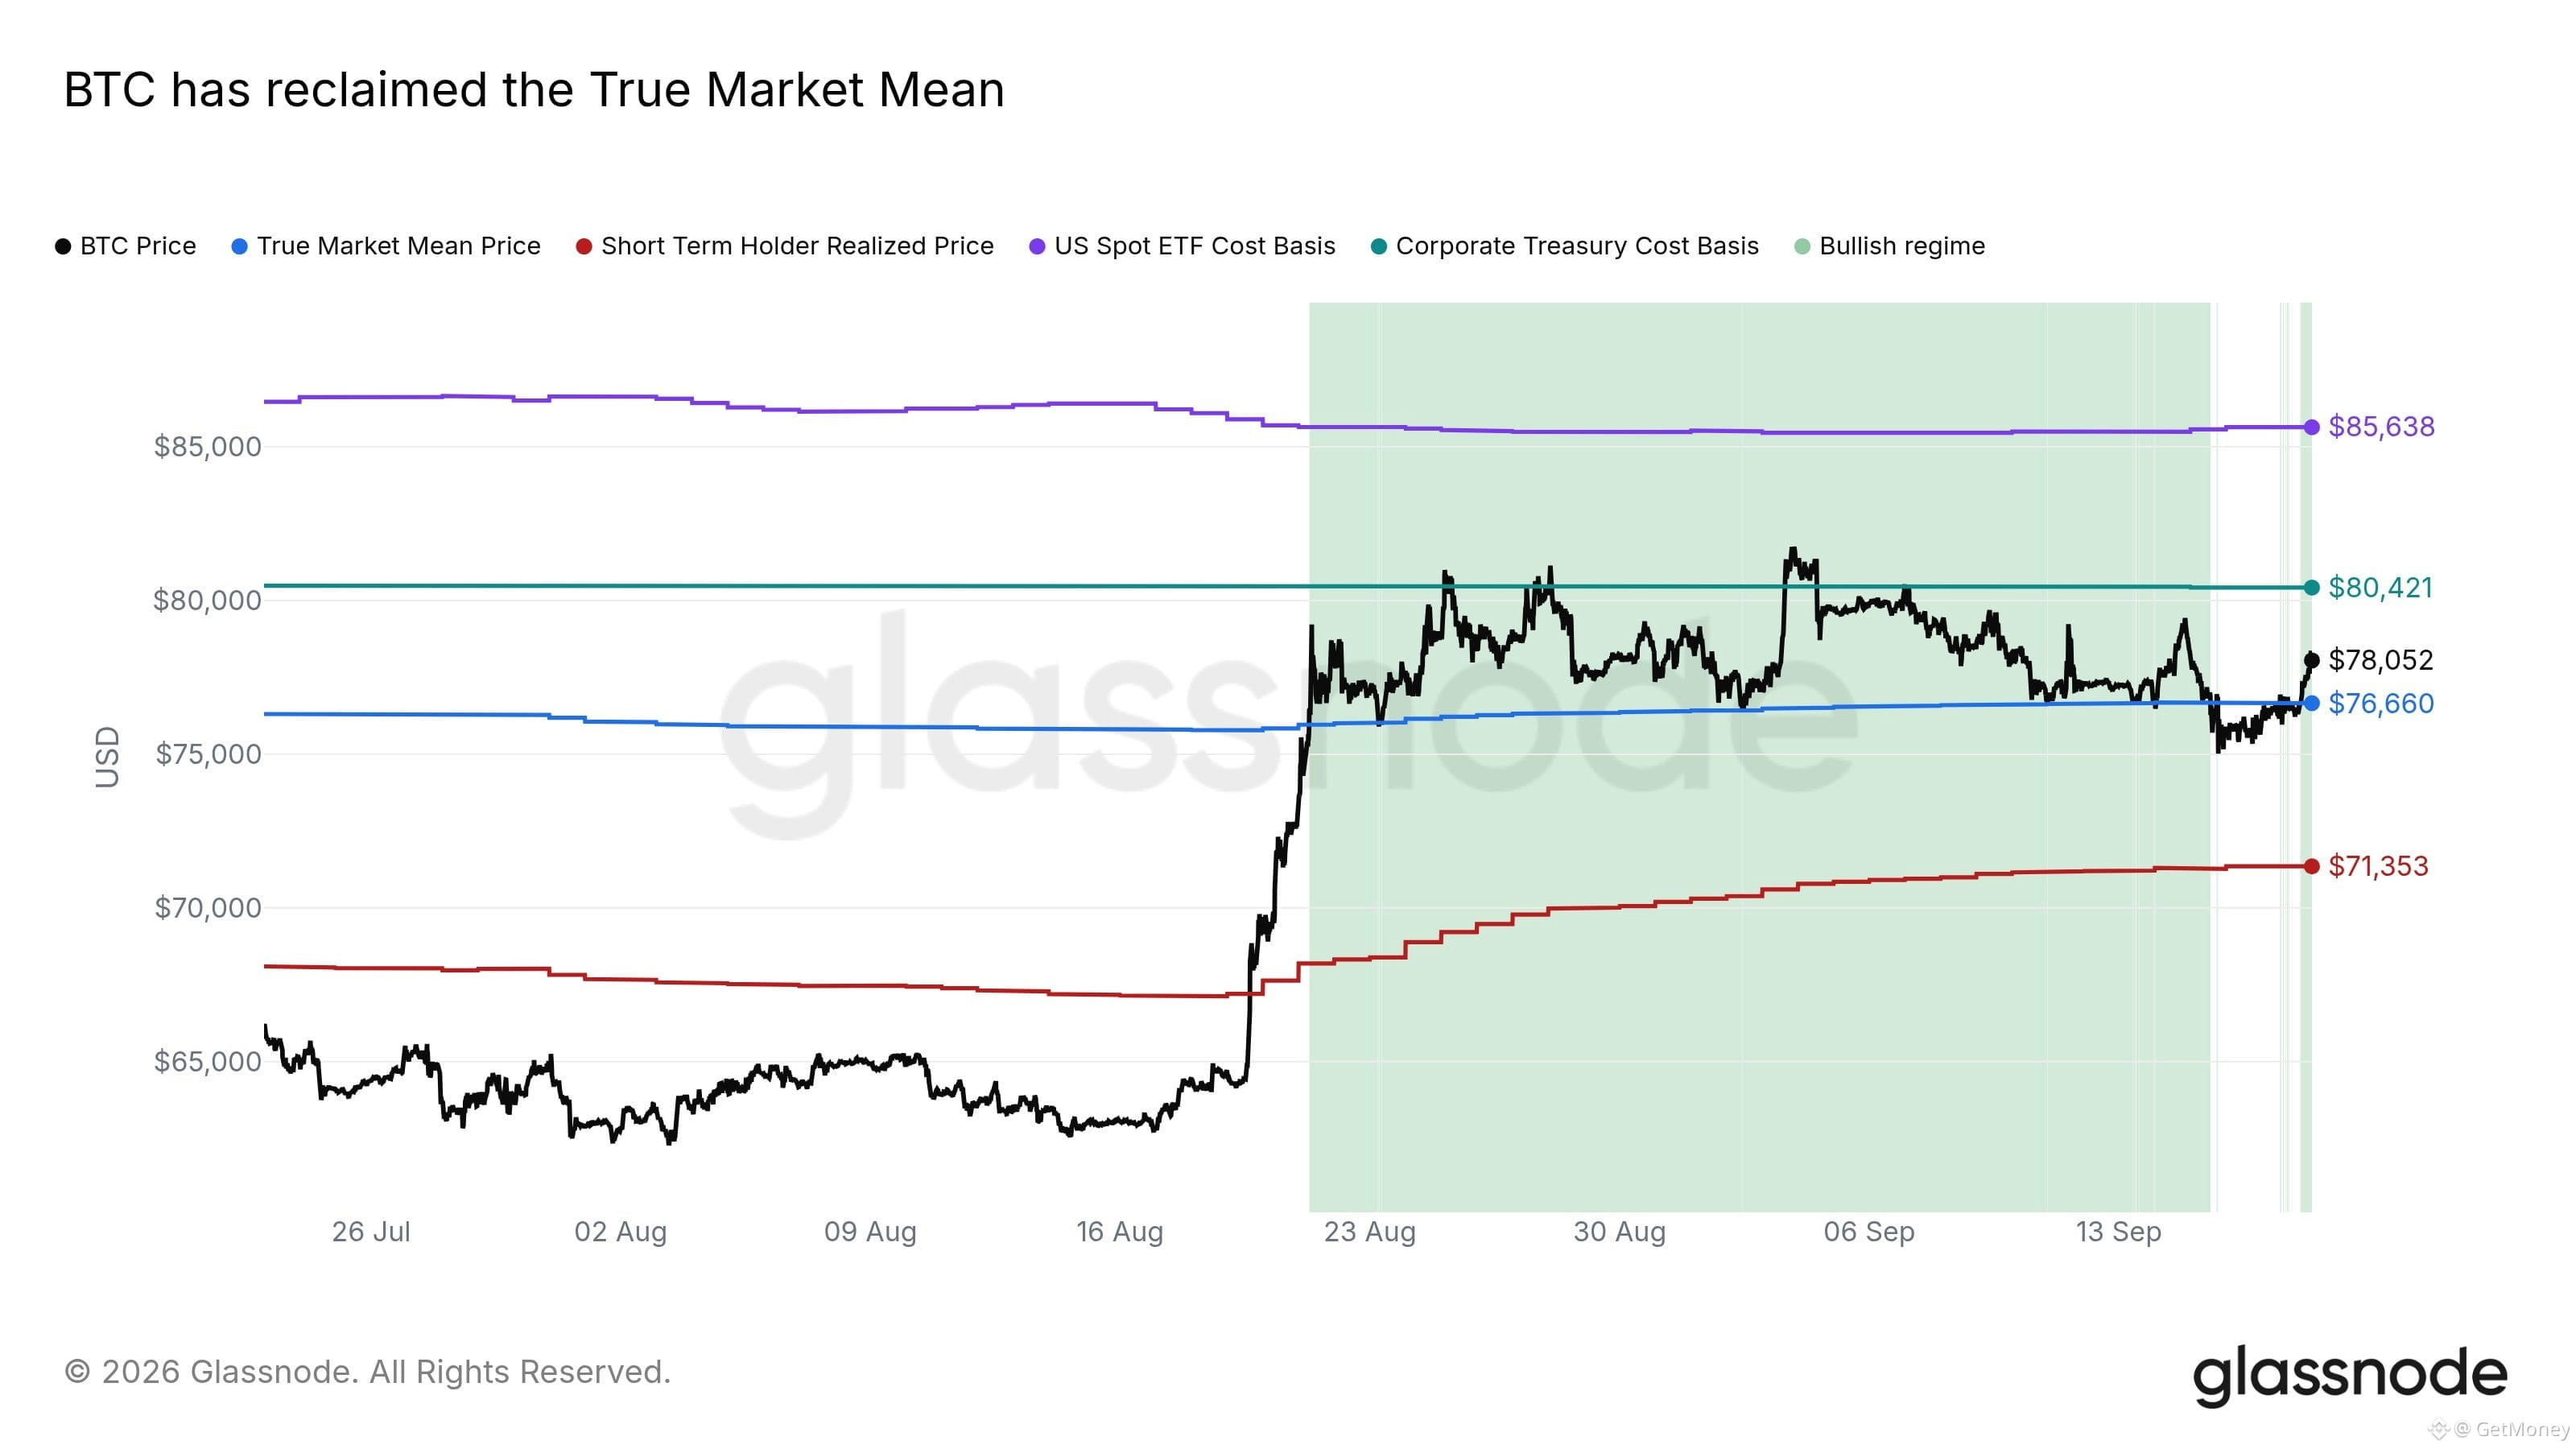
📰 Glassnode provides a bullish signal: BTC has reclaimed the “True Market Mean.” The price has moved back above this key level and has re-entered its defined bullish state.
🔥 Honestly, the point isn’t just to shout “the bull is back.” What matters is that BTC has again crossed a cost reference line used to assess market conditions. The key level that previously weighed on the market has now been reclaimed—at least for the moment.
👀 However, there are two clear levels above. The first is around 80,000 USDT, corresponding to the treasury holding cost basis. Then, further up at about 85,000 USDT, it corresponds to the ETF holding cost basis.
💡 These two lines are both tied to the costs of large capital, so they are more worth discussing than pressure zones drawn on a whim. Reclaiming the true market mean is a good sign—but whether BTC can keep moving higher depends on whether it can gradually digest these two cost zones.
🤔 If BTC next touches 80,000 USDT, will you cut your position first, or wait for it to challenge 85,000 USDT?
#BTC #比特币 #Glassnode #On-chain data
📰 Glassnode provides a bullish signal: BTC has reclaimed the “True Market Mean.” The price has moved back above this key level and has re-entered its defined bullish state.
🔥 Honestly, the point isn’t just to shout “the bull is back.” What matters is that BTC has again crossed a cost reference line used to assess market conditions. The key level that previously weighed on the market has now been reclaimed—at least for the moment.
👀 However, there are two clear levels above. The first is around 80,000 USDT, corresponding to the treasury holding cost basis. Then, further up at about 85,000 USDT, it corresponds to the ETF holding cost basis.
💡 These two lines are both tied to the costs of large capital, so they are more worth discussing than pressure zones drawn on a whim. Reclaiming the true market mean is a good sign—but whether BTC can keep moving higher depends on whether it can gradually digest these two cost zones.
🤔 If BTC next touches 80,000 USDT, will you cut your position first, or wait for it to challenge 85,000 USDT?
#BTC #比特币 #Glassnode #On-chain data
🔥 Honestly, the point isn’t just to shout “the bull is back.” What matters is that BTC has again crossed a cost reference line used to assess market conditions. The key level that previously weighed on the market has now been reclaimed—at least for the moment.
👀 However, there are two clear levels above. The first is around 80,000 USDT, corresponding to the treasury holding cost basis. Then, further up at about 85,000 USDT, it corresponds to the ETF holding cost basis.
💡 These two lines are both tied to the costs of large capital, so they are more worth discussing than pressure zones drawn on a whim. Reclaiming the true market mean is a good sign—but whether BTC can keep moving higher depends on whether it can gradually digest these two cost zones.
🤔 If BTC next touches 80,000 USDT, will you cut your position first, or wait for it to challenge 85,000 USDT?
#BTC #比特币 #Glassnode #On-chain data
119

·
--
💥 CORPORATE BITCOIN BUYING SLOWS AS TREASURIES SIT BELOW $80,500 BREAK-EVEN
Corporate Bitcoin accumulation has slowed sharply, with listed companies adding only about 5,900 BTC over the past three months, according to Glassnode.
That is less than 7% of the 89,000 BTC companies bought in July 2025 alone. Meanwhile, the aggregate Corporate Treasury Cost Basis sits around $80,500 — roughly 6% above spot — leaving the group underwater on paper.
Glassnode notes that Bitcoin has tested the $80,500 level twice since falling below it in January 2026, but failed to hold above it. Until corporate treasuries return to profit and resume meaningful buying, their cost basis could remain an overhead level rather than a source of fresh demand.
Could weaker corporate accumulation become an important factor for BTC’s next move?
#BTC #BitcoinTreasury #Glassnode
#ThuyBNB
$BTC $BNB $NEAR
💥 CORPORATE BITCOIN BUYING SLOWS AS TREASURIES SIT BELOW $80,500 BREAK-EVEN
Corporate Bitcoin accumulation has slowed sharply, with listed companies adding only about 5,900 BTC over the past three months, according to Glassnode.
That is less than 7% of the 89,000 BTC companies bought in July 2025 alone. Meanwhile, the aggregate Corporate Treasury Cost Basis sits around $80,500 — roughly 6% above spot — leaving the group underwater on paper.
Glassnode notes that Bitcoin has tested the $80,500 level twice since falling below it in January 2026, but failed to hold above it. Until corporate treasuries return to profit and resume meaningful buying, their cost basis could remain an overhead level rather than a source of fresh demand.
Could weaker corporate accumulation become an important factor for BTC’s next move?
#BTC #BitcoinTreasury #Glassnode
#ThuyBNB
$BTC $BNB $NEAR
Corporate Bitcoin accumulation has slowed sharply, with listed companies adding only about 5,900 BTC over the past three months, according to Glassnode.
That is less than 7% of the 89,000 BTC companies bought in July 2025 alone. Meanwhile, the aggregate Corporate Treasury Cost Basis sits around $80,500 — roughly 6% above spot — leaving the group underwater on paper.
Glassnode notes that Bitcoin has tested the $80,500 level twice since falling below it in January 2026, but failed to hold above it. Until corporate treasuries return to profit and resume meaningful buying, their cost basis could remain an overhead level rather than a source of fresh demand.
Could weaker corporate accumulation become an important factor for BTC’s next move?
#BTC #BitcoinTreasury #Glassnode
#ThuyBNB
$BTC $BNB $NEAR

156

#Glassnode #CryptoMarket #BTC #ETF Glassnode's latest on-chain data indicating Bitcoin has moved below its True Market Mean at $76,700, exiting a recent trading range.
A second daily close under this level may confirm resistance and increase downside risk towards the short-term holder cost basis near $71,300.
With Bitcoin trading around $76,000-$76,300 in mid-September 2026, the analysis underscores weakening demand signals amid ETF outflows and stalled capital inflows.
#Glassnode #CryptoMarket #BTC #ETF Glassnode's latest on-chain data indicating Bitcoin has moved below its True Market Mean at $76,700, exiting a recent trading range.
A second daily close under this level may confirm resistance and increase downside risk towards the short-term holder cost basis near $71,300.
With Bitcoin trading around $76,000-$76,300 in mid-September 2026, the analysis underscores weakening demand signals amid ETF outflows and stalled capital inflows.
A second daily close under this level may confirm resistance and increase downside risk towards the short-term holder cost basis near $71,300.
With Bitcoin trading around $76,000-$76,300 in mid-September 2026, the analysis underscores weakening demand signals amid ETF outflows and stalled capital inflows.
1
118

·
--
📉 Bitcoin Faces Resistance Near $83K–$85K!
Glassnode data points to long-term holder supply pressure around the $83,000–$85,000 zone, creating a potential resistance area.
But there’s an interesting twist 👀
🟢 Investors are still accumulating BTC around these levels
🔴 Long-term holders are also adding selling pressure
That creates a battle between accumulation and distribution.
📌 Key zone to watch: $83K–$85K
A strong breakout could weaken the resistance, while rejection may keep BTC range-bound.
#Bitcoin #BTC #CryptoMarket #Glassnode
📉 Bitcoin Faces Resistance Near $83K–$85K!
Glassnode data points to long-term holder supply pressure around the $83,000–$85,000 zone, creating a potential resistance area.
But there’s an interesting twist 👀
🟢 Investors are still accumulating BTC around these levels
🔴 Long-term holders are also adding selling pressure
That creates a battle between accumulation and distribution.
📌 Key zone to watch: $83K–$85K
A strong breakout could weaken the resistance, while rejection may keep BTC range-bound.
#Bitcoin #BTC #CryptoMarket #Glassnode
Glassnode data points to long-term holder supply pressure around the $83,000–$85,000 zone, creating a potential resistance area.
But there’s an interesting twist 👀
🟢 Investors are still accumulating BTC around these levels
🔴 Long-term holders are also adding selling pressure
That creates a battle between accumulation and distribution.
📌 Key zone to watch: $83K–$85K
A strong breakout could weaken the resistance, while rejection may keep BTC range-bound.
#Bitcoin #BTC #CryptoMarket #Glassnode

1
68
Log in to explore more content
Join global crypto users on Binance Square
⚡️ Get latest and useful information about crypto.
💬 Trusted by the world’s largest crypto exchange.
👍 Discover real insights from verified creators.
Email / Phone number
Trending Topics
1
#BinanceLaunchesBinanceIntelligence
478,702 views
3,312 Discussing
2
#BitcoinTargets2026OpenAt$87570
3,365 views
89 Discussing
3
#BitcoinRejectedAt$87KThirdTime
3,068 views
73 Discussing
4
#StrategyMarketCapSurpassesRumble
20,102 views
520 Discussing
5
#StriveBuys2000BTCFor$169M
14,995 views
142 Discussing
6
#EvernorthXRPTreasuryCompletesSPACMerger
196,264 views
1,743 Discussing
7
#ADAGains10%Above$0.27
71,480 views
262 Discussing
8
#ETHUp70%InQ3ButLiquidityFalls
396,726 views
2,714 Discussing
9
#EthStakingExitQueueHits2026High
169,253 views
1,770 Discussing
10
#FedOctoberHoldOdds82.3%
189,877 views
1,703 Discussing