
#eia
eia
8,302 views
32 Discussing
Hot
Latest

·
--
The U.S. Energy Information Administration (EIA) just released the latest crude oil data this Thursday. As of the week ending September 4, U.S. domestic crude oil production increased by about 85,000 barrels per day, surging directly to 13.95 million barrels per day. This figure broke the previous high of 13.86 million barrels per day set in the week ending August 28, once again setting a new all-time record.
This sustained strength on the supply side deserves close attention. Previously, the market had been weighing the tug-of-war between slowing global demand and oil-producing countries’ supply, and U.S. crude oil output steadily moving toward the 14 million barrel mark has undoubtedly provided the most direct real-world signal to the commodity market from the supply side, while also reflecting that upstream extraction efficiency and capacity release remain quite strong.
From a macro asset perspective, crude oil supply remaining at high levels has directly suppressed the inflationary upside risk of energy prices. If oil prices remain relatively stable, that is an important variable for the Federal Reserve as it monitors inflation trends and weighs the future path of interest rates. At the same time, U.S. Treasury yields and the dollar index will also undergo periodic rebalancing as energy inflation expectations change.
For the crypto market, stable macro inflation expectations usually mean that the pressure of liquidity tightening will not suddenly intensify. However, funds are still mostly waiting on the sidelines for further confirmation of the macro trend, and $BTC overall sentiment remains neutral. Going forward, the key will be whether this loosening on the supply side can truly translate into longer-term improvements in liquidity.
#原油 #EIA #Macroeconomics
The U.S. Energy Information Administration (EIA) just released the latest crude oil data this Thursday. As of the week ending September 4, U.S. domestic crude oil production increased by about 85,000 barrels per day, surging directly to 13.95 million barrels per day. This figure broke the previous high of 13.86 million barrels per day set in the week ending August 28, once again setting a new all-time record.
This sustained strength on the supply side deserves close attention. Previously, the market had been weighing the tug-of-war between slowing global demand and oil-producing countries’ supply, and U.S. crude oil output steadily moving toward the 14 million barrel mark has undoubtedly provided the most direct real-world signal to the commodity market from the supply side, while also reflecting that upstream extraction efficiency and capacity release remain quite strong.
From a macro asset perspective, crude oil supply remaining at high levels has directly suppressed the inflationary upside risk of energy prices. If oil prices remain relatively stable, that is an important variable for the Federal Reserve as it monitors inflation trends and weighs the future path of interest rates. At the same time, U.S. Treasury yields and the dollar index will also undergo periodic rebalancing as energy inflation expectations change.
For the crypto market, stable macro inflation expectations usually mean that the pressure of liquidity tightening will not suddenly intensify. However, funds are still mostly waiting on the sidelines for further confirmation of the macro trend, and $BTC overall sentiment remains neutral. Going forward, the key will be whether this loosening on the supply side can truly translate into longer-term improvements in liquidity.
#原油 #EIA #Macroeconomics
This sustained strength on the supply side deserves close attention. Previously, the market had been weighing the tug-of-war between slowing global demand and oil-producing countries’ supply, and U.S. crude oil output steadily moving toward the 14 million barrel mark has undoubtedly provided the most direct real-world signal to the commodity market from the supply side, while also reflecting that upstream extraction efficiency and capacity release remain quite strong.
From a macro asset perspective, crude oil supply remaining at high levels has directly suppressed the inflationary upside risk of energy prices. If oil prices remain relatively stable, that is an important variable for the Federal Reserve as it monitors inflation trends and weighs the future path of interest rates. At the same time, U.S. Treasury yields and the dollar index will also undergo periodic rebalancing as energy inflation expectations change.
For the crypto market, stable macro inflation expectations usually mean that the pressure of liquidity tightening will not suddenly intensify. However, funds are still mostly waiting on the sidelines for further confirmation of the macro trend, and $BTC overall sentiment remains neutral. Going forward, the key will be whether this loosening on the supply side can truly translate into longer-term improvements in liquidity.
#原油 #EIA #Macroeconomics
292

·
--
According to the latest report released by the U.S. Energy Information Administration (EIA), U.S. crude oil production in the week ending September 4 increased by 85,000 barrels per day, officially reaching 13.95 million barrels per day. The figure surpassed the previous week’s record of 13.86 million barrels per day (August 28) and brought domestic U.S. oil supply close to the historic threshold of 14 million barrels per day.
The continued record-breaking output of U.S. shale oil carries significant implications for the global inflation outlook. Amid complex geopolitical factors that could push energy costs higher, abundant supply from the U.S. is acting as an important shock absorber, curbing the rise in gasoline and oil prices and easing pressure on core inflation for the economy.
For financial markets, energy prices cooling down or remaining stable will likely provide favorable conditions for the Federal Reserve (Fed) to feel more confident in its path toward monetary policy easing. Treasury bond yields and the U.S. Dollar Index (USD Index) are likely to stay on a steady trend if inflation expectations are not reignited.
A macro environment with well-controlled energy costs is always a positive catalyst for the crypto market. When monetary tightening pressure eases, speculative capital flows tend to seek returns in higher-risk asset channels such as $BTC and various altcoins, reinforcing the medium-term recovery in liquidity. ⛽
#dau_tho #EIA #nang_luong #lam_phat
According to the latest report released by the U.S. Energy Information Administration (EIA), U.S. crude oil production in the week ending September 4 increased by 85,000 barrels per day, officially reaching 13.95 million barrels per day. The figure surpassed the previous week’s record of 13.86 million barrels per day (August 28) and brought domestic U.S. oil supply close to the historic threshold of 14 million barrels per day.
The continued record-breaking output of U.S. shale oil carries significant implications for the global inflation outlook. Amid complex geopolitical factors that could push energy costs higher, abundant supply from the U.S. is acting as an important shock absorber, curbing the rise in gasoline and oil prices and easing pressure on core inflation for the economy.
For financial markets, energy prices cooling down or remaining stable will likely provide favorable conditions for the Federal Reserve (Fed) to feel more confident in its path toward monetary policy easing. Treasury bond yields and the U.S. Dollar Index (USD Index) are likely to stay on a steady trend if inflation expectations are not reignited.
A macro environment with well-controlled energy costs is always a positive catalyst for the crypto market. When monetary tightening pressure eases, speculative capital flows tend to seek returns in higher-risk asset channels such as $BTC and various altcoins, reinforcing the medium-term recovery in liquidity. ⛽
#dau_tho #EIA #nang_luong #lam_phat
The continued record-breaking output of U.S. shale oil carries significant implications for the global inflation outlook. Amid complex geopolitical factors that could push energy costs higher, abundant supply from the U.S. is acting as an important shock absorber, curbing the rise in gasoline and oil prices and easing pressure on core inflation for the economy.
For financial markets, energy prices cooling down or remaining stable will likely provide favorable conditions for the Federal Reserve (Fed) to feel more confident in its path toward monetary policy easing. Treasury bond yields and the U.S. Dollar Index (USD Index) are likely to stay on a steady trend if inflation expectations are not reignited.
A macro environment with well-controlled energy costs is always a positive catalyst for the crypto market. When monetary tightening pressure eases, speculative capital flows tend to seek returns in higher-risk asset channels such as $BTC and various altcoins, reinforcing the medium-term recovery in liquidity. ⛽
#dau_tho #EIA #nang_luong #lam_phat
127
·
--
The latest weekly report released by the U.S. Energy Information Administration (EIA) shows that U.S. domestic crude oil production has officially reached a new record high. Strong growth in output from shale oil fields continues to reinforce Washington’s leading position in global supply in the current period.
Maintaining U.S. oil supply at historical peaks is especially significant amid market concerns about geopolitical risks and OPEC+ production cuts. This abundant supply will directly counter the upward momentum in energy prices, thereby strongly supporting central banks’ efforts to curb inflation.
For financial markets, this information helps rein in the rise in WTI and Brent crude oil prices, while also easing short-term inflation expectations. U.S. government bond yields also have additional room to move lower, which creates favorable conditions for risk-on sentiment in the stock market.
For the crypto market, cooling energy-related pressures are a highly positive macro factor. As the specter of inflation gradually fades, the Fed will have more room to ease monetary policy, thereby expanding the flow of liquidity into risk assets like $BTC in the following periods.
#dau_mo #eia #kinh_te_my
The latest weekly report released by the U.S. Energy Information Administration (EIA) shows that U.S. domestic crude oil production has officially reached a new record high. Strong growth in output from shale oil fields continues to reinforce Washington’s leading position in global supply in the current period.
Maintaining U.S. oil supply at historical peaks is especially significant amid market concerns about geopolitical risks and OPEC+ production cuts. This abundant supply will directly counter the upward momentum in energy prices, thereby strongly supporting central banks’ efforts to curb inflation.
For financial markets, this information helps rein in the rise in WTI and Brent crude oil prices, while also easing short-term inflation expectations. U.S. government bond yields also have additional room to move lower, which creates favorable conditions for risk-on sentiment in the stock market.
For the crypto market, cooling energy-related pressures are a highly positive macro factor. As the specter of inflation gradually fades, the Fed will have more room to ease monetary policy, thereby expanding the flow of liquidity into risk assets like $BTC in the following periods.
#dau_mo #eia #kinh_te_my
Maintaining U.S. oil supply at historical peaks is especially significant amid market concerns about geopolitical risks and OPEC+ production cuts. This abundant supply will directly counter the upward momentum in energy prices, thereby strongly supporting central banks’ efforts to curb inflation.
For financial markets, this information helps rein in the rise in WTI and Brent crude oil prices, while also easing short-term inflation expectations. U.S. government bond yields also have additional room to move lower, which creates favorable conditions for risk-on sentiment in the stock market.
For the crypto market, cooling energy-related pressures are a highly positive macro factor. As the specter of inflation gradually fades, the Fed will have more room to ease monetary policy, thereby expanding the flow of liquidity into risk assets like $BTC in the following periods.
#dau_mo #eia #kinh_te_my
1
168

The U.S. Energy Information Administration (EIA) has clearly stated in its latest Short-Term Energy Outlook that as shipping through the Strait of Hormuz gradually resumes and alternative export routes come online, Middle East crude oil supply will rebound over the coming months. Although Iran’s recent official statements indicate an intention to intensify retaliatory actions against U.S. military strikes, geopolitical tensions still cast a lingering shadow, but the EIA expects that once the imposed restrictions continue through the year, Brent crude prices will hold at an average of $90 per barrel in the second half of 2026, and then decline gradually to $74 per barrel in 2027 as production capacity is released and inventories are replenished.
From a macro fundamentals perspective, this report injects the market with a weighty dose of reassurance. Pulse-like geopolitical shocks often struggle to alter long-term supply-and-demand fundamentals. The growing certainty of a gradual repair in crude oil supply directly suppresses the tail risk of a renewed surge in energy-related inflation, giving the Federal Reserve and other major central banks more room to implement easing and rate cuts in subsequent monetary policy.
On the technical side, crude oil forward prices have returned to a downward channel, which should effectively curb the upside momentum in U.S. Treasury yields and the U.S. dollar index. The fall in commodity risk premia implies a substantive easing of the liquidity tightening cycle. Measures of cross-asset volatility—such as the VIX—are likely to continue bottoming out, while global risk-on sentiment is entering a very healthy window for recovery.
For the crypto market, $BTC and mainstream assets are both in a critical phase of technical structure breakout. Falling energy costs will cool inflation, providing ample liquidity backing for risk assets. As long as key support levels hold, the clearing of external macro pressures will directly boost the inflow of incremental capital, and the next stage of the rally will very likely continue upward in line with the logic of easing liquidity.🚀
#EIA #原油 #liquidity
The U.S. Energy Information Administration (EIA) has clearly stated in its latest Short-Term Energy Outlook that as shipping through the Strait of Hormuz gradually resumes and alternative export routes come online, Middle East crude oil supply will rebound over the coming months. Although Iran’s recent official statements indicate an intention to intensify retaliatory actions against U.S. military strikes, geopolitical tensions still cast a lingering shadow, but the EIA expects that once the imposed restrictions continue through the year, Brent crude prices will hold at an average of $90 per barrel in the second half of 2026, and then decline gradually to $74 per barrel in 2027 as production capacity is released and inventories are replenished.
From a macro fundamentals perspective, this report injects the market with a weighty dose of reassurance. Pulse-like geopolitical shocks often struggle to alter long-term supply-and-demand fundamentals. The growing certainty of a gradual repair in crude oil supply directly suppresses the tail risk of a renewed surge in energy-related inflation, giving the Federal Reserve and other major central banks more room to implement easing and rate cuts in subsequent monetary policy.
On the technical side, crude oil forward prices have returned to a downward channel, which should effectively curb the upside momentum in U.S. Treasury yields and the U.S. dollar index. The fall in commodity risk premia implies a substantive easing of the liquidity tightening cycle. Measures of cross-asset volatility—such as the VIX—are likely to continue bottoming out, while global risk-on sentiment is entering a very healthy window for recovery.
For the crypto market, $BTC and mainstream assets are both in a critical phase of technical structure breakout. Falling energy costs will cool inflation, providing ample liquidity backing for risk assets. As long as key support levels hold, the clearing of external macro pressures will directly boost the inflow of incremental capital, and the next stage of the rally will very likely continue upward in line with the logic of easing liquidity.🚀
#EIA #原油 #liquidity
From a macro fundamentals perspective, this report injects the market with a weighty dose of reassurance. Pulse-like geopolitical shocks often struggle to alter long-term supply-and-demand fundamentals. The growing certainty of a gradual repair in crude oil supply directly suppresses the tail risk of a renewed surge in energy-related inflation, giving the Federal Reserve and other major central banks more room to implement easing and rate cuts in subsequent monetary policy.
On the technical side, crude oil forward prices have returned to a downward channel, which should effectively curb the upside momentum in U.S. Treasury yields and the U.S. dollar index. The fall in commodity risk premia implies a substantive easing of the liquidity tightening cycle. Measures of cross-asset volatility—such as the VIX—are likely to continue bottoming out, while global risk-on sentiment is entering a very healthy window for recovery.
For the crypto market, $BTC and mainstream assets are both in a critical phase of technical structure breakout. Falling energy costs will cool inflation, providing ample liquidity backing for risk assets. As long as key support levels hold, the clearing of external macro pressures will directly boost the inflow of incremental capital, and the next stage of the rally will very likely continue upward in line with the logic of easing liquidity.🚀
#EIA #原油 #liquidity
172


·
--
U.S. EIA Natural Gas Inventory Falls Short of ExpectationsU.S. natural gas storage came in lighter than expected, with the EIA reporting 92 Bcf for last week versus 95 Bcf forecast — a miss that suggests tightening supply dynamics as we head into summer demand season.
For crypto markets, especially those tied to energy commodities or proof-of-work narratives, this kind of data matters. Lower inventories can push natural gas prices higher, indirectly affecting mining costs for networks like Bitcoin, where gas-dependent power grids play a role. It also adds volatility to energy-backed tokens or DeFi protocols exposed to commodity price swings.
While not a direct crypto catalyst, the energy backdrop influences broader macro sentiment. Tightening supply often fuels inflationary pressure, which historically has led to risk-off moves in speculative assets — but can also strengthen the case for decentralized alternatives to traditional energy markets. Worth watching how this unfolds alongside summer cooling demand.
$BTC $ETH $NATIX #EIA #EnergyMarkets
U.S. EIA Natural Gas Inventory Falls Short of Expectations
U.S. natural gas storage came in lighter than expected, with the EIA reporting 92 Bcf for last week versus 95 Bcf forecast — a miss that suggests tightening supply dynamics as we head into summer demand season.
For crypto markets, especially those tied to energy commodities or proof-of-work narratives, this kind of data matters. Lower inventories can push natural gas prices higher, indirectly affecting mining costs for networks like Bitcoin, where gas-dependent power grids play a role. It also adds volatility to energy-backed tokens or DeFi protocols exposed to commodity price swings.
While not a direct crypto catalyst, the energy backdrop influences broader macro sentiment. Tightening supply often fuels inflationary pressure, which historically has led to risk-off moves in speculative assets — but can also strengthen the case for decentralized alternatives to traditional energy markets. Worth watching how this unfolds alongside summer cooling demand.
$BTC $ETH $NATIX #EIA #EnergyMarkets
For crypto markets, especially those tied to energy commodities or proof-of-work narratives, this kind of data matters. Lower inventories can push natural gas prices higher, indirectly affecting mining costs for networks like Bitcoin, where gas-dependent power grids play a role. It also adds volatility to energy-backed tokens or DeFi protocols exposed to commodity price swings.
While not a direct crypto catalyst, the energy backdrop influences broader macro sentiment. Tightening supply often fuels inflationary pressure, which historically has led to risk-off moves in speculative assets — but can also strengthen the case for decentralized alternatives to traditional energy markets. Worth watching how this unfolds alongside summer cooling demand.
$BTC $ETH $NATIX #EIA #EnergyMarkets
102

·
--
🛢️ ENERGY: U.S. natural gas reserves beat market expectations 📊🇺🇸
The U.S. Energy Information Administration (EIA) reported that the country’s natural gas reserves increased by 76 billion cubic feet (bcf) during the week that ended on June 19 🏛️.
The official increase topped both market analysts’ forecasts, which expected a build of 74 billion bcf, and the previous week’s figure, which stood at 73 billion bcf 📈.
This surplus of supply puts downward pressure on energy futures contract prices on Wall Street.
🏢 Companies and Related Assets:
Natural Gas Futures (Henry Hub): Key sector benchmark.
Cheniere Energy (NYSE: LNG) / Chevron (NYSE: CVX): Energy giants linked to the sector.
$BTC
{spot}(BTCUSDT)
$CL
{future}(CLUSDT)
$BZ
{future}(BZUSDT)
#BinanceSquare #EIA #Commodities #EstadosUnidos #Macroeconomia
🛢️ ENERGY: U.S. natural gas reserves beat market expectations 📊🇺🇸
The U.S. Energy Information Administration (EIA) reported that the country’s natural gas reserves increased by 76 billion cubic feet (bcf) during the week that ended on June 19 🏛️.
The official increase topped both market analysts’ forecasts, which expected a build of 74 billion bcf, and the previous week’s figure, which stood at 73 billion bcf 📈.
This surplus of supply puts downward pressure on energy futures contract prices on Wall Street.
🏢 Companies and Related Assets:
Natural Gas Futures (Henry Hub): Key sector benchmark.
Cheniere Energy (NYSE: LNG) / Chevron (NYSE: CVX): Energy giants linked to the sector.
$BTC
$CL
$BZ
#BinanceSquare #EIA #Commodities #EstadosUnidos #Macroeconomia
The U.S. Energy Information Administration (EIA) reported that the country’s natural gas reserves increased by 76 billion cubic feet (bcf) during the week that ended on June 19 🏛️.
The official increase topped both market analysts’ forecasts, which expected a build of 74 billion bcf, and the previous week’s figure, which stood at 73 billion bcf 📈.
This surplus of supply puts downward pressure on energy futures contract prices on Wall Street.
🏢 Companies and Related Assets:
Natural Gas Futures (Henry Hub): Key sector benchmark.
Cheniere Energy (NYSE: LNG) / Chevron (NYSE: CVX): Energy giants linked to the sector.
$BTC
$CL
$BZ
#BinanceSquare #EIA #Commodities #EstadosUnidos #Macroeconomia

33
·
--
The U.S. Energy Information Administration (EIA) will release its latest crude oil inventory report tonight, covering the latest changes in commercial crude oil inventories, inventories in the Cushing region, and strategic petroleum reserves (SPR). As one of the most closely watched high-impact indicators by weekly commodity traders, the release of this data often directly breaks short-term consolidation trends.
Why is this set of data worth keeping a close watch? Mainly because global geopolitical developments and the energy supply chain are already in a highly sensitive period. The gap between the actual inventory data and market expectations can not only directly reflect the current U.S. domestic supply-demand fundamentals, but also serves as a mirror of the resilience of end-consumer demand.
In traditional financial markets, if inventory data shows unexpected increases or decreases, international oil prices and the U.S. dollar index typically react violently right away, and then feed through to moves in inflation expectations and U.S. Treasury yields. Small shifts in the commodities market often influence the risk pricing of broader macro assets.
When mapped to the crypto market, although oil prices do not directly determine the trend of $BTC , changes in macro liquidity expectations triggered by oil developments cannot be ignored. Before the data is officially released, short-term funds usually tend to stay on the sidelines, and the market’s long-versus-short contest intensifies. In terms of trading, it may be prudent to remain rational—observe the market’s overall macro sentiment response after the data is published. #原油 #EIA #宏观经济
The U.S. Energy Information Administration (EIA) will release its latest crude oil inventory report tonight, covering the latest changes in commercial crude oil inventories, inventories in the Cushing region, and strategic petroleum reserves (SPR). As one of the most closely watched high-impact indicators by weekly commodity traders, the release of this data often directly breaks short-term consolidation trends.
Why is this set of data worth keeping a close watch? Mainly because global geopolitical developments and the energy supply chain are already in a highly sensitive period. The gap between the actual inventory data and market expectations can not only directly reflect the current U.S. domestic supply-demand fundamentals, but also serves as a mirror of the resilience of end-consumer demand.
In traditional financial markets, if inventory data shows unexpected increases or decreases, international oil prices and the U.S. dollar index typically react violently right away, and then feed through to moves in inflation expectations and U.S. Treasury yields. Small shifts in the commodities market often influence the risk pricing of broader macro assets.
When mapped to the crypto market, although oil prices do not directly determine the trend of $BTC , changes in macro liquidity expectations triggered by oil developments cannot be ignored. Before the data is officially released, short-term funds usually tend to stay on the sidelines, and the market’s long-versus-short contest intensifies. In terms of trading, it may be prudent to remain rational—observe the market’s overall macro sentiment response after the data is published. #原油 #EIA #宏观经济
Why is this set of data worth keeping a close watch? Mainly because global geopolitical developments and the energy supply chain are already in a highly sensitive period. The gap between the actual inventory data and market expectations can not only directly reflect the current U.S. domestic supply-demand fundamentals, but also serves as a mirror of the resilience of end-consumer demand.
In traditional financial markets, if inventory data shows unexpected increases or decreases, international oil prices and the U.S. dollar index typically react violently right away, and then feed through to moves in inflation expectations and U.S. Treasury yields. Small shifts in the commodities market often influence the risk pricing of broader macro assets.
When mapped to the crypto market, although oil prices do not directly determine the trend of $BTC , changes in macro liquidity expectations triggered by oil developments cannot be ignored. Before the data is officially released, short-term funds usually tend to stay on the sidelines, and the market’s long-versus-short contest intensifies. In terms of trading, it may be prudent to remain rational—observe the market’s overall macro sentiment response after the data is published. #原油 #EIA #宏观经济
90

·
--
$USOon shrugs off the inventory build as exports hit a record 🛢️
Crude inventories rose by 1.9M barrels against expectations for a draw, but the market is clearly staring past the headline and into the tighter parts of the tape. Gasoline and distillates both fell, exports printed a record, and that’s the kind of mix that tells you larger hands are still leaning into the supply-squeeze story. The market is breathing with resilience here, not panic.
Not financial advice. Manage your risk and protect your capital.
#Oil #CrudeOil #EnergyMarkets #EIA #Commodities
⚡
{alpha}(560x94174e3d1335db402dd03a092f7aa7ac2cb32be4)
$USOon shrugs off the inventory build as exports hit a record 🛢️
Crude inventories rose by 1.9M barrels against expectations for a draw, but the market is clearly staring past the headline and into the tighter parts of the tape. Gasoline and distillates both fell, exports printed a record, and that’s the kind of mix that tells you larger hands are still leaning into the supply-squeeze story. The market is breathing with resilience here, not panic.
Not financial advice. Manage your risk and protect your capital.
#Oil #CrudeOil #EnergyMarkets #EIA #Commodities
⚡
Crude inventories rose by 1.9M barrels against expectations for a draw, but the market is clearly staring past the headline and into the tighter parts of the tape. Gasoline and distillates both fell, exports printed a record, and that’s the kind of mix that tells you larger hands are still leaning into the supply-squeeze story. The market is breathing with resilience here, not panic.
Not financial advice. Manage your risk and protect your capital.
#Oil #CrudeOil #EnergyMarkets #EIA #Commodities
⚡
33

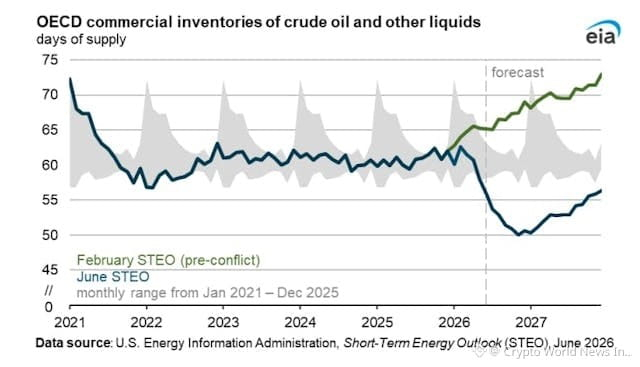
🚨 EIA Warns Oil Market Tightening as Hormuz Disruptions Continue
The U.S. Energy Information Administration (EIA) says global oil markets are heading into a prolonged tightening phase, driven by ongoing disruptions in shipping through the Strait of Hormuz, one of the world’s most critical oil transit routes. Supply constraints are expected to keep inventories low and maintain upward pressure on crude prices.
🔹 Key Facts:
• EIA forecasts continued oil supply tightness due to reduced Middle East exports and shipping disruptions
• Global oil inventories are falling toward multi-decade lows, with OECD stockpiles expected to decline further
• The Strait of Hormuz situation is blocking a large share of global oil flows, keeping supply risk elevated and markets volatile
• Analysts warn prices could remain elevated as long as disruptions continue, even if short-term workarounds exist
💡 Expert Insight:
This is not just a short-term spike story — it’s a structural supply risk phase. When inventories fall and a chokepoint like Hormuz stays unstable, markets tend to price in a long-lasting risk premium across oil, energy stocks, and inflation expectations.
📊 Bottom Line:
Oil is entering a tighter supply regime, and any escalation or prolonged disruption in Hormuz could amplify global energy volatility further.
#Oil #EIA #CrudeOil #EnergyCrisis #OilNews
$CL $BZ
{future}(BZUSDT)
{future}(CLUSDT)
🚨 EIA Warns Oil Market Tightening as Hormuz Disruptions Continue
The U.S. Energy Information Administration (EIA) says global oil markets are heading into a prolonged tightening phase, driven by ongoing disruptions in shipping through the Strait of Hormuz, one of the world’s most critical oil transit routes. Supply constraints are expected to keep inventories low and maintain upward pressure on crude prices.
🔹 Key Facts:
• EIA forecasts continued oil supply tightness due to reduced Middle East exports and shipping disruptions
• Global oil inventories are falling toward multi-decade lows, with OECD stockpiles expected to decline further
• The Strait of Hormuz situation is blocking a large share of global oil flows, keeping supply risk elevated and markets volatile
• Analysts warn prices could remain elevated as long as disruptions continue, even if short-term workarounds exist
💡 Expert Insight:
This is not just a short-term spike story — it’s a structural supply risk phase. When inventories fall and a chokepoint like Hormuz stays unstable, markets tend to price in a long-lasting risk premium across oil, energy stocks, and inflation expectations.
📊 Bottom Line:
Oil is entering a tighter supply regime, and any escalation or prolonged disruption in Hormuz could amplify global energy volatility further.
#Oil #EIA #CrudeOil #EnergyCrisis #OilNews
$CL $BZ
The U.S. Energy Information Administration (EIA) says global oil markets are heading into a prolonged tightening phase, driven by ongoing disruptions in shipping through the Strait of Hormuz, one of the world’s most critical oil transit routes. Supply constraints are expected to keep inventories low and maintain upward pressure on crude prices.
🔹 Key Facts:
• EIA forecasts continued oil supply tightness due to reduced Middle East exports and shipping disruptions
• Global oil inventories are falling toward multi-decade lows, with OECD stockpiles expected to decline further
• The Strait of Hormuz situation is blocking a large share of global oil flows, keeping supply risk elevated and markets volatile
• Analysts warn prices could remain elevated as long as disruptions continue, even if short-term workarounds exist
💡 Expert Insight:
This is not just a short-term spike story — it’s a structural supply risk phase. When inventories fall and a chokepoint like Hormuz stays unstable, markets tend to price in a long-lasting risk premium across oil, energy stocks, and inflation expectations.
📊 Bottom Line:
Oil is entering a tighter supply regime, and any escalation or prolonged disruption in Hormuz could amplify global energy volatility further.
#Oil #EIA #CrudeOil #EnergyCrisis #OilNews
$CL $BZ
109

·
--
Bullish
🛢️ BREAKING: U.S. Crude Oil Inventories Drop Sharply — Bullish Signal for Oil Prices!
📊 EIA Weekly Crude Oil Inventory Report — Just Released
Metric
Value
🔵 Previous
+1.925M barrels
🟡 Estimate
-0.190M barrels
🔴 Actual
-6.234M barrels
📈 Verdict
BULLISH for Oil ✅
🔍 What Does This Mean?
The U.S. Energy Information Administration (EIA) just reported a massive drawdown of -6.234 million barrels in crude oil inventories — far exceeding market expectations of just -0.190M and reversing last week's build of +1.925M.
✅ A decline in crude oil stockpiles = Bullish signal
When supply tightens, demand is outpacing production — pushing oil prices higher. #CrudeOil #OilMarket #EIA #WTI #BrentCrude #EnergyMarket #CommodityTrading
🛢️ BREAKING: U.S. Crude Oil Inventories Drop Sharply — Bullish Signal for Oil Prices!
📊 EIA Weekly Crude Oil Inventory Report — Just Released
Metric
Value
🔵 Previous
+1.925M barrels
🟡 Estimate
-0.190M barrels
🔴 Actual
-6.234M barrels
📈 Verdict
BULLISH for Oil ✅
🔍 What Does This Mean?
The U.S. Energy Information Administration (EIA) just reported a massive drawdown of -6.234 million barrels in crude oil inventories — far exceeding market expectations of just -0.190M and reversing last week's build of +1.925M.
✅ A decline in crude oil stockpiles = Bullish signal
When supply tightens, demand is outpacing production — pushing oil prices higher. #CrudeOil #OilMarket #EIA #WTI #BrentCrude #EnergyMarket #CommodityTrading
📊 EIA Weekly Crude Oil Inventory Report — Just Released
Metric
Value
🔵 Previous
+1.925M barrels
🟡 Estimate
-0.190M barrels
🔴 Actual
-6.234M barrels
📈 Verdict
BULLISH for Oil ✅
🔍 What Does This Mean?
The U.S. Energy Information Administration (EIA) just reported a massive drawdown of -6.234 million barrels in crude oil inventories — far exceeding market expectations of just -0.190M and reversing last week's build of +1.925M.
✅ A decline in crude oil stockpiles = Bullish signal
When supply tightens, demand is outpacing production — pushing oil prices higher. #CrudeOil #OilMarket #EIA #WTI #BrentCrude #EnergyMarket #CommodityTrading
649

·
--
Bullish
The U.S. Energy Information Administration (EIA) released its latest Weekly Petroleum Status Report on January 22, 2026, revealing a significant build in commercial crude oil inventories. For the week ending January 16, 2026, U.S. crude oil stocks increased by 3.602 million barrels, far exceeding market expectations of a modest 1.1 million-barrel rise (and following a 3.391 million-barrel build the prior week). This pushed total inventories to approximately 426 million barrels, still about 2% below the five-year average for this period.
The EIA's Crude Oil Stocks Change indicator tracks weekly fluctuations in commercial crude held by U.S. companies, excluding the Strategic Petroleum Reserve. A build like this signals weaker-than-anticipated demand relative to supply, often pressuring oil prices downward as markets interpret it as oversupply or subdued consumption. Factors contributing to the surprise build may include steady production, imports, and reduced refinery runs amid seasonal patterns or broader economic softness.
Oil prices reflected this bearish sentiment, with WTI crude hovering around $59-60 per barrel and Brent near $64-65 on January 23, 2026, amid ongoing forecasts from the EIA's Short-Term Energy Outlook projecting further declines (Brent averaging $56/b in 2026) due to global production outpacing demand and inventory builds.Key takeaway: This larger-than-expected stock build reinforces a supply-glut narrative in the short term, potentially capping any near-term oil rallies and contributing to volatility in energy-sensitive assets.
For the crypto market, the linkage is indirect but notable. Lower oil prices reduce input costs for mining operations, potentially improving miner profitability and supporting hash rate stability or growth. However, persistent weak demand signals in commodities often correlate with broader risk-off sentiment, weighing on risk assets like cryptocurrencies. Bitcoin and altcoins may face headwinds from reduced investor appetite for high-beta plays.
#oil #BTC #bitcoin #EIA $BTC
{future}(BTCUSDT)
Move with the market!
The U.S. Energy Information Administration (EIA) released its latest Weekly Petroleum Status Report on January 22, 2026, revealing a significant build in commercial crude oil inventories. For the week ending January 16, 2026, U.S. crude oil stocks increased by 3.602 million barrels, far exceeding market expectations of a modest 1.1 million-barrel rise (and following a 3.391 million-barrel build the prior week). This pushed total inventories to approximately 426 million barrels, still about 2% below the five-year average for this period.
The EIA's Crude Oil Stocks Change indicator tracks weekly fluctuations in commercial crude held by U.S. companies, excluding the Strategic Petroleum Reserve. A build like this signals weaker-than-anticipated demand relative to supply, often pressuring oil prices downward as markets interpret it as oversupply or subdued consumption. Factors contributing to the surprise build may include steady production, imports, and reduced refinery runs amid seasonal patterns or broader economic softness.
Oil prices reflected this bearish sentiment, with WTI crude hovering around $59-60 per barrel and Brent near $64-65 on January 23, 2026, amid ongoing forecasts from the EIA's Short-Term Energy Outlook projecting further declines (Brent averaging $56/b in 2026) due to global production outpacing demand and inventory builds.Key takeaway: This larger-than-expected stock build reinforces a supply-glut narrative in the short term, potentially capping any near-term oil rallies and contributing to volatility in energy-sensitive assets.
For the crypto market, the linkage is indirect but notable. Lower oil prices reduce input costs for mining operations, potentially improving miner profitability and supporting hash rate stability or growth. However, persistent weak demand signals in commodities often correlate with broader risk-off sentiment, weighing on risk assets like cryptocurrencies. Bitcoin and altcoins may face headwinds from reduced investor appetite for high-beta plays.
#oil #BTC #bitcoin #EIA $BTC
Move with the market!
The EIA's Crude Oil Stocks Change indicator tracks weekly fluctuations in commercial crude held by U.S. companies, excluding the Strategic Petroleum Reserve. A build like this signals weaker-than-anticipated demand relative to supply, often pressuring oil prices downward as markets interpret it as oversupply or subdued consumption. Factors contributing to the surprise build may include steady production, imports, and reduced refinery runs amid seasonal patterns or broader economic softness.
Oil prices reflected this bearish sentiment, with WTI crude hovering around $59-60 per barrel and Brent near $64-65 on January 23, 2026, amid ongoing forecasts from the EIA's Short-Term Energy Outlook projecting further declines (Brent averaging $56/b in 2026) due to global production outpacing demand and inventory builds.Key takeaway: This larger-than-expected stock build reinforces a supply-glut narrative in the short term, potentially capping any near-term oil rallies and contributing to volatility in energy-sensitive assets.
For the crypto market, the linkage is indirect but notable. Lower oil prices reduce input costs for mining operations, potentially improving miner profitability and supporting hash rate stability or growth. However, persistent weak demand signals in commodities often correlate with broader risk-off sentiment, weighing on risk assets like cryptocurrencies. Bitcoin and altcoins may face headwinds from reduced investor appetite for high-beta plays.
#oil #BTC #bitcoin #EIA $BTC
Move with the market!
1
238

·
--
🇨🇳 China is sitting on an energy “war chest” the world can’t ignore
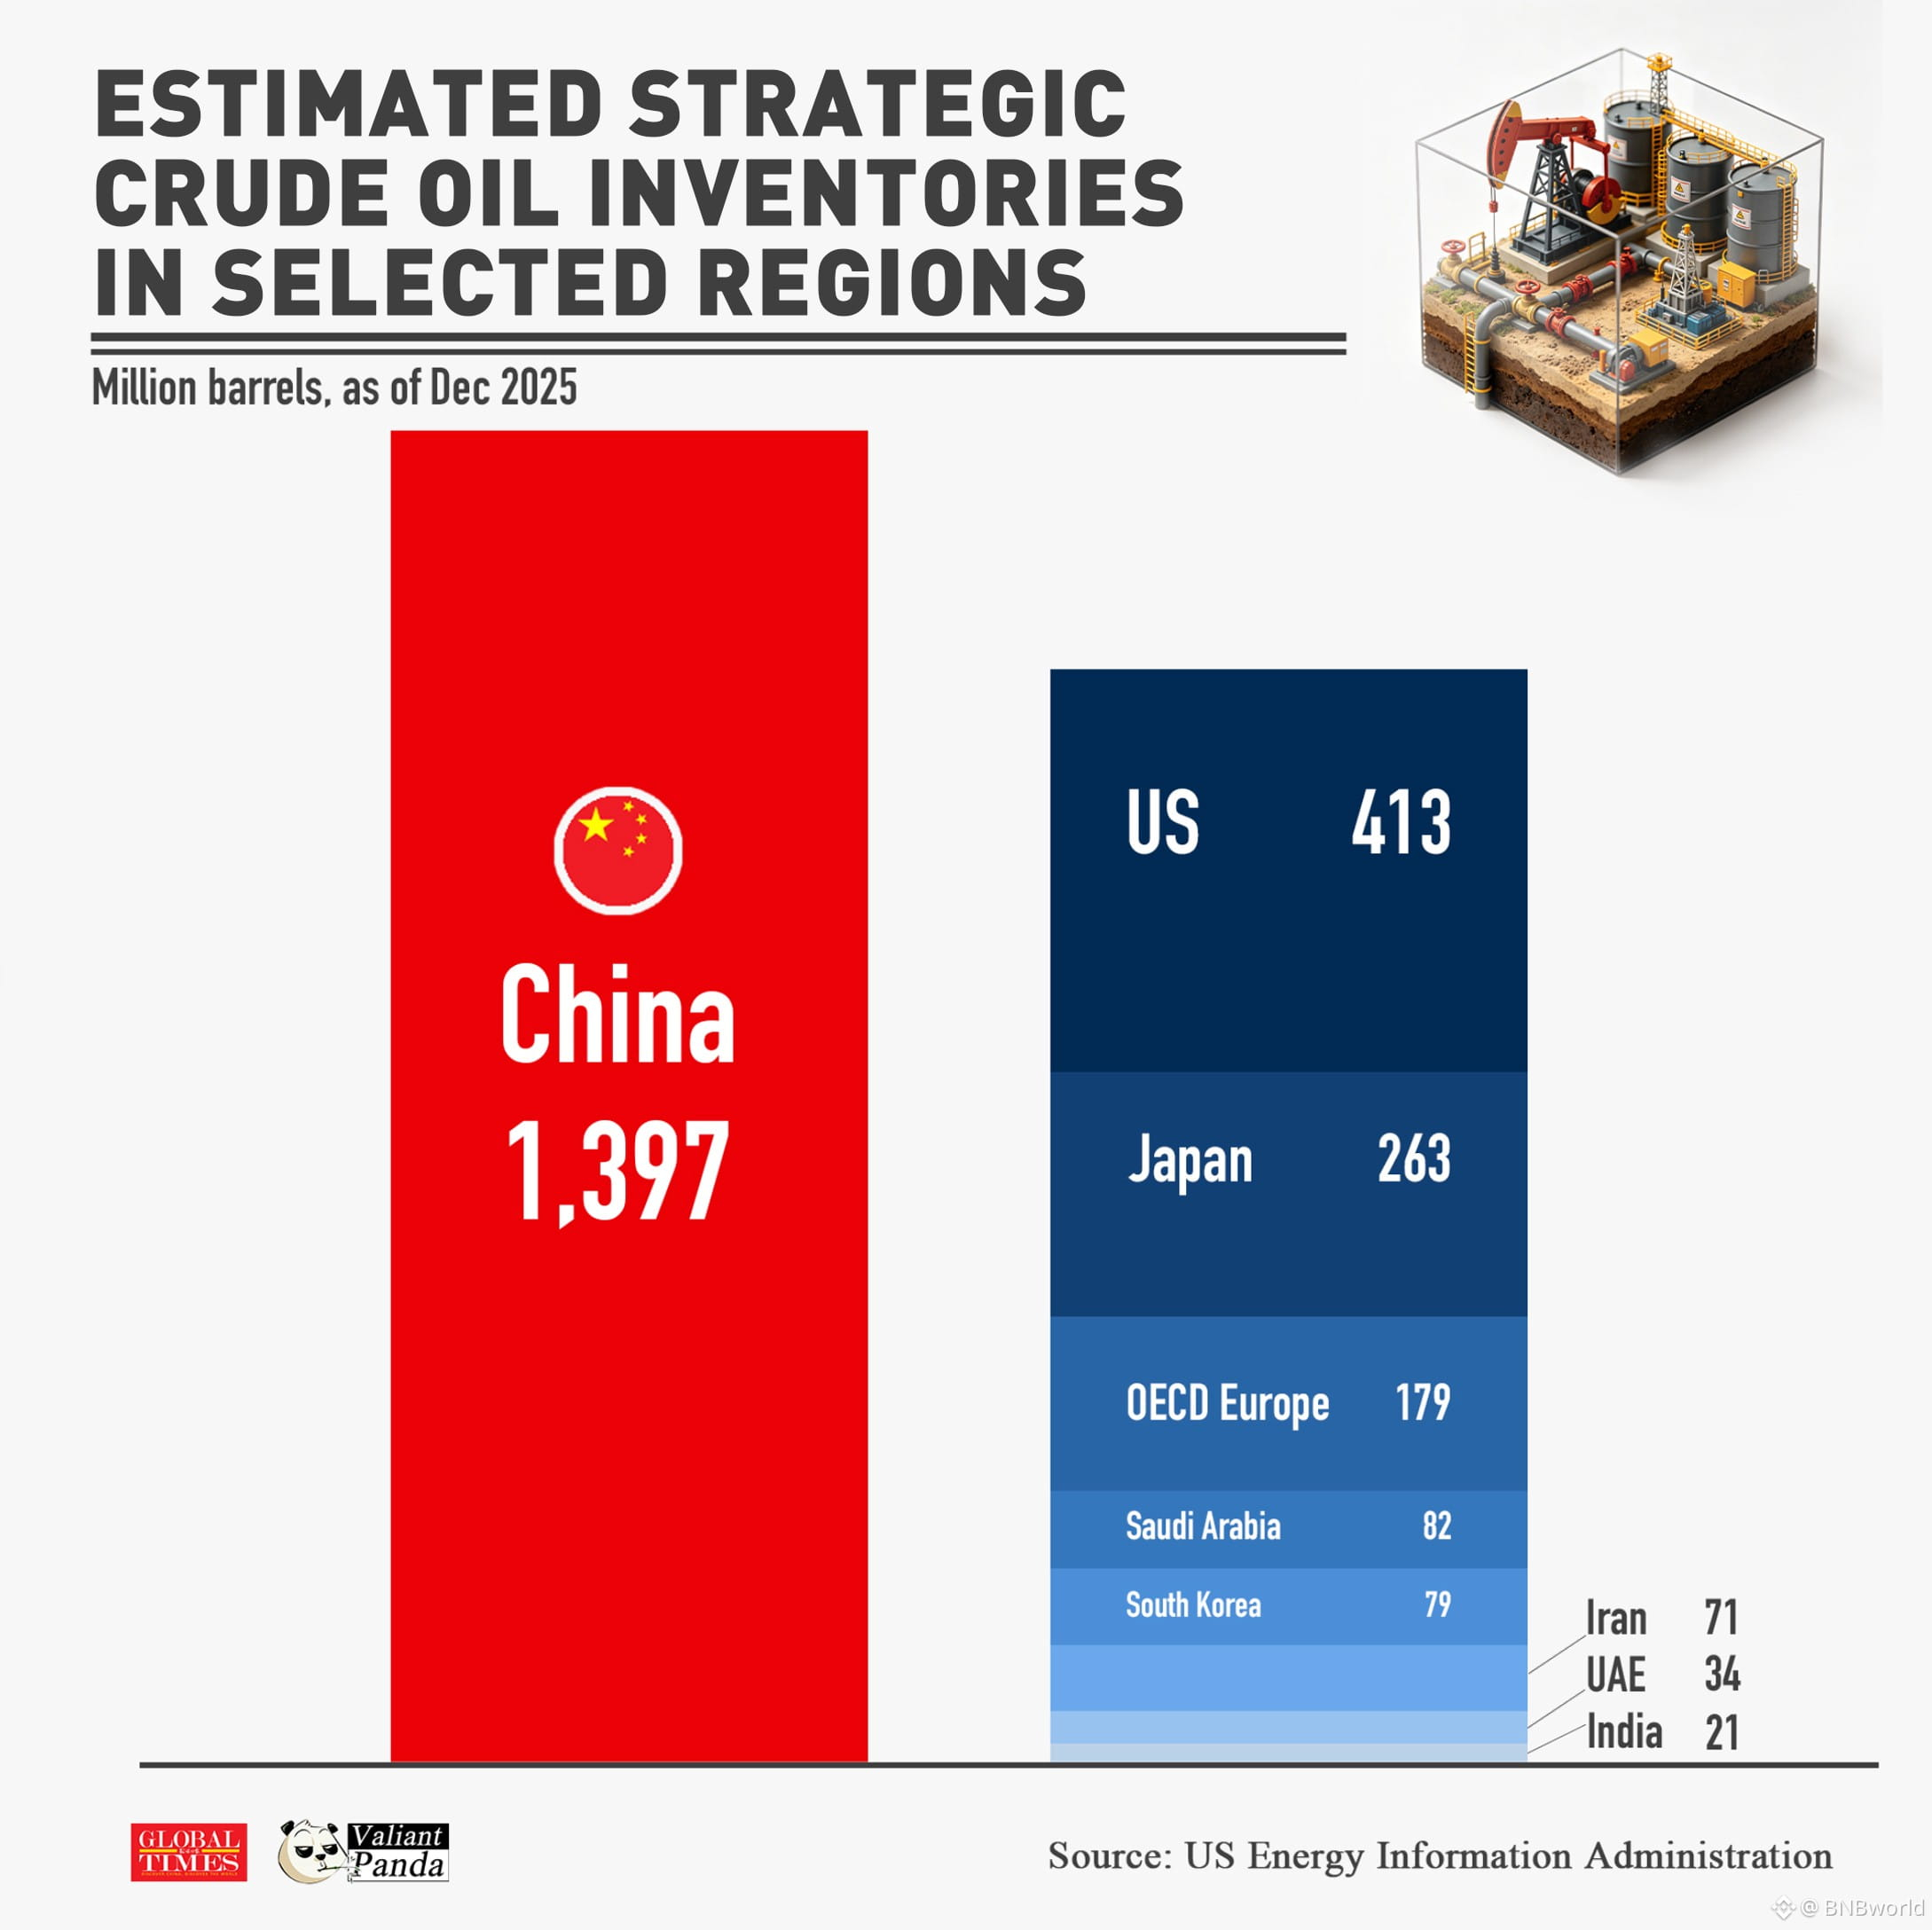
As of Dec 2025, China holds the largest strategic crude oil inventories on the planet, reaching around 1,397 million barrels (EIA data).
That’s not just big — it’s massive.
📦 More than the combined reserves of the US 🇺🇸 and Japan 🇯🇵
While global markets panic over supply shocks, geopolitics, and oil spikes… China has been quietly building a buffer that can influence price stability, trade leverage, and energy security for years ahead.
💡 In a world where oil = power, inventories = strategy.
This isn’t just storage. It’s positioning.
And it raises one big question for traders and analysts:
👉 Who really controls the next oil cycle — producers or stockpilers?
#China #OilMarkets #CrudeOil #EIA #BinanceSquare
$CL
{future}(CLUSDT)
🇨🇳 China is sitting on an energy “war chest” the world can’t ignore
As of Dec 2025, China holds the largest strategic crude oil inventories on the planet, reaching around 1,397 million barrels (EIA data).
That’s not just big — it’s massive.
📦 More than the combined reserves of the US 🇺🇸 and Japan 🇯🇵
While global markets panic over supply shocks, geopolitics, and oil spikes… China has been quietly building a buffer that can influence price stability, trade leverage, and energy security for years ahead.
💡 In a world where oil = power, inventories = strategy.
This isn’t just storage. It’s positioning.
And it raises one big question for traders and analysts:
👉 Who really controls the next oil cycle — producers or stockpilers?
#China #OilMarkets #CrudeOil #EIA #BinanceSquare
$CL
As of Dec 2025, China holds the largest strategic crude oil inventories on the planet, reaching around 1,397 million barrels (EIA data).
That’s not just big — it’s massive.
📦 More than the combined reserves of the US 🇺🇸 and Japan 🇯🇵
While global markets panic over supply shocks, geopolitics, and oil spikes… China has been quietly building a buffer that can influence price stability, trade leverage, and energy security for years ahead.
💡 In a world where oil = power, inventories = strategy.
This isn’t just storage. It’s positioning.
And it raises one big question for traders and analysts:
👉 Who really controls the next oil cycle — producers or stockpilers?
#China #OilMarkets #CrudeOil #EIA #BinanceSquare
$CL
2
244

·
--
Article
EIA: US crude inventories down by 6.2 million barrels !Commercial crude oil inventories in the United States, not considering those in the Strategic Petroleum Reserve (SPR), declined by 2.3 million barrels to 459.5 million barrels in the week ending April 24, the Energy Information Administration (EIA) said in its report published on Wednesday.
Crude oil refinery inputs averaged 16.1 million barrels per day (bpd), 85,000 bpd more than the previous week's average. Refineries operated at 89.6% of their operable capacity. Gasoline production declined to an average of 9.8 million bpd.
Crude oil imports averaged 5.8 million bpd, down by 329,000 bpd week-on-week. Meanwhile, total commercial petroleum inventories went down by 17 million barrels.
#oil #BrentCrude #EIA
$CL
{future}(CLUSDT)
$BZ
{future}(BZUSDT)
EIA: US crude inventories down by 6.2 million barrels !
Commercial crude oil inventories in the United States, not considering those in the Strategic Petroleum Reserve (SPR), declined by 2.3 million barrels to 459.5 million barrels in the week ending April 24, the Energy Information Administration (EIA) said in its report published on Wednesday.
Crude oil refinery inputs averaged 16.1 million barrels per day (bpd), 85,000 bpd more than the previous week's average. Refineries operated at 89.6% of their operable capacity. Gasoline production declined to an average of 9.8 million bpd.
Crude oil imports averaged 5.8 million bpd, down by 329,000 bpd week-on-week. Meanwhile, total commercial petroleum inventories went down by 17 million barrels.
#oil #BrentCrude #EIA
$CL
$BZ
Crude oil refinery inputs averaged 16.1 million barrels per day (bpd), 85,000 bpd more than the previous week's average. Refineries operated at 89.6% of their operable capacity. Gasoline production declined to an average of 9.8 million bpd.
Crude oil imports averaged 5.8 million bpd, down by 329,000 bpd week-on-week. Meanwhile, total commercial petroleum inventories went down by 17 million barrels.
#oil #BrentCrude #EIA
$CL
$BZ
4
1
5
1.6k

📢 OIL FORECASTS JUST GOT A BULLISH REWRITE — SUPPLY TIGHTNESS IS BEING PRICED IN 📈
The EIA just lifted its 2026 WTI projection to $80.88, a meaningful $4.62 revision above the prior view. Brent follows the same script, now penciled in at $86.81 for 2026. 📊 This is not a headline blip — it’s a structural repricing of the forward curve.
📌 The 2027 numbers are even more telling. WTI at $65.39 and Brent at $69.39 both reflect a market that expects sustained supply discipline, not a demand collapse. 📈 The upward revision across every single contract year signals institutional consensus that the glut narrative is losing credibility.
💡 For commodity traders, this spread between 2026 strength and 2027 moderation is where the smart positioning lives. The curve is steepening — and steep curves reward patience. 💬 Are you trading the front of the curve or positioning for the longer-dated re-rate? 🤔
⚠️ Not financial advice. Always manage your risk. 🛡️
🏷️ #Oil #WTI #Energy #Commodities #EIA
📈 🦈
📢 OIL FORECASTS JUST GOT A BULLISH REWRITE — SUPPLY TIGHTNESS IS BEING PRICED IN 📈
The EIA just lifted its 2026 WTI projection to $80.88, a meaningful $4.62 revision above the prior view. Brent follows the same script, now penciled in at $86.81 for 2026. 📊 This is not a headline blip — it’s a structural repricing of the forward curve.
📌 The 2027 numbers are even more telling. WTI at $65.39 and Brent at $69.39 both reflect a market that expects sustained supply discipline, not a demand collapse. 📈 The upward revision across every single contract year signals institutional consensus that the glut narrative is losing credibility.
💡 For commodity traders, this spread between 2026 strength and 2027 moderation is where the smart positioning lives. The curve is steepening — and steep curves reward patience. 💬 Are you trading the front of the curve or positioning for the longer-dated re-rate? 🤔
⚠️ Not financial advice. Always manage your risk. 🛡️
🏷️ #Oil #WTI #Energy #Commodities #EIA
📈 🦈
The EIA just lifted its 2026 WTI projection to $80.88, a meaningful $4.62 revision above the prior view. Brent follows the same script, now penciled in at $86.81 for 2026. 📊 This is not a headline blip — it’s a structural repricing of the forward curve.
📌 The 2027 numbers are even more telling. WTI at $65.39 and Brent at $69.39 both reflect a market that expects sustained supply discipline, not a demand collapse. 📈 The upward revision across every single contract year signals institutional consensus that the glut narrative is losing credibility.
💡 For commodity traders, this spread between 2026 strength and 2027 moderation is where the smart positioning lives. The curve is steepening — and steep curves reward patience. 💬 Are you trading the front of the curve or positioning for the longer-dated re-rate? 🤔
⚠️ Not financial advice. Always manage your risk. 🛡️
🏷️ #Oil #WTI #Energy #Commodities #EIA
📈 🦈
115
Log in to explore more content
Join global crypto users on Binance Square
⚡️ Get latest and useful information about crypto.
💬 Trusted by the world’s largest crypto exchange.
👍 Discover real insights from verified creators.
Email / Phone number
Trending Topics
1
#HKCompletesFirstHKDStablecoinUseCase
855 views
69 Discussing
2
#VietnamPlansFirstCryptoLicensesIn2026
552 views
44 Discussing
3
#BTCBreaks80K
190,626 views
3,102 Discussing
4
#BitcoinMarketCapTopsTesla
13,943 views
458 Discussing
5
#SOLJumpsAbout10%
23,211 views
535 Discussing
6
#EthereumReclaims$2600
2,294 views
76 Discussing
7
#LineraShutsDownAfterFundraisingFallsShort
5,694 views
131 Discussing
8
#SECReceivesAmendedInjectiveETFFiling
16,099 views
400 Discussing
9
#SanDiskToJoinSP100OnSep21
12,032 views
255 Discussing
10
#PolygonToDeployContractBurning100MPOL
7,329 views
200 Discussing