
#dominancebtc
dominancebtc
204,800 views
212 Discussing
Hot
Latest

There’s still time to exit #BTC and move into Bainance Alpha coins!
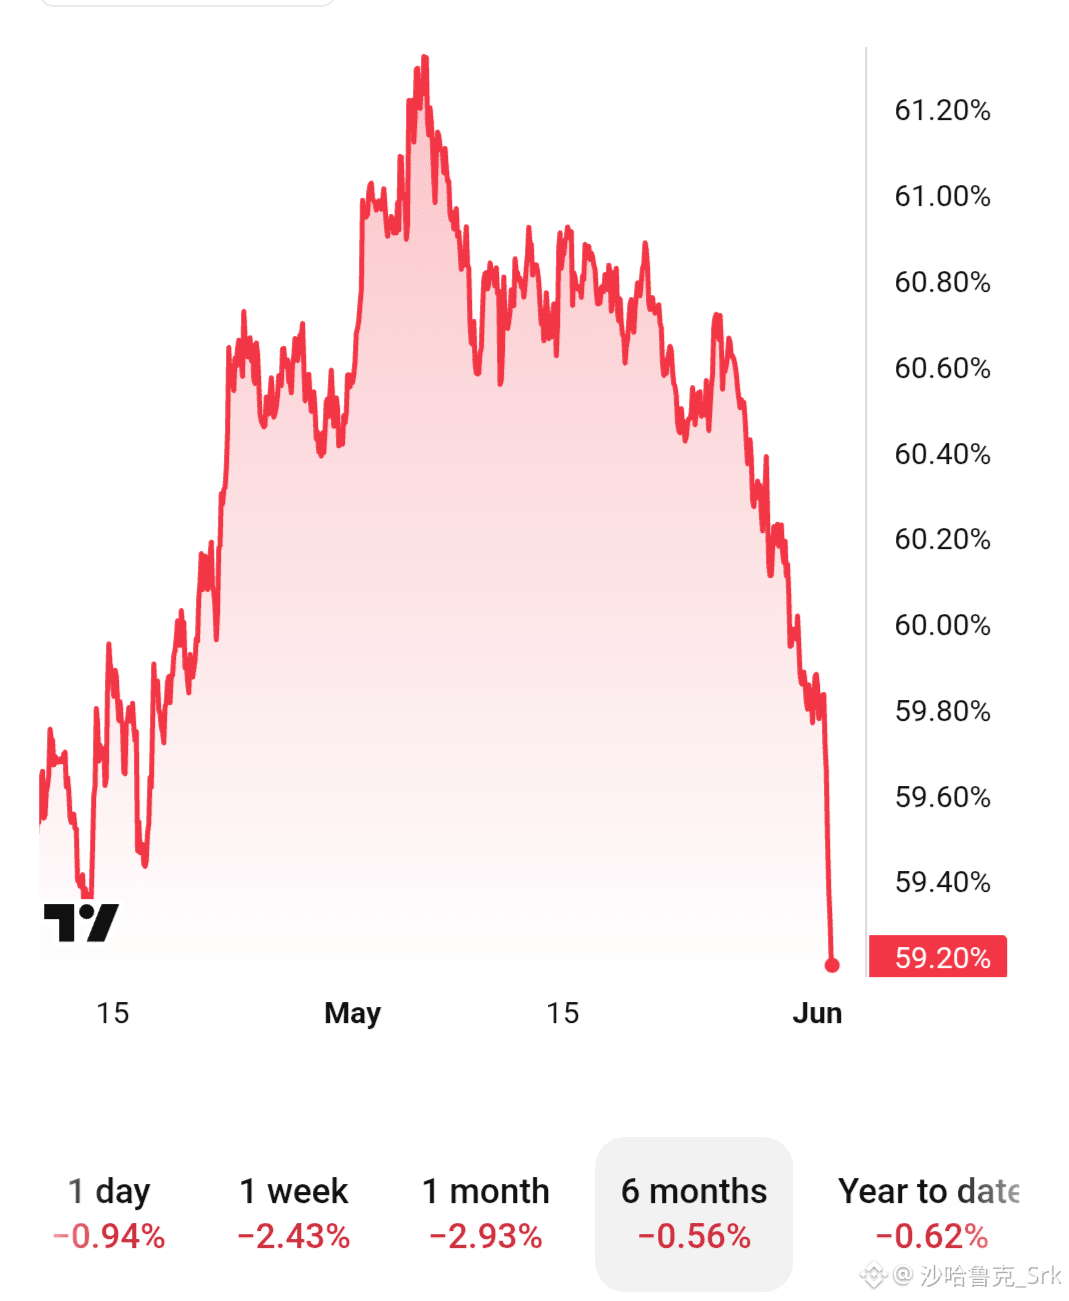
$BTC dominance is dropping, and its price is also declining. $ETH $BNB #EthereumStakingRatioRecordHigh #dominancebtc #StrategyFirstBitcoinSale
$BTC dominance is dropping, and its price is also declining. $ETH $BNB #EthereumStakingRatioRecordHigh #dominancebtc #StrategyFirstBitcoinSale


$ETH .D
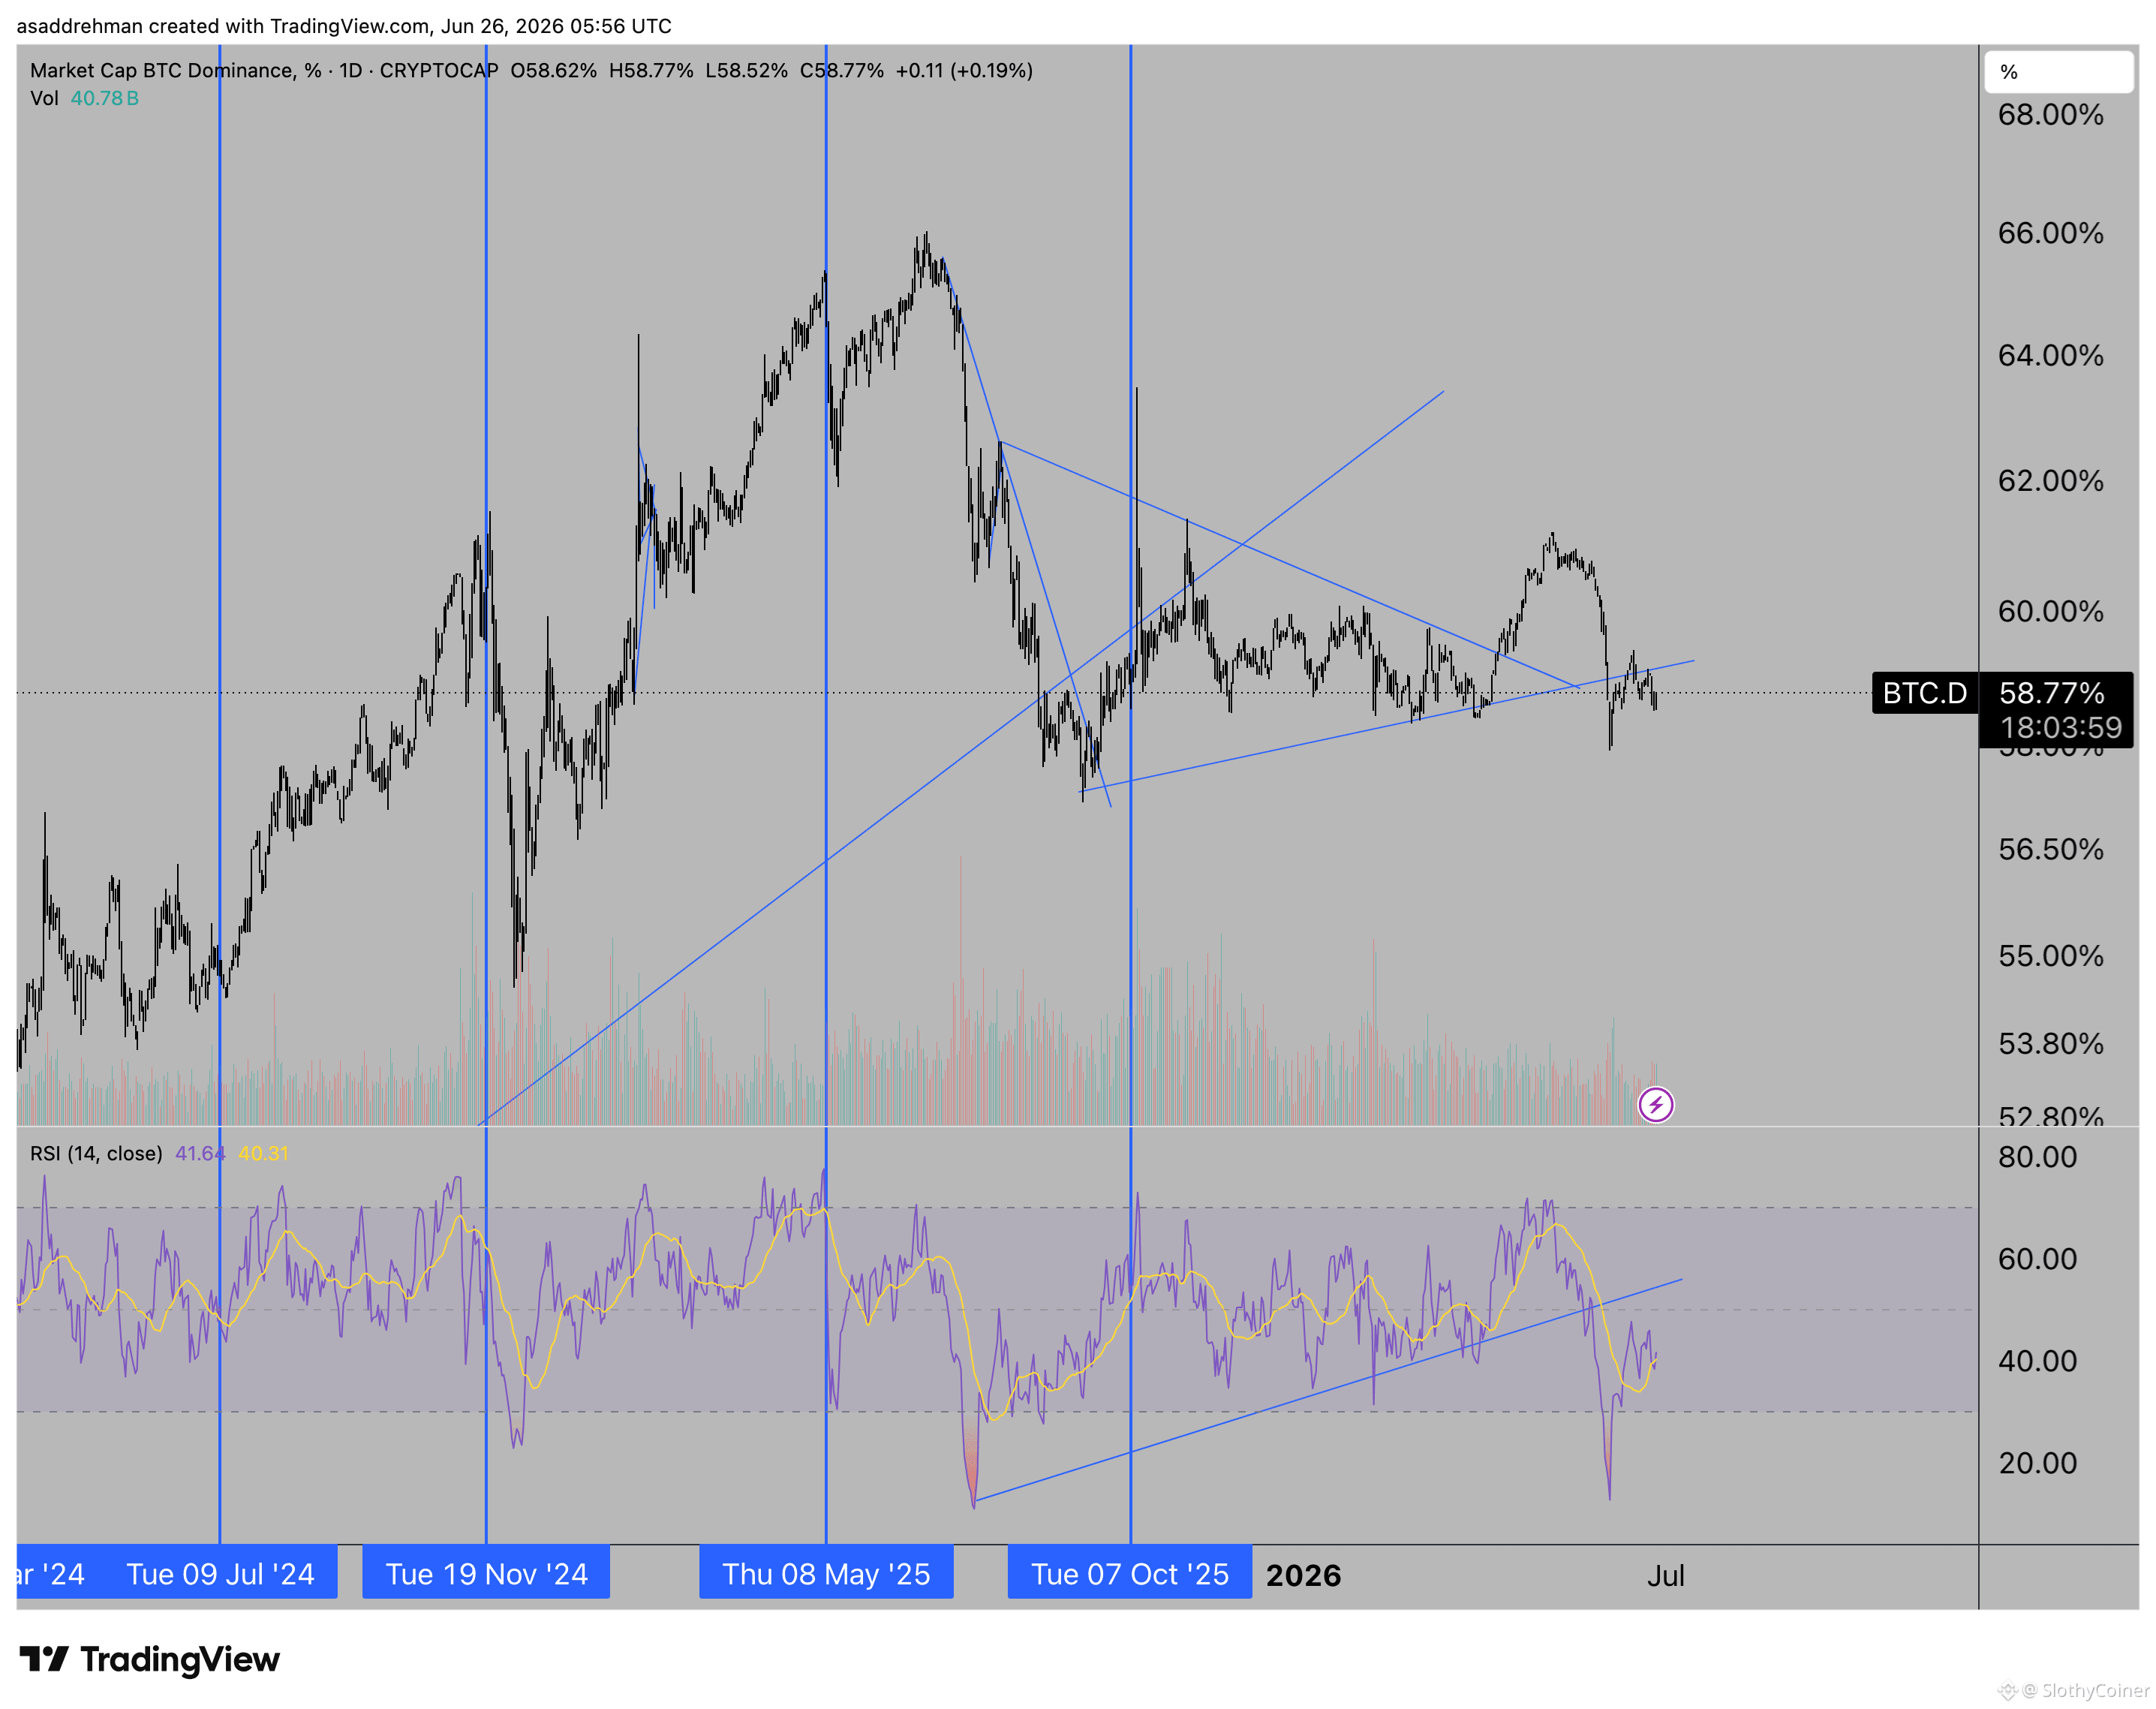
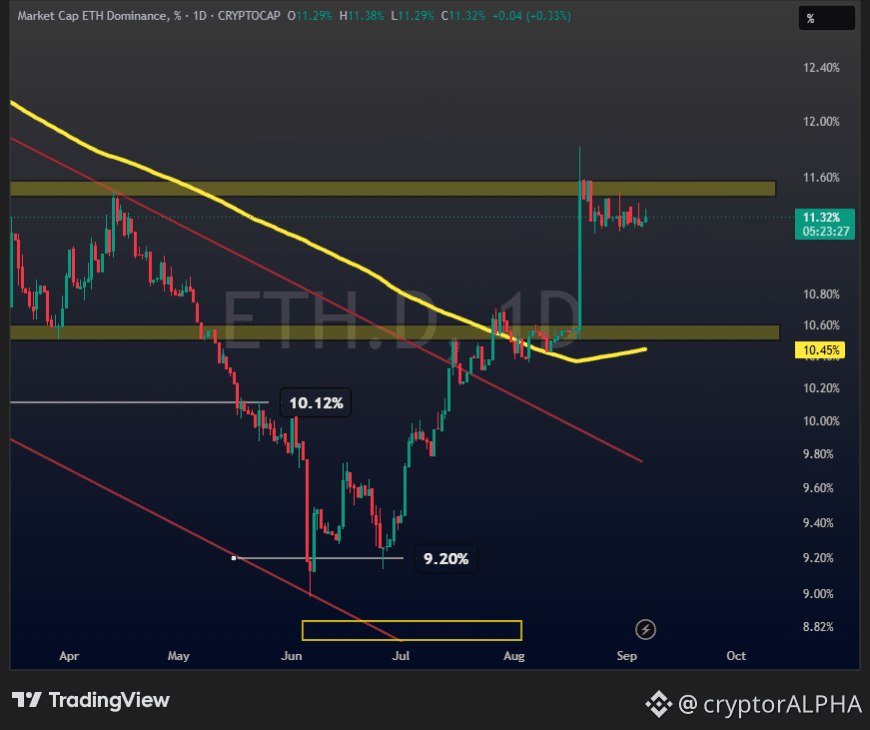
BTC.D crashing while ETH.D is not moving, not even a little.
Right now, the chart is consolidating under a resistance, that was tapped when eth pumped from 1900 to 2500 in the 18-19 aug pump.
Along with ETH.D, BTC.D pumped as well, but that chart has retraced almost entirely the whole pump.
So, if ETH.D is falling, BTC.D is falling, where is all this money is going?
To the smaller caps.
You know this is not a good idea as money flowing into low caps is usually the last stop of capital before it moves into stablecoins.
#BTC #Ethereum #dominancebtc #altcoins #MarketUpdate
BTC.D crashing while ETH.D is not moving, not even a little.
Right now, the chart is consolidating under a resistance, that was tapped when eth pumped from 1900 to 2500 in the 18-19 aug pump.
Along with ETH.D, BTC.D pumped as well, but that chart has retraced almost entirely the whole pump.
So, if ETH.D is falling, BTC.D is falling, where is all this money is going?
To the smaller caps.
You know this is not a good idea as money flowing into low caps is usually the last stop of capital before it moves into stablecoins.
#BTC #Ethereum #dominancebtc #altcoins #MarketUpdate

market cap
other charts
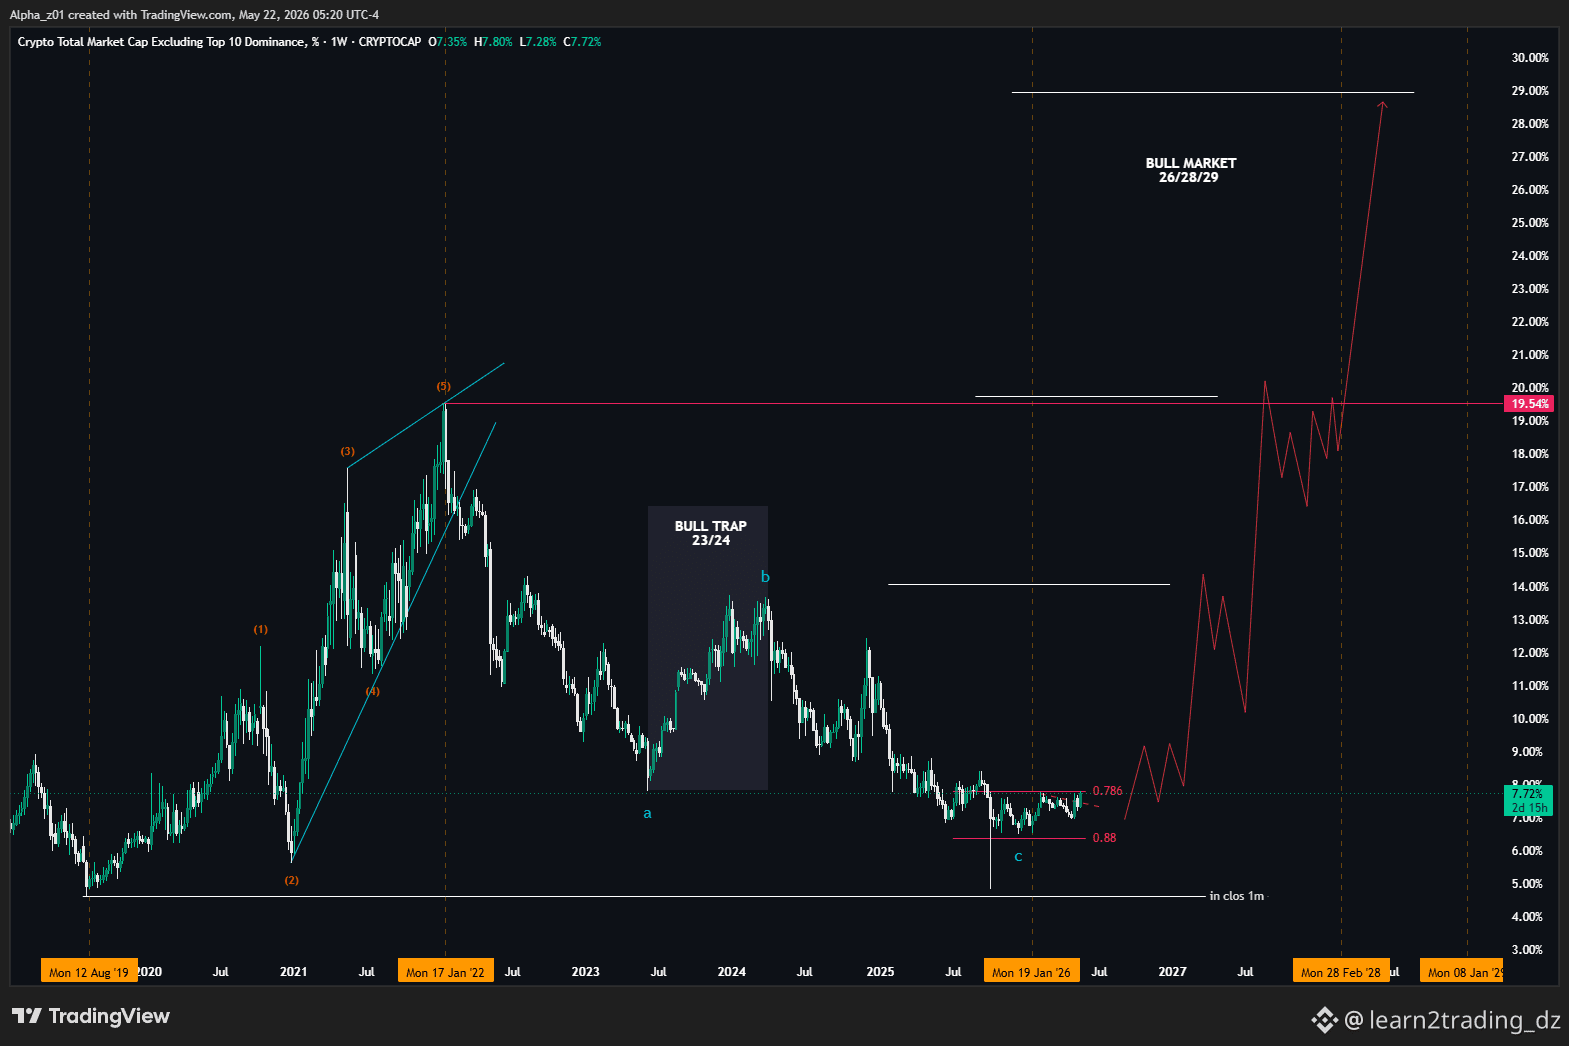
The market cap of the crypto sector is projected to hit around $750 billion
#others #dominancebtc
other charts
The market cap of the crypto sector is projected to hit around $750 billion
#others #dominancebtc


USDT Dominance
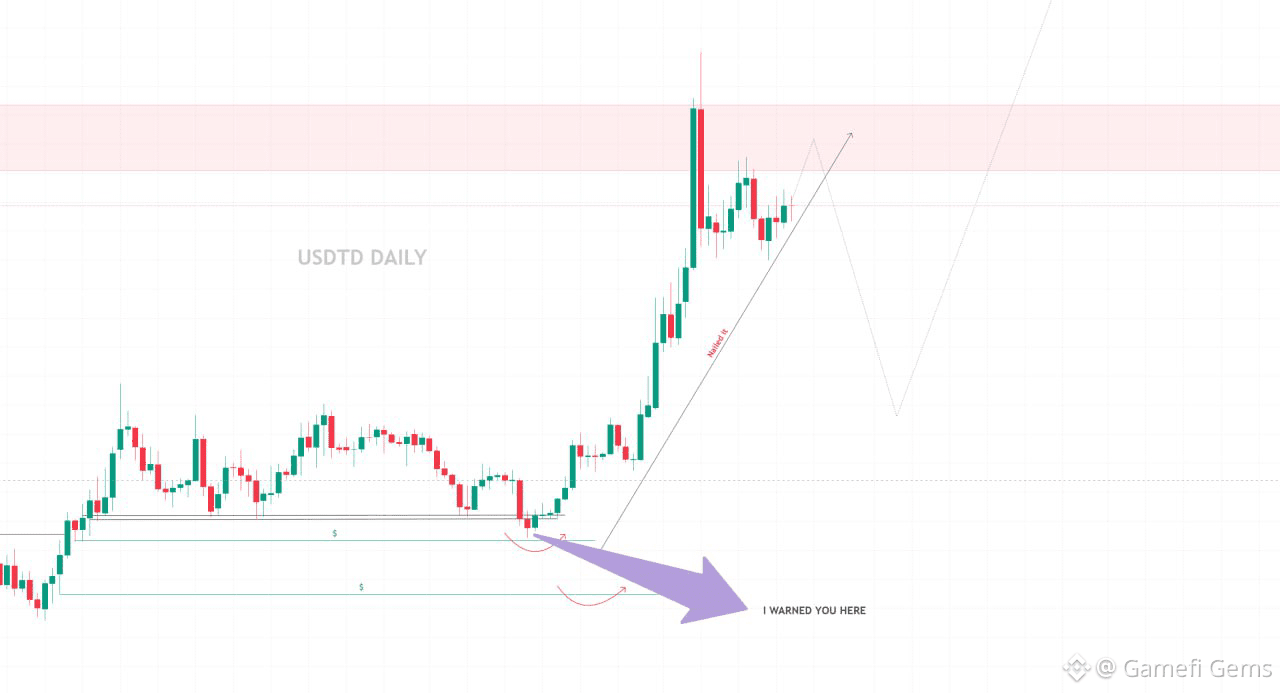
After accurately predicting the crypto bloodbath, I believe it’s now my responsibility to forecast the next bullish market.
As you can see below, USDT Dominance pumped strongly from the level I previously mentioned, which led to a significant decline in the crypto market over the past few months.
Looking at the current market structure, this is clearly not a bottom zone. The market is likely to move further down, possibly below the 50–54K range, before forming a final bottom.
During this bearish phase, the liquidity sweeps around the 72K and 84–80K zones further support this outlook.
#StrategyBTCPurchase #btc #USDT #dominancebtc #bitcoin
$BTC
$ETH
$BNB
After accurately predicting the crypto bloodbath, I believe it’s now my responsibility to forecast the next bullish market.
As you can see below, USDT Dominance pumped strongly from the level I previously mentioned, which led to a significant decline in the crypto market over the past few months.
Looking at the current market structure, this is clearly not a bottom zone. The market is likely to move further down, possibly below the 50–54K range, before forming a final bottom.
During this bearish phase, the liquidity sweeps around the 72K and 84–80K zones further support this outlook.
#StrategyBTCPurchase #btc #USDT #dominancebtc #bitcoin
$BTC
$ETH
$BNB
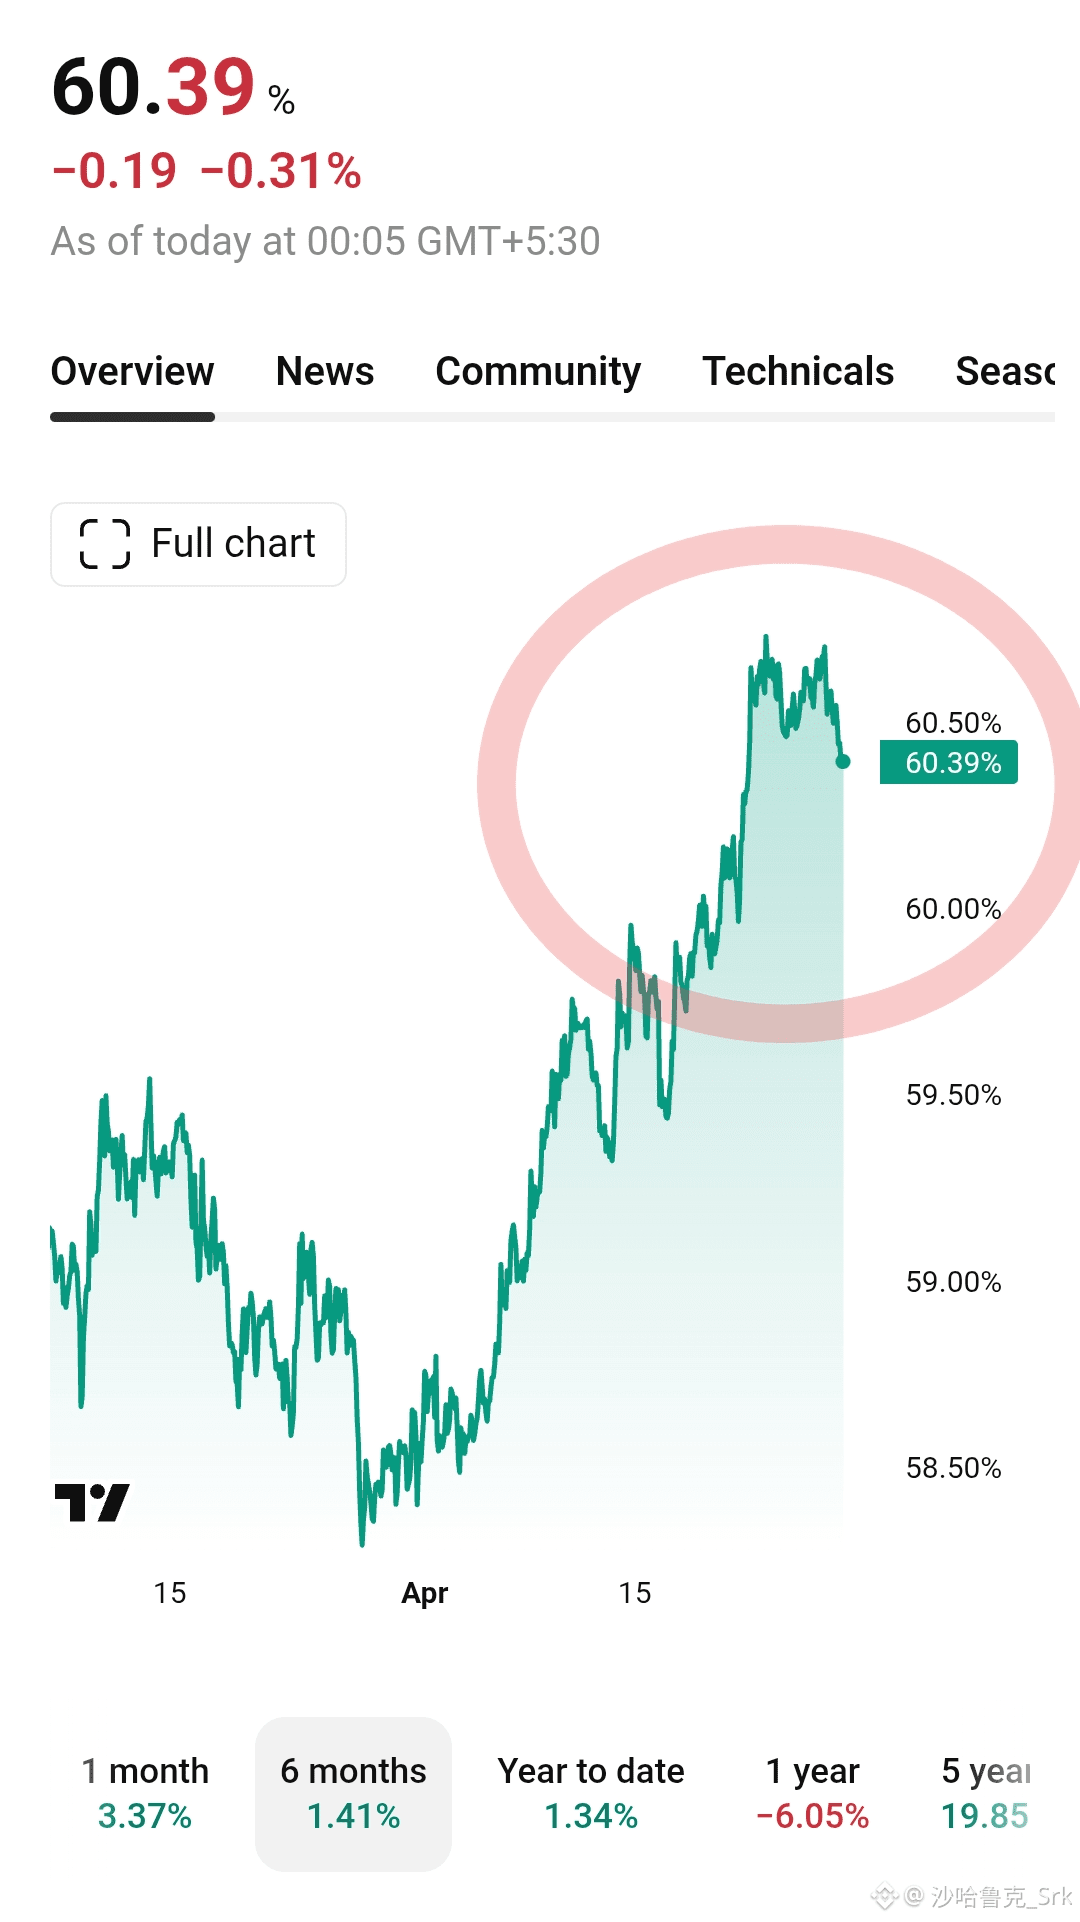
🚨 Wait 🚨
$BTC dominance analysis is correct❓
#dominancebtc #TrumpPauses'ProjectFreedom' #TrumpUnveilsPlanToEscortHormuzShips
$ETH $SHIB
$BTC dominance analysis is correct❓
#dominancebtc #TrumpPauses'ProjectFreedom' #TrumpUnveilsPlanToEscortHormuzShips
$ETH $SHIB
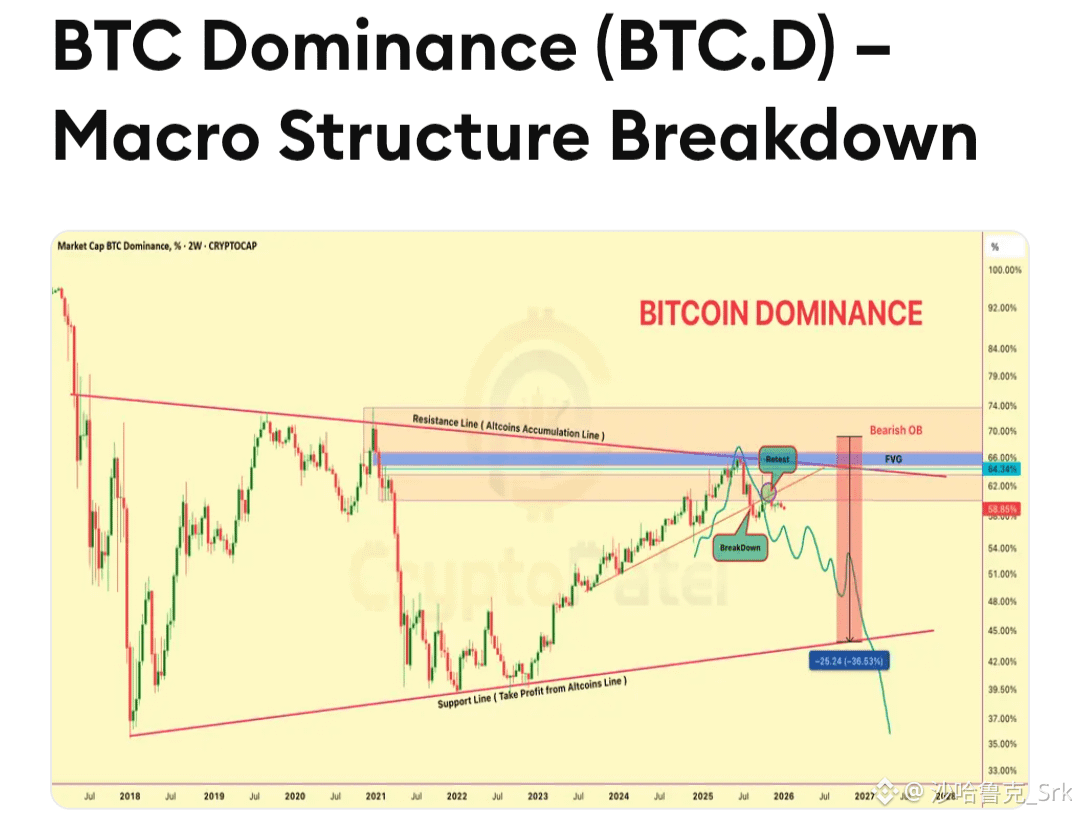
🤑There is a very high chance that $ETH will go up🤑
A clear "Ⓜ️" pattern has emerged in $BTC dominance, suggesting a high probability of a downward move.
Plz Don't using high risk, Hold hold hold eth and Wait!
do your wn research before investing
#dominancebtc #dominanceusdt #BTCDOMINACE
#ArthurHayes’LatestSpeech
A clear "Ⓜ️" pattern has emerged in $BTC dominance, suggesting a high probability of a downward move.
Plz Don't using high risk, Hold hold hold eth and Wait!
do your wn research before investing
#dominancebtc #dominanceusdt #BTCDOMINACE
#ArthurHayes’LatestSpeech



BTC.D
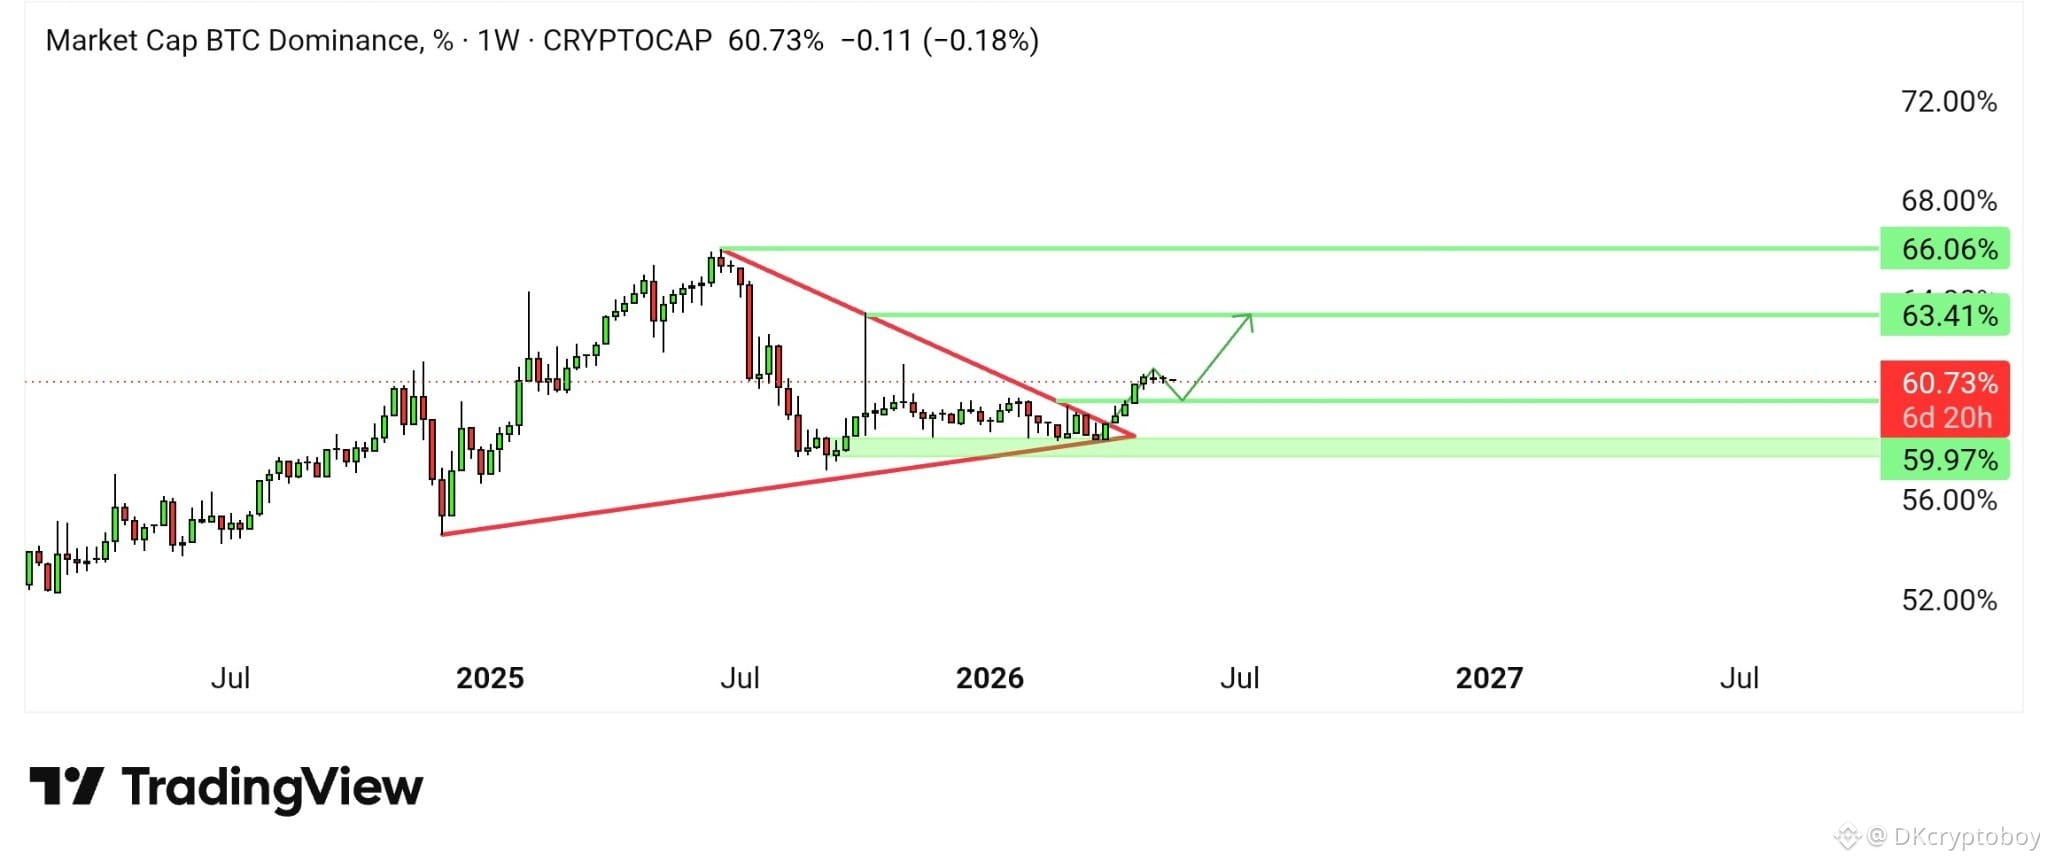
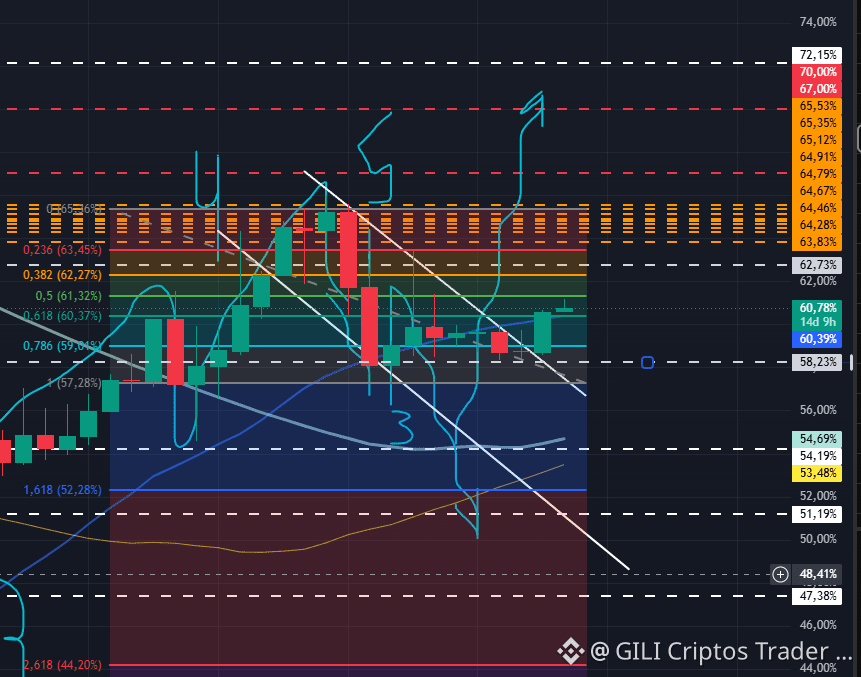
Bitcoin dominance on a weekly chart is showing strength for an upward movement. Breakout done on the weekly and heading towards levels of 63% or higher. We may see some retracement to the 59.9% area, but the overall scenario is bullish for BTC.D. This bias is valid as long as it stays above the 58-57% area.
We will try to keep updating accordingly !!!
#btcd #dominancebtc
Bitcoin dominance on a weekly chart is showing strength for an upward movement. Breakout done on the weekly and heading towards levels of 63% or higher. We may see some retracement to the 59.9% area, but the overall scenario is bullish for BTC.D. This bias is valid as long as it stays above the 58-57% area.
We will try to keep updating accordingly !!!
#btcd #dominancebtc

#dominancebtc
WE'RE WAITING FOR THE MUCH-ANTICIPATED MOMENT.
BTC.D TO DROP ALONGSIDE USDT.D AS WELL.
AND OTHER.D TO EXPLODE UPWARD......
THIS TIME IT'LL BE DIFFERENT...
$MUB
$
$BTC $BNB
WE'RE WAITING FOR THE MUCH-ANTICIPATED MOMENT.
BTC.D TO DROP ALONGSIDE USDT.D AS WELL.
AND OTHER.D TO EXPLODE UPWARD......
THIS TIME IT'LL BE DIFFERENT...
$MUB
$
$BTC $BNB

Bitcoin Dominance Explained $BTC
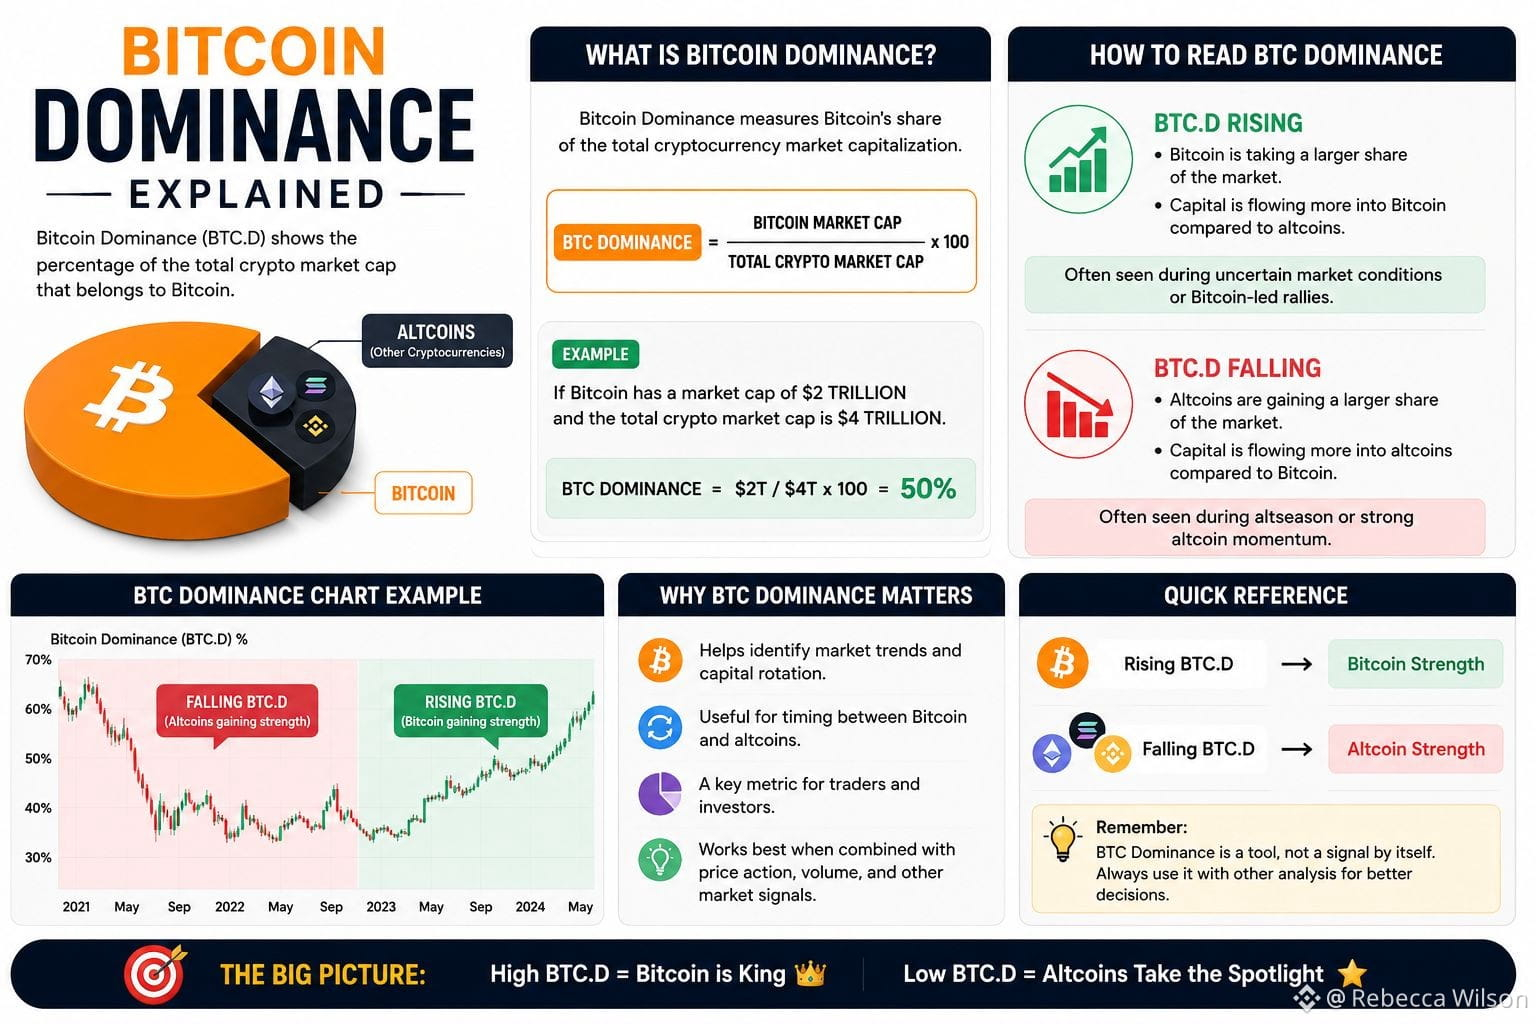
Bitcoin Dominance (BTC.D) measures Bitcoin's share of the total cryptocurrency market capitalization.
Formula:
BTC Dominance = Bitcoin Market Cap ÷ Total Crypto Market Cap × 100
📈 If BTC.D rises: Bitcoin is gaining market share compared with altcoins.
📉 If BTC.D falls: Altcoins are gaining market share, which can sometimes signal stronger altcoin performance.
Example: If Bitcoin has a $2T market cap and the entire crypto market is $4T, BTC dominance is 50%.
💡 Trading takeaway: BTC.D can help you understand whether capital is flowing toward Bitcoin or the broader altcoin market—but it should be used alongside price action, volume, and market conditions.
Simple rule:
🟠 Rising BTC.D → BTC stronger relative to alts
🔵 Falling BTC.D → Alts stronger relative to BTC
#CryptoEducation #bitcoin #Altcoins #dominancebtc #BinanceSquare $IDOL $1000RATS
Bitcoin Dominance (BTC.D) measures Bitcoin's share of the total cryptocurrency market capitalization.
Formula:
BTC Dominance = Bitcoin Market Cap ÷ Total Crypto Market Cap × 100
📈 If BTC.D rises: Bitcoin is gaining market share compared with altcoins.
📉 If BTC.D falls: Altcoins are gaining market share, which can sometimes signal stronger altcoin performance.
Example: If Bitcoin has a $2T market cap and the entire crypto market is $4T, BTC dominance is 50%.
💡 Trading takeaway: BTC.D can help you understand whether capital is flowing toward Bitcoin or the broader altcoin market—but it should be used alongside price action, volume, and market conditions.
Simple rule:
🟠 Rising BTC.D → BTC stronger relative to alts
🔵 Falling BTC.D → Alts stronger relative to BTC
#CryptoEducation #bitcoin #Altcoins #dominancebtc #BinanceSquare $IDOL $1000RATS

$USDT Dominance - Update
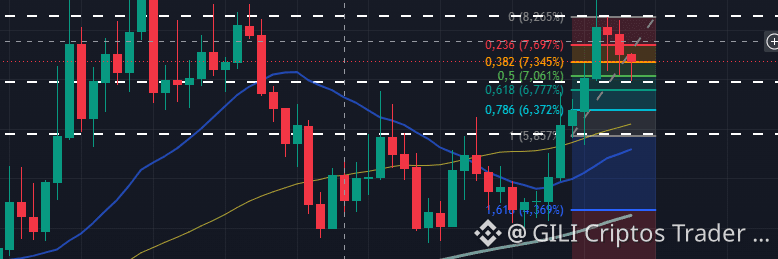
We held that support zone so this is why we are dumping. Always pay attention to $USDT . Resistance is coming up at 8.15%. Local bottom on $BTC soon ?
#BinanceRollsOutTradingInUSStocks #BTC #USDT #dominancebtc #bitcoin
We held that support zone so this is why we are dumping. Always pay attention to $USDT . Resistance is coming up at 8.15%. Local bottom on $BTC soon ?
#BinanceRollsOutTradingInUSStocks #BTC #USDT #dominancebtc #bitcoin

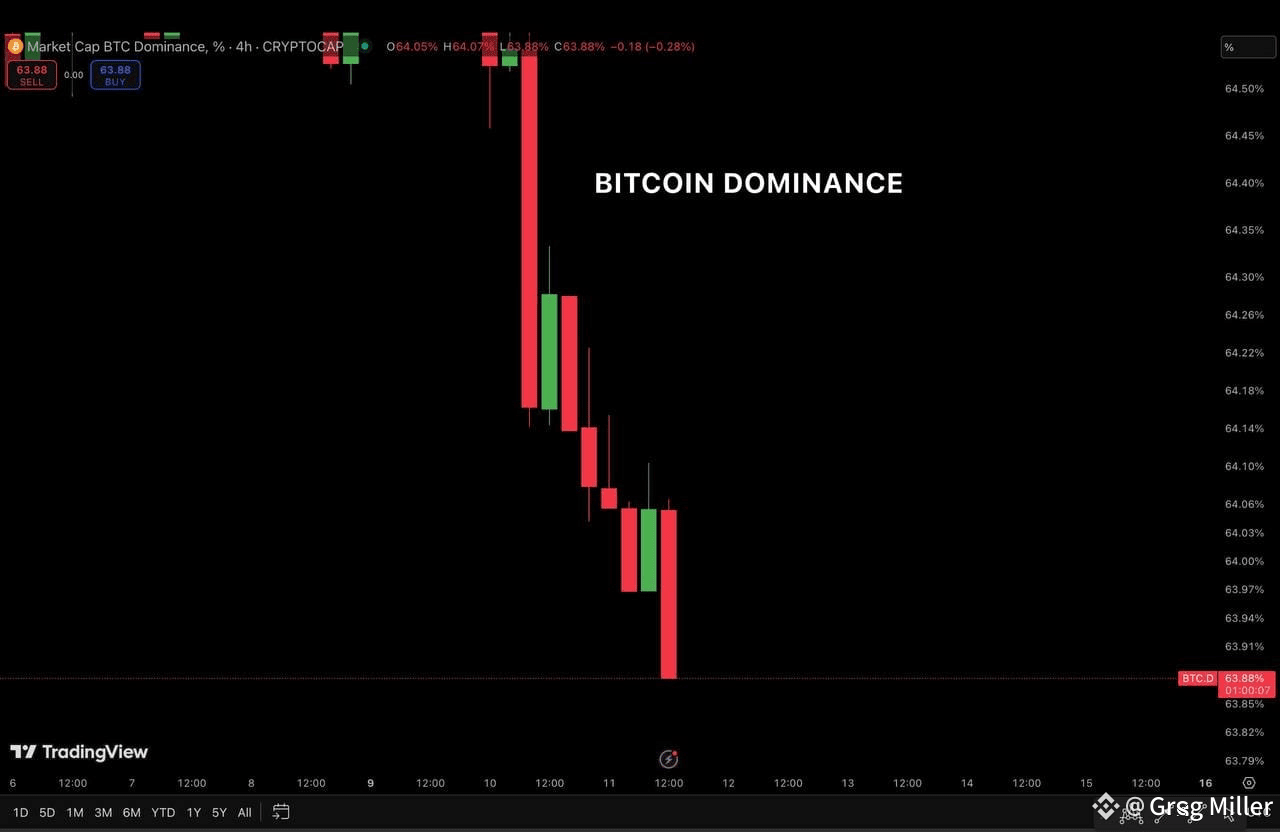
🚨 BITCOIN DOMINANCE DROPPING!
Capital rotating fast into $ETH — Altseason might be kicking off 🚀
#dominancebtc #ETH #GregLens
Capital rotating fast into $ETH — Altseason might be kicking off 🚀
#dominancebtc #ETH #GregLens
Log in to explore more content