
#avgo
avgo
47,536 views
747 Discussing
Hot
Latest

🔌 BROADCOM: BLUE-CHIP TECH WITH AI + SEMI EXPOSURE
Broadcom ($AVGO
) is a top undervalued tech stock with dominant positions in networking, AI chips, and infrastructure.
As AI clusters expand, AVGO's custom silicon and switching chips are critical.
Strong cash flow, dividend growth, and institutional backing make it a core holding.
📌 Investment Thesis:
✅ Market leader in AI networking
✅ Consistent earnings + dividend growth
✅ Defensive yet high-growth profile
💡 Ideal for long-term portfolios + swing trades on pullbacks.
⚠️ NFA. Always manage position size.
#avgo #broadcom #stocks #AI #Semiconductors
Broadcom ($AVGO
) is a top undervalued tech stock with dominant positions in networking, AI chips, and infrastructure.
As AI clusters expand, AVGO's custom silicon and switching chips are critical.
Strong cash flow, dividend growth, and institutional backing make it a core holding.
📌 Investment Thesis:
✅ Market leader in AI networking
✅ Consistent earnings + dividend growth
✅ Defensive yet high-growth profile
💡 Ideal for long-term portfolios + swing trades on pullbacks.
⚠️ NFA. Always manage position size.
#avgo #broadcom #stocks #AI #Semiconductors
💻 BROADCOM: THE AI CHIP GIANT YOU'RE NOT OWNINg 💻
$AVGO
is one of the BEST tech stocks for 2026. While everyone chases NVIDIA, Broadcom is quietly dominating AI infrastructure.
Why AVGO?
🚀 AI chip demand = revenue explosion
🚀 VMware acquisition = enterprise software moat
🚀 Consistent dividend growth
🚀 Analyst favorite for long-term holds
Key stats:
📊 Sector: Technology/Semiconductors
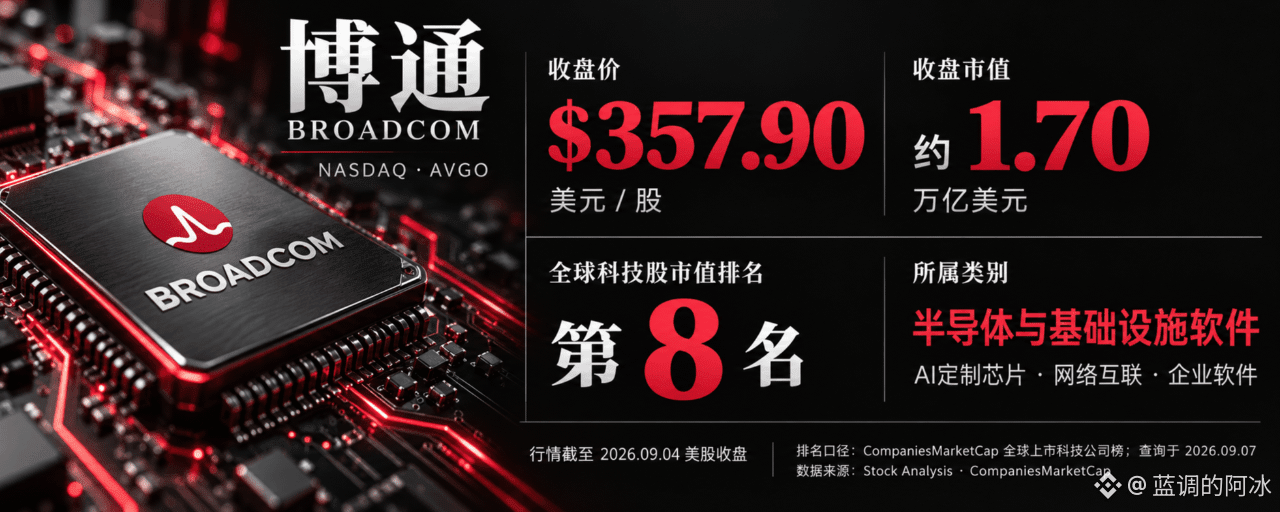
📊 Market Cap: Top 10 globally
📊 Dividend: Growing yield
📊 Target: New highs on AI momentum
Risk: Semiconductor cyclicality, but AI demand is structural.
This is a CORE holding for any tech portfolio.
#avgo #broadcom #stocks #Investing #AI
$AVGO
is one of the BEST tech stocks for 2026. While everyone chases NVIDIA, Broadcom is quietly dominating AI infrastructure.
Why AVGO?
🚀 AI chip demand = revenue explosion
🚀 VMware acquisition = enterprise software moat
🚀 Consistent dividend growth
🚀 Analyst favorite for long-term holds
Key stats:
📊 Sector: Technology/Semiconductors
📊 Market Cap: Top 10 globally
📊 Dividend: Growing yield
📊 Target: New highs on AI momentum
Risk: Semiconductor cyclicality, but AI demand is structural.
This is a CORE holding for any tech portfolio.
#avgo #broadcom #stocks #Investing #AI
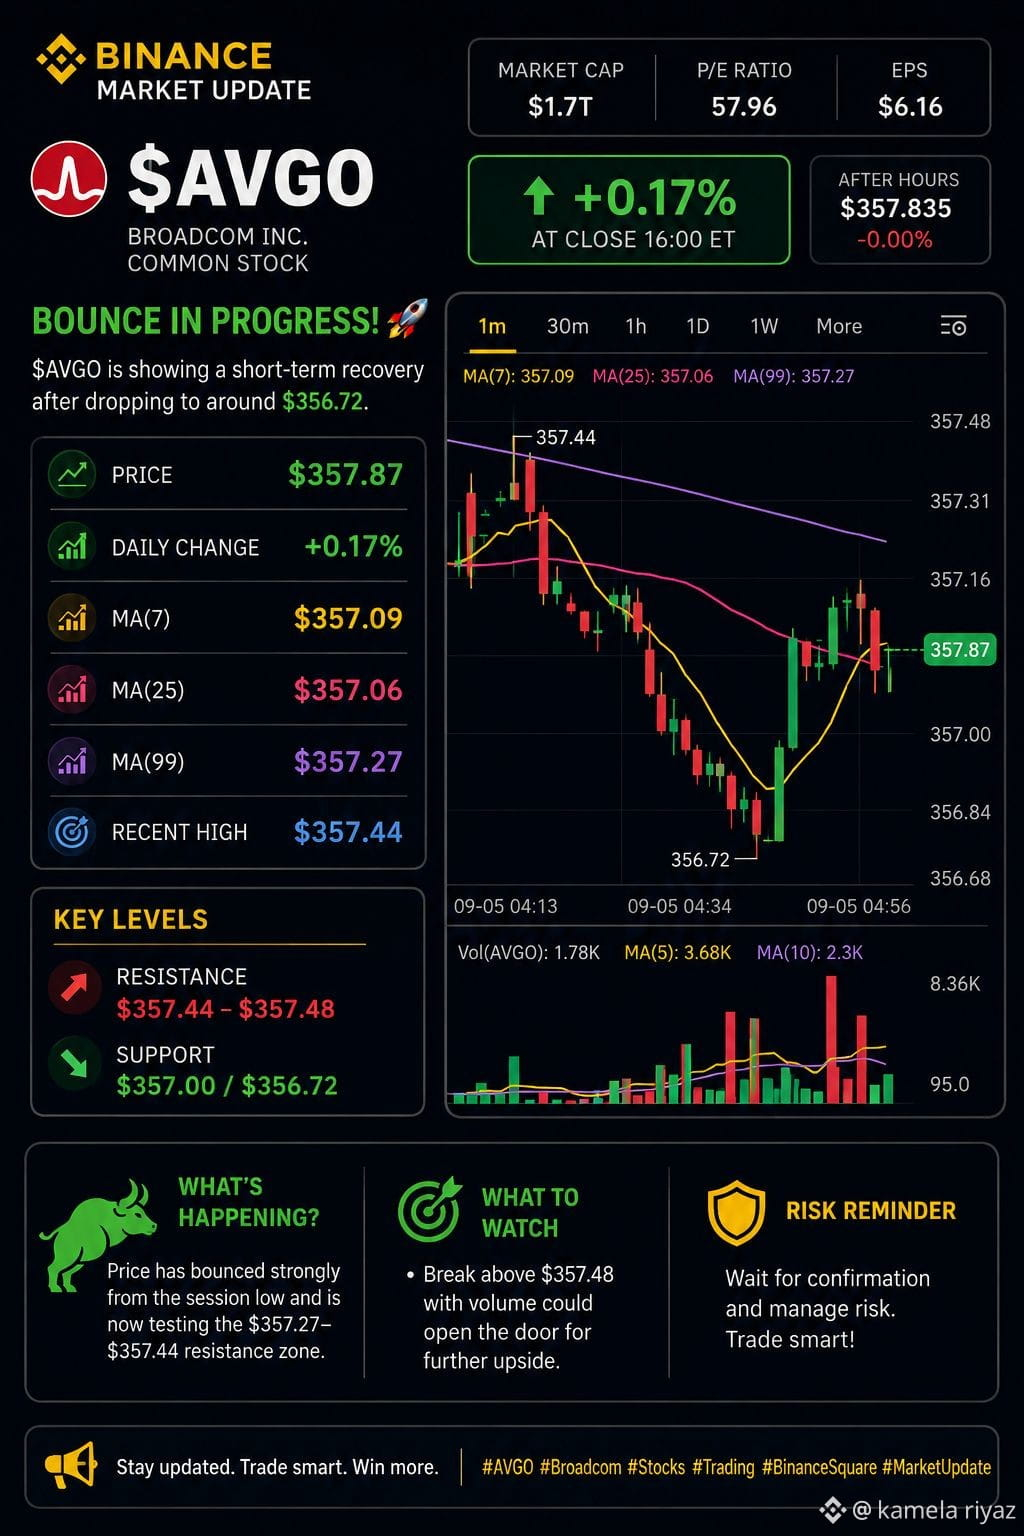
🚨 $AVGO GO — BOUNCE IN PROGRESS! 📈🔥
$AVGO is showing a short-term recovery after dropping to around $356.72.
💰 Price: $357.87
🟢 Daily: +0.17%
📊 MA(7): $357.09
📊 MA(25): $357.06
📊 MA(99): $357.27
🎯 Recent high: $357.44
🔥 Price has bounced strongly from the session low, but it’s now testing the $357.27–$357.44 resistance zone.
Key levels:
🔹 Resistance: $357.44–$357.48
🔹 Support: $357.00 / $356.72
🚀 Break above $357.48 with volume could open the door for further upside.
#AVGO #broadcom #Trading #BinanceSquareFamily #Market_Update 📈🔥
$AVGO is showing a short-term recovery after dropping to around $356.72.
💰 Price: $357.87
🟢 Daily: +0.17%
📊 MA(7): $357.09
📊 MA(25): $357.06
📊 MA(99): $357.27
🎯 Recent high: $357.44
🔥 Price has bounced strongly from the session low, but it’s now testing the $357.27–$357.44 resistance zone.
Key levels:
🔹 Resistance: $357.44–$357.48
🔹 Support: $357.00 / $356.72
🚀 Break above $357.48 with volume could open the door for further upside.
#AVGO #broadcom #Trading #BinanceSquareFamily #Market_Update 📈🔥

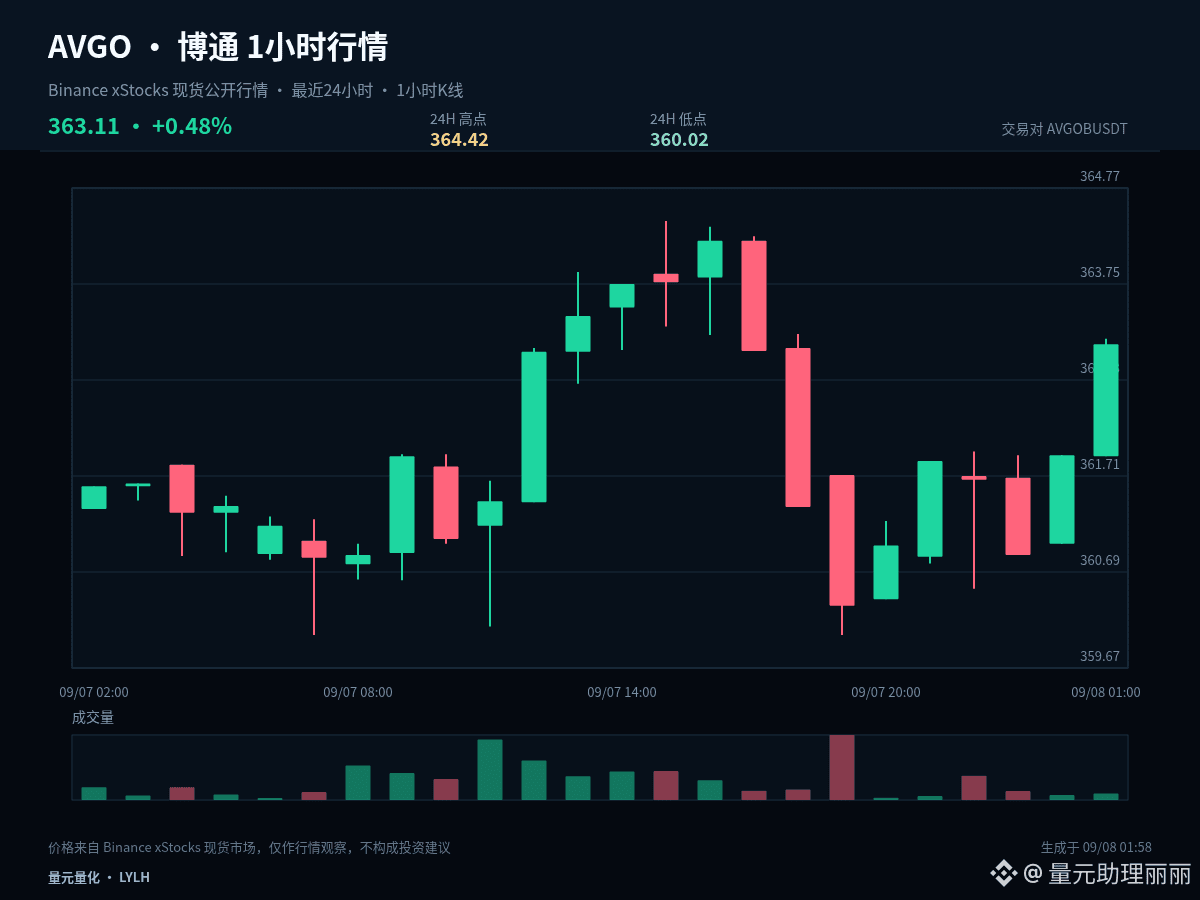
$AVGOB #AVGO Can this market trend continue? It does not depend on how much it has already risen, but on whether the trend can complete the cycle of “advance, consolidate, and reconfirm.” Currently, in the 1-hour window it is +0.33%, and in the 24-hour window it is +0.48%.
Right now, the 1-hour +0.33% and 24-hour +0.48% both exist, but the two periods have not formed sufficiently clear alignment in the same direction. In a range-bound market, the tolerance for chasing highs or selling lows is lower. It’s more suitable to confirm the direction using the upper boundary, confirm the holding on the lower boundary, and treat the midline only as the line separating strength from weakness.
The first condition for a continuation structure is that 362.22 is not effectively broken down. The second condition is that the price can retest and hold above 364.42. If, after the advance, price remains below the midline for a long time, it indicates that the active buying pressure has weakened. If it further loses 360.02, then the original continuation assumption needs to be canceled.
Set clear execution rules: after breaking above 364.42, you need confirmation—not just seeing a momentary surge and chasing. After dipping to 360.02, you need to see whether it can quickly reclaim—don’t buy simply because it falls. If the mid-range doesn’t offer sufficient odds, waiting itself is also part of the strategy.
Existing positions can be handled in stages according to key levels to avoid making all decisions at once. Those with no position should wait for the breakout confirmation or for a pullback to stabilize. Also, for U.S. stock-related assets, watch for volatility caused by trading session transitions. Your plan should be based on price conditions, not on emotion replacing execution.
Risk control still comes before the conclusion: execute only when conditions are met, and if the price invalidates the setup, reassess immediately. The larger the volatility, the more you should restrain single-position sizing. The above is a scenario projection based on the current 1-hour and 24-hour data and does not constitute any promise of returns.
#USIranTradeTankerStrikesEscalate
Right now, the 1-hour +0.33% and 24-hour +0.48% both exist, but the two periods have not formed sufficiently clear alignment in the same direction. In a range-bound market, the tolerance for chasing highs or selling lows is lower. It’s more suitable to confirm the direction using the upper boundary, confirm the holding on the lower boundary, and treat the midline only as the line separating strength from weakness.
The first condition for a continuation structure is that 362.22 is not effectively broken down. The second condition is that the price can retest and hold above 364.42. If, after the advance, price remains below the midline for a long time, it indicates that the active buying pressure has weakened. If it further loses 360.02, then the original continuation assumption needs to be canceled.
Set clear execution rules: after breaking above 364.42, you need confirmation—not just seeing a momentary surge and chasing. After dipping to 360.02, you need to see whether it can quickly reclaim—don’t buy simply because it falls. If the mid-range doesn’t offer sufficient odds, waiting itself is also part of the strategy.
Existing positions can be handled in stages according to key levels to avoid making all decisions at once. Those with no position should wait for the breakout confirmation or for a pullback to stabilize. Also, for U.S. stock-related assets, watch for volatility caused by trading session transitions. Your plan should be based on price conditions, not on emotion replacing execution.
Risk control still comes before the conclusion: execute only when conditions are met, and if the price invalidates the setup, reassess immediately. The larger the volatility, the more you should restrain single-position sizing. The above is a scenario projection based on the current 1-hour and 24-hour data and does not constitute any promise of returns.
#USIranTradeTankerStrikesEscalate

$AVGOB #AVGO is currently more like range rotation; there is no need to explain every 1-hour candlestick as a new trend. Current price 364.2, 1-hour +0.12%, 24-hour +0.83%.
The current price is near the upper end of the recent 24-hour range, with 1-hour +0.12% and 24-hour +0.83%. At high levels, the most important thing is confirming the acceptance after a breakout: if price can stay above the upper boundary, it shows the market recognizes a higher range; if it only briefly pierces through and then quickly falls back, beware of a false breakout.
Range upper boundary 364.42, lower boundary 359, midpoint 361.71. Near the upper boundary, watch the quality of the breakout; near the lower boundary, watch for support; around the midpoint, reduce frequent trading, because it is not far enough from either side and the direction and risk-reward ratio are unclear.
The signals truly worth acting on are when price is willing to stay in the new range after breaking the boundary, or quickly reclaim it after testing the boundary. Without this kind of confirmation, continue treating it as consolidation and do not change the overall plan because of brief intraday fluctuations.
Existing positions can be handled in stages according to key levels to avoid making all decisions at once; those with no position should wait for breakout confirmation or a successful retest and stabilization. For U.S. stock names, also pay attention to volatility brought by session changes. The plan should be based on price conditions, not emotions.
The focus of short-term positions is not predicting every candlestick, but making entries, reductions, and exits all based on evidence. If there is no confirmation, do less; if a key level fails, redo the plan. First control the risk per trade, then talk about the follow-up room.
#IranToSetRestrictedZoneNearHormuz
The current price is near the upper end of the recent 24-hour range, with 1-hour +0.12% and 24-hour +0.83%. At high levels, the most important thing is confirming the acceptance after a breakout: if price can stay above the upper boundary, it shows the market recognizes a higher range; if it only briefly pierces through and then quickly falls back, beware of a false breakout.
Range upper boundary 364.42, lower boundary 359, midpoint 361.71. Near the upper boundary, watch the quality of the breakout; near the lower boundary, watch for support; around the midpoint, reduce frequent trading, because it is not far enough from either side and the direction and risk-reward ratio are unclear.
The signals truly worth acting on are when price is willing to stay in the new range after breaking the boundary, or quickly reclaim it after testing the boundary. Without this kind of confirmation, continue treating it as consolidation and do not change the overall plan because of brief intraday fluctuations.
Existing positions can be handled in stages according to key levels to avoid making all decisions at once; those with no position should wait for breakout confirmation or a successful retest and stabilization. For U.S. stock names, also pay attention to volatility brought by session changes. The plan should be based on price conditions, not emotions.
The focus of short-term positions is not predicting every candlestick, but making entries, reductions, and exits all based on evidence. If there is no confirmation, do less; if a key level fails, redo the plan. First control the risk per trade, then talk about the follow-up room.
#IranToSetRestrictedZoneNearHormuz
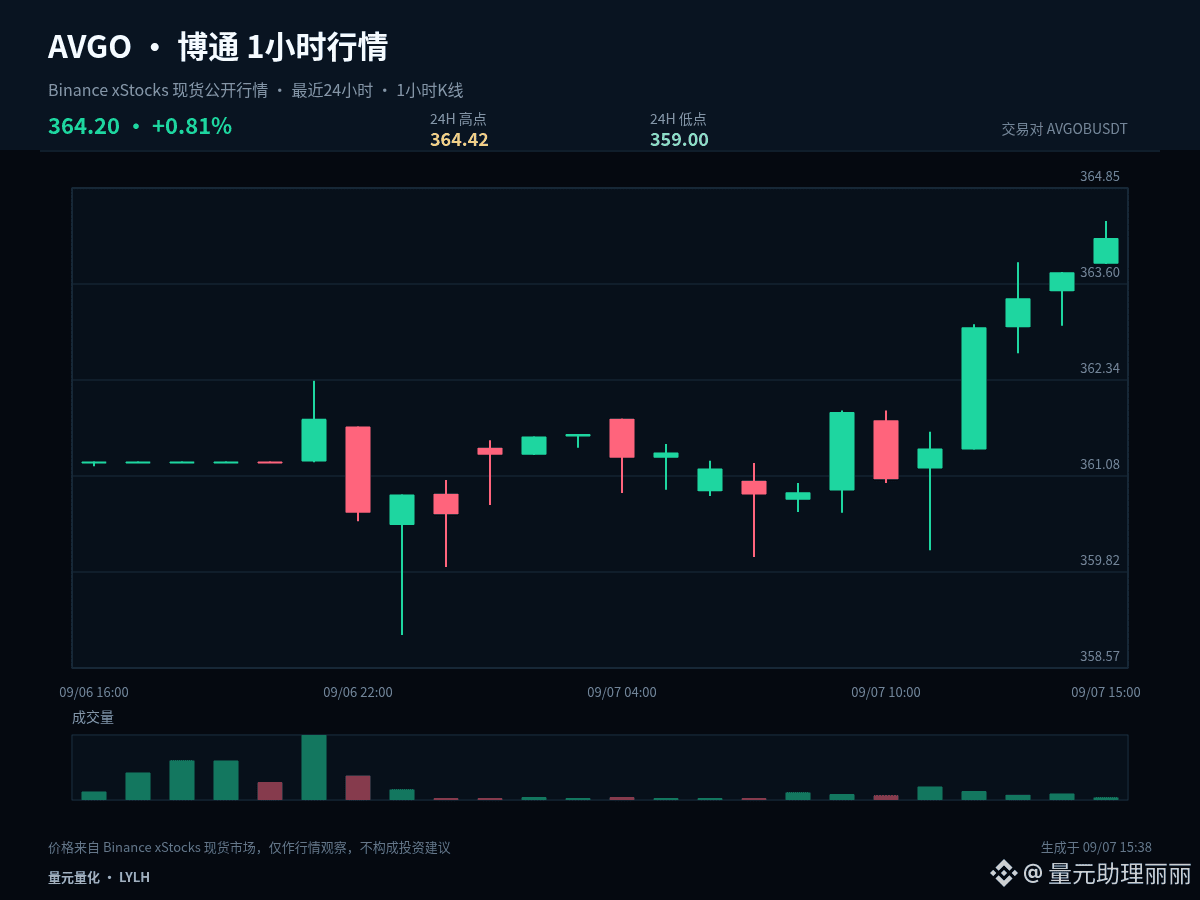

$AVGOB #AVGO is still repeatedly changing hands within the past 24-hour range, and the directional advantage is not obvious. The middle of the range is the hardest test of patience; waiting for boundary signals is usually more effective.
At present, the 1-hour change is +0.05% and the 24-hour change is +0.10%. The two timeframes have not formed a sufficiently clear aligned move. In range-bound markets, chasing strength or selling weakness has a low margin for error. It is better to use the upper boundary to confirm direction, the lower boundary to confirm support, and the midline only as the dividing line between strength and weakness.
As for key levels, 360.665 is the current structural midline and also the first standard for judging whether a pullback is healthy. As long as price can stay stably above it, bulls still retain the initiative, with 362.33 as the first upside target. If price falls back below the midline, attention should shift to secondary support at 359.
The subsequent path can be handled in three ways: if price breaks above and holds 362.33 effectively, wait for a pullback that does not break down before reassessing continuation; if it falls below 359, prioritize risk control and wait for new support; if it continues to fluctuate around 360.665, treat it as range turnover and avoid repeatedly chasing direction in the middle of the range.
Existing positions can be managed in stages according to the key levels, avoiding making all judgments at once; those with no positions should wait for a breakout confirmation or a successful stabilization on a pullback. For U.S. stock related symbols, also pay attention to volatility brought by trading session changes. The plan should be based on price conditions, not emotion.
Risk control still comes before the conclusion: act only when conditions appear, and re-evaluate promptly when price invalidates the setup; the greater the volatility, the more restrained each position size should be. The above is a market interpretation based on the current 1-hour and 24-hour data and does not constitute a promise of returns.
#USStrikesIranTankersTehranRestrictsHormuz
At present, the 1-hour change is +0.05% and the 24-hour change is +0.10%. The two timeframes have not formed a sufficiently clear aligned move. In range-bound markets, chasing strength or selling weakness has a low margin for error. It is better to use the upper boundary to confirm direction, the lower boundary to confirm support, and the midline only as the dividing line between strength and weakness.
As for key levels, 360.665 is the current structural midline and also the first standard for judging whether a pullback is healthy. As long as price can stay stably above it, bulls still retain the initiative, with 362.33 as the first upside target. If price falls back below the midline, attention should shift to secondary support at 359.
The subsequent path can be handled in three ways: if price breaks above and holds 362.33 effectively, wait for a pullback that does not break down before reassessing continuation; if it falls below 359, prioritize risk control and wait for new support; if it continues to fluctuate around 360.665, treat it as range turnover and avoid repeatedly chasing direction in the middle of the range.
Existing positions can be managed in stages according to the key levels, avoiding making all judgments at once; those with no positions should wait for a breakout confirmation or a successful stabilization on a pullback. For U.S. stock related symbols, also pay attention to volatility brought by trading session changes. The plan should be based on price conditions, not emotion.
Risk control still comes before the conclusion: act only when conditions appear, and re-evaluate promptly when price invalidates the setup; the greater the volatility, the more restrained each position size should be. The above is a market interpretation based on the current 1-hour and 24-hour data and does not constitute a promise of returns.
#USStrikesIranTankersTehranRestrictsHormuz
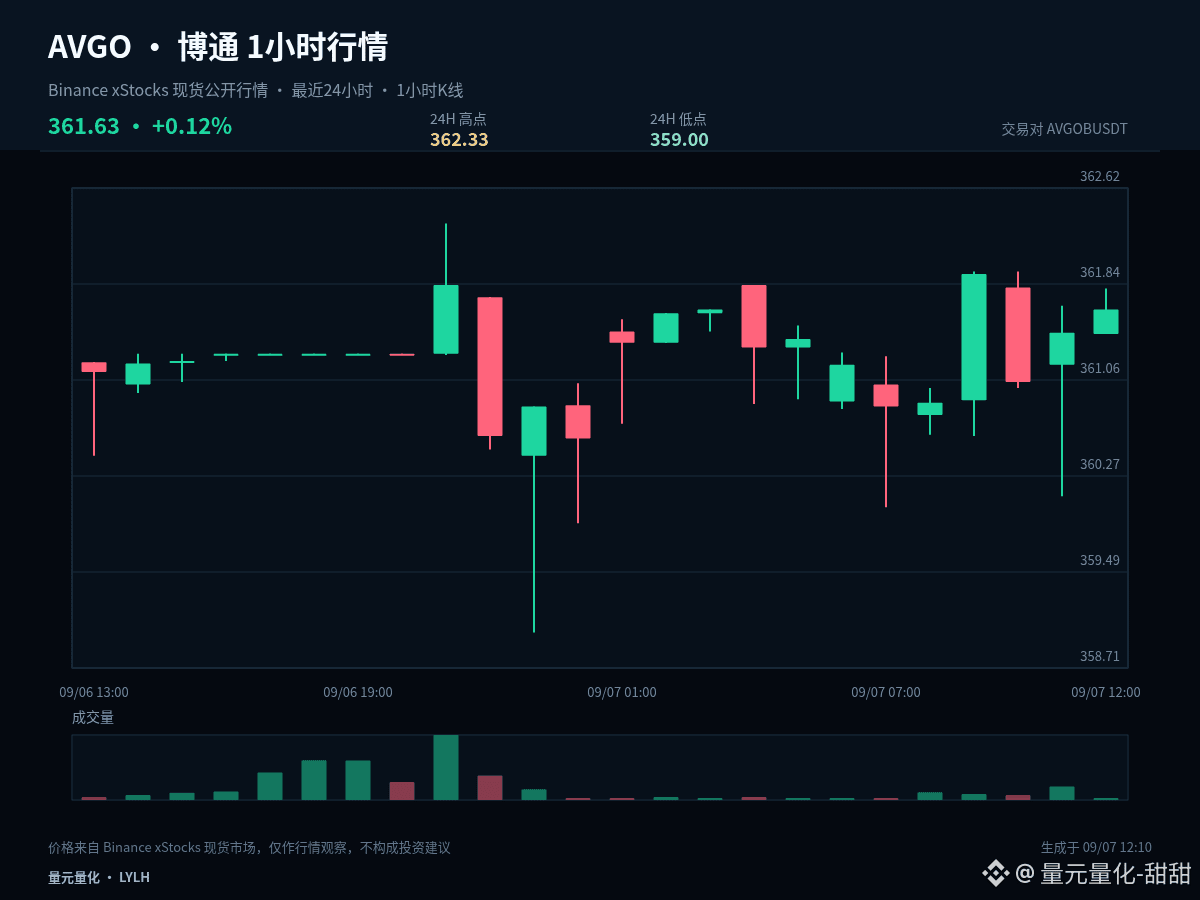

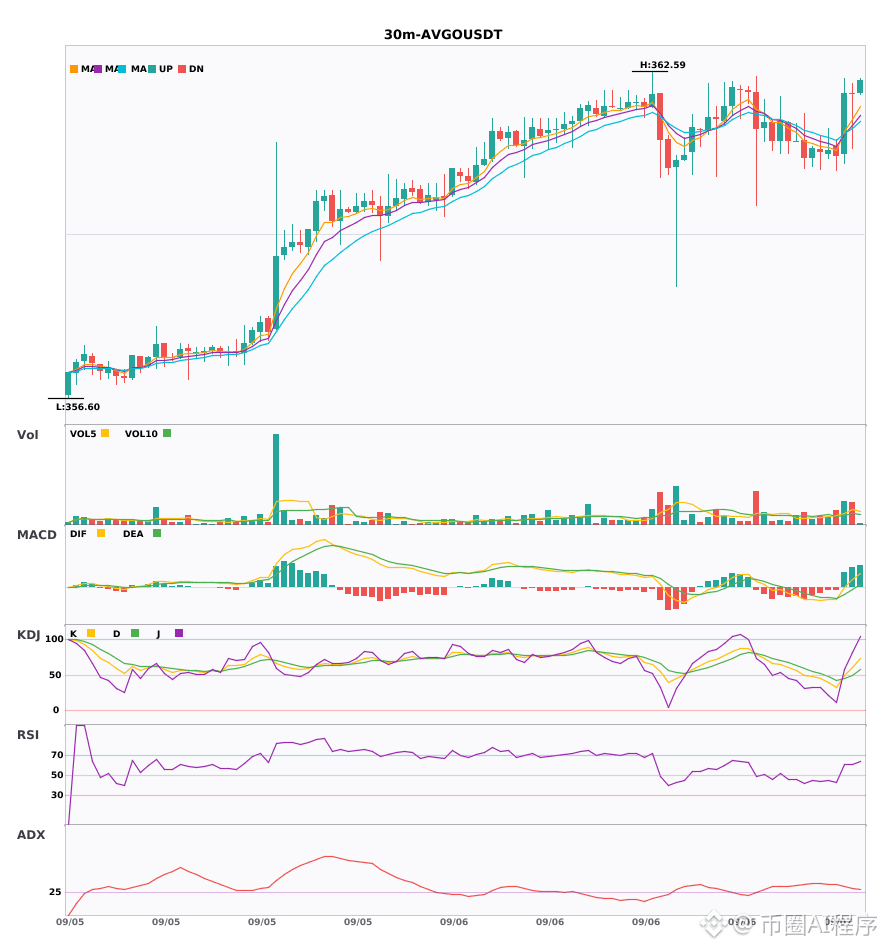
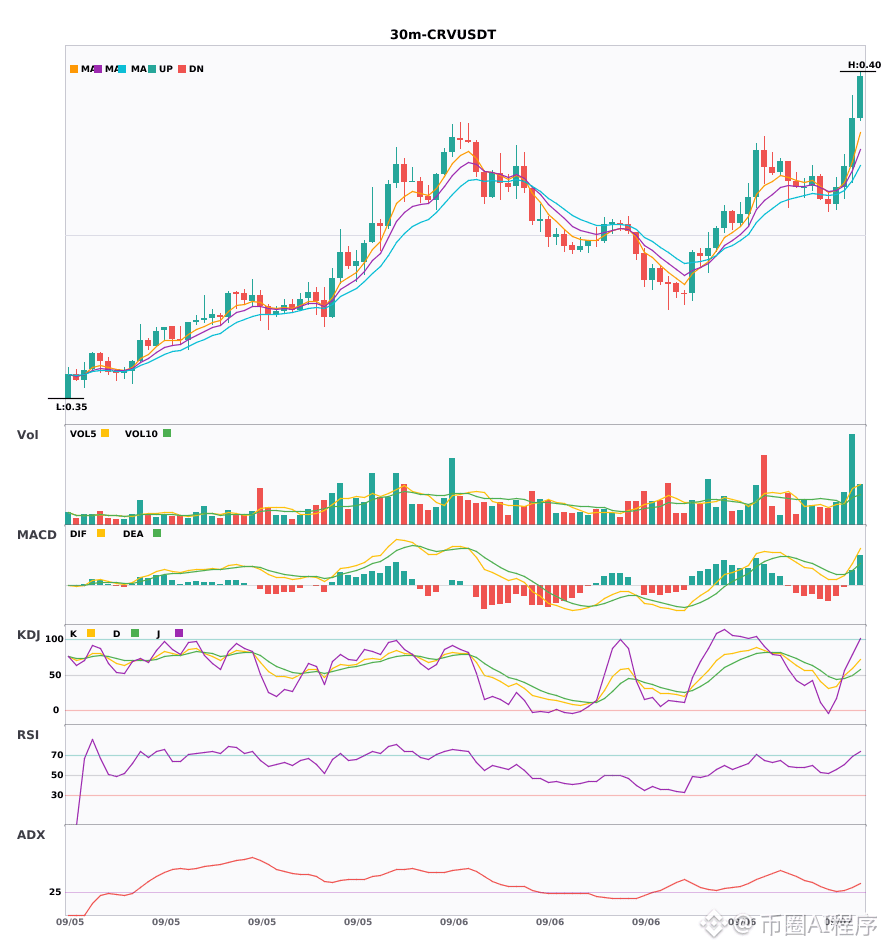
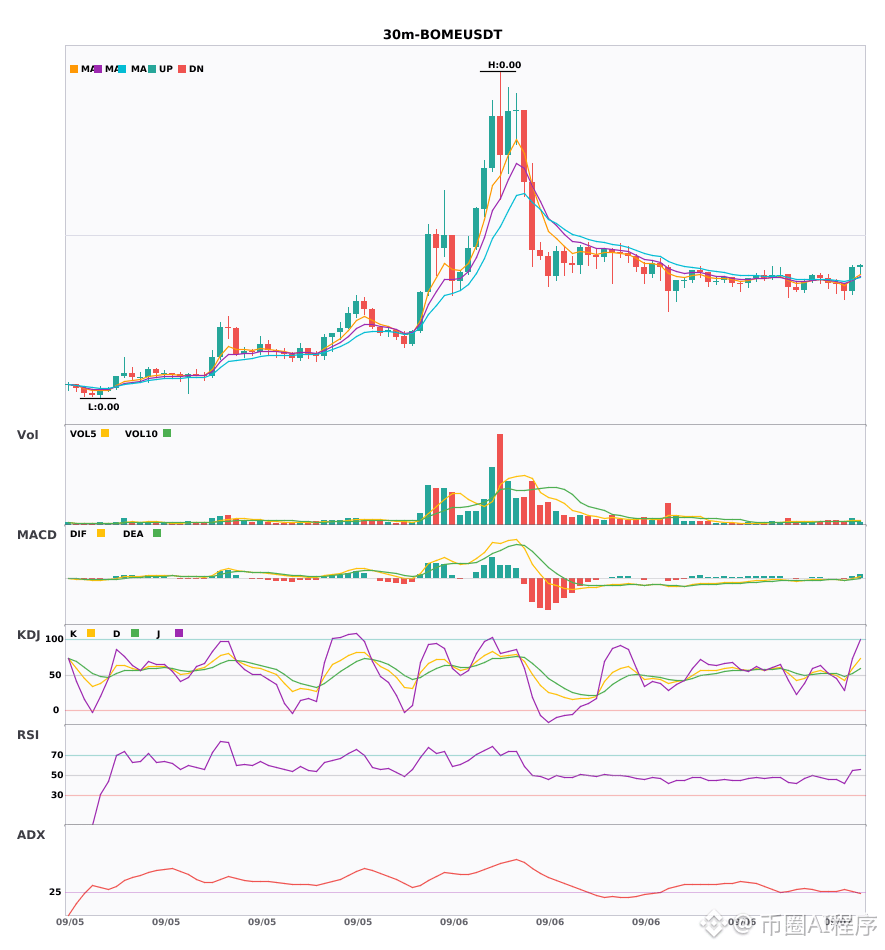
$AVGO 30-minute MACD golden cross with increasing volume, 4-hour moving averages in bullish alignment and diverging upward, $CRV $BOME rising in sync 🔥
════════════════════
🔴 $AVGO 30-minute Bullish Signal
⚠️Technicals: The 4-hour trend is bullish, and the 30-minute chart is following suit! MACD golden cross above the zero line, red histogram expanding, strong bullish momentum; the 5-day moving average crosses above the 8-day moving average, showing short-term strength; KDJ golden cross but not yet overbought, still has room to rise; volume has directly increased 2.5x, indicating clear capital inflow, with multiple timeframes resonating together — the signal looks quite reliable.
════════════════════
🔴 $CRV 30-minute Bullish Signal
⚠️Technicals: The 4-hour overall trend is confirmed bullish, and a buy point has appeared on the 30-minute chart — MACD golden cross above the zero line with increasing volume, red histogram continuing to expand; moving averages are in bullish alignment and diverging upward; volume has increased 3.3x, a multi-timeframe resonance signal.
════════════════════
🔴 $BOME 30-minute Bullish Signal
⚠️Technicals: The 4-hour overall trend is confirmed bullish, and the 30-minute MACD golden cross above the zero line is accompanied by increasing volume and a longer red histogram; EMA5 has just crossed above EMA8, forming a short-term bullish alignment; KDJ golden cross is not yet overbought, and volume has also increased 1.6x, a multi-timeframe resonance entry signal.
════════════════════
🔔 Follow for the latest market moves first-hand 🔔
#多周期共振 #AVGO #CRV #BOME
📌 When trading, pay attention to whether the candlestick patterns are in line
════════════════════
🔴 $AVGO 30-minute Bullish Signal
⚠️Technicals: The 4-hour trend is bullish, and the 30-minute chart is following suit! MACD golden cross above the zero line, red histogram expanding, strong bullish momentum; the 5-day moving average crosses above the 8-day moving average, showing short-term strength; KDJ golden cross but not yet overbought, still has room to rise; volume has directly increased 2.5x, indicating clear capital inflow, with multiple timeframes resonating together — the signal looks quite reliable.
════════════════════
🔴 $CRV 30-minute Bullish Signal
⚠️Technicals: The 4-hour overall trend is confirmed bullish, and a buy point has appeared on the 30-minute chart — MACD golden cross above the zero line with increasing volume, red histogram continuing to expand; moving averages are in bullish alignment and diverging upward; volume has increased 3.3x, a multi-timeframe resonance signal.
════════════════════
🔴 $BOME 30-minute Bullish Signal
⚠️Technicals: The 4-hour overall trend is confirmed bullish, and the 30-minute MACD golden cross above the zero line is accompanied by increasing volume and a longer red histogram; EMA5 has just crossed above EMA8, forming a short-term bullish alignment; KDJ golden cross is not yet overbought, and volume has also increased 1.6x, a multi-timeframe resonance entry signal.
════════════════════
🔔 Follow for the latest market moves first-hand 🔔
#多周期共振 #AVGO #CRV #BOME
📌 When trading, pay attention to whether the candlestick patterns are in line
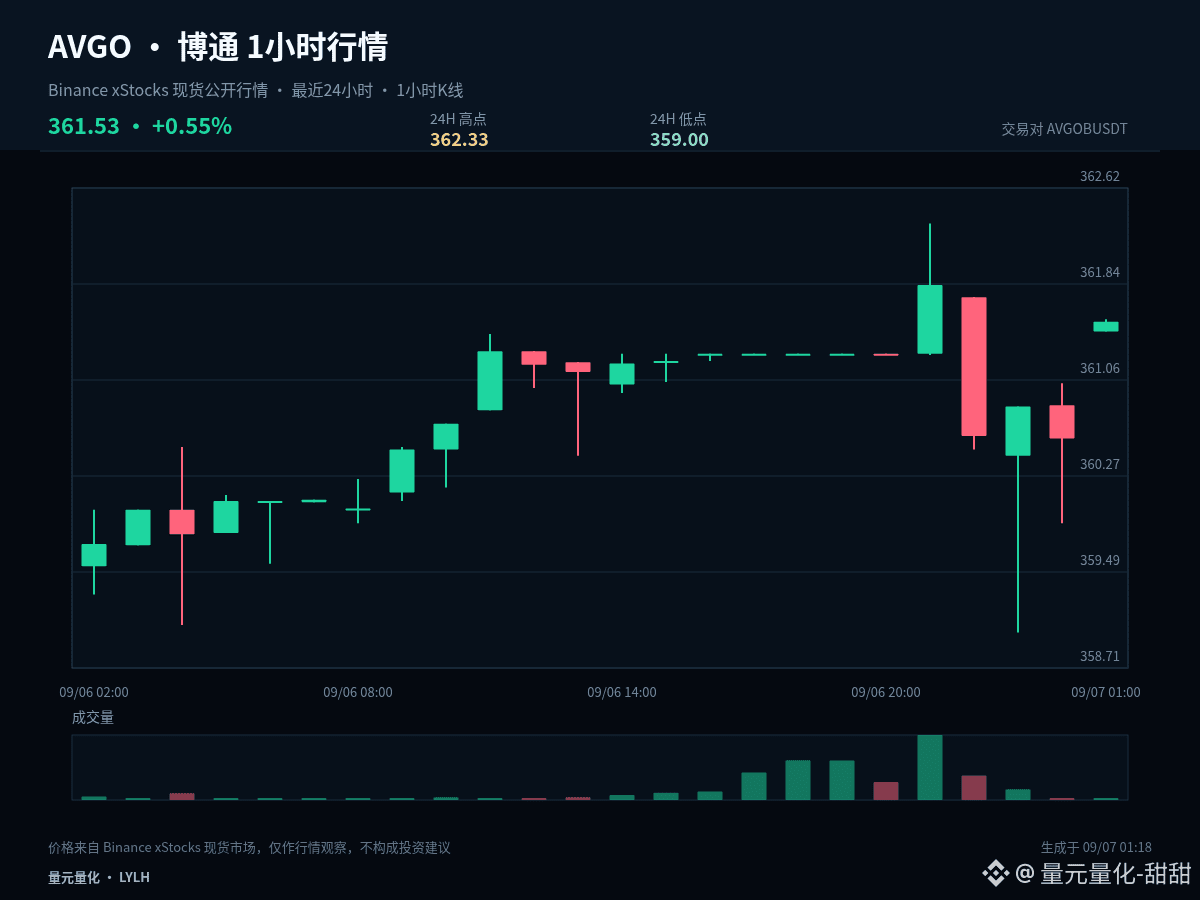
$AVGOB #AVGO If I had to keep only one observation price this round, I would choose 360.665. The current price is 361.53, with 1 hour +0.26% and 24 hours +0.43%. The midline can help filter out a lot of intraday noise.
As long as the price stays above 360.665, it shows that the pullback is still being controlled by the bulls, and the next target is to test the resistance at 362.33. If it falls back below the midline again, the strength just mentioned will be discounted, and we should guard against a further move back to 359.
The current 1 hour +0.26% and 24 hours +0.43% show that the two timeframes have not yet formed a sufficiently clear alignment in the same direction. In a range-bound market, chasing strength or selling weakness has lower tolerance for error. It is more suitable to use the upper boundary to confirm direction, the lower boundary to confirm support, and the midline only as the dividing line between strength and weakness.
The follow-up path can be handled in three ways: if it effectively holds above 362.33, wait for a pullback that does not break down before assessing continuation; if it falls below 359, prioritize risk control and wait for new support; if it continues to fluctuate around 360.665, treat it as range rotation and do not repeatedly chase direction in the middle of the range.
Existing positions can be managed in stages based on key levels to avoid making all decisions at once; those without positions should wait for a breakout confirmation or a successful pullback hold. For U.S. stocks, also pay attention to volatility caused by trading session changes. The plan should be based on price conditions, not emotions.
The real divergence in this move is whether it continues or returns to the range. Will you wait for breakout confirmation, or for a support retest? Share the price level you care about most.
#ZECHitsANewAllTimeHigh
As long as the price stays above 360.665, it shows that the pullback is still being controlled by the bulls, and the next target is to test the resistance at 362.33. If it falls back below the midline again, the strength just mentioned will be discounted, and we should guard against a further move back to 359.
The current 1 hour +0.26% and 24 hours +0.43% show that the two timeframes have not yet formed a sufficiently clear alignment in the same direction. In a range-bound market, chasing strength or selling weakness has lower tolerance for error. It is more suitable to use the upper boundary to confirm direction, the lower boundary to confirm support, and the midline only as the dividing line between strength and weakness.
The follow-up path can be handled in three ways: if it effectively holds above 362.33, wait for a pullback that does not break down before assessing continuation; if it falls below 359, prioritize risk control and wait for new support; if it continues to fluctuate around 360.665, treat it as range rotation and do not repeatedly chase direction in the middle of the range.
Existing positions can be managed in stages based on key levels to avoid making all decisions at once; those without positions should wait for a breakout confirmation or a successful pullback hold. For U.S. stocks, also pay attention to volatility caused by trading session changes. The plan should be based on price conditions, not emotions.
The real divergence in this move is whether it continues or returns to the range. Will you wait for breakout confirmation, or for a support retest? Share the price level you care about most.
#ZECHitsANewAllTimeHigh

$AVGO spot is 361.91, up 1.25% over the past 24 hours. The funding rate is zero, and open interest is 61,000 contracts. Looking only at the derivatives data, the price is ticking up a little, longs and shorts are balanced, and open interest is lukewarm — like a stock with no story.
But on-chain U.S. equity derivatives cannot be judged only on-chain. What I’m watching is the line between Sun Yuchen and the EU sanctions on HTX. He himself said he would keep building amid complex geopolitical and financial conditions. Now the EU has moved, placing operators like HTX under regulatory control. The sanctions are not a direct strike at Sun Yuchen; they are aimed at the exchange channels associated with him. When trading channels are choked off, part of the cross-border liquidity in crypto markets gets squeezed, especially during Asian trading hours.
When liquidity tightens, the first to suffer are high-valuation growth stocks. Semiconductors are one of the most crowded trades, and names like $AVGO are extremely sensitive to liquidity. The EU sanctions on HTX are, on the surface, a regulatory event, but underneath they reflect geopolitical maneuvering and a systematic tightening of crypto channels. That will transmit into the pricing of all risk assets. Funding rate at zero means neither bulls nor bears dare to move recklessly right now. But open interest has not dropped sharply, which means everyone at the table is waiting. Waiting for what? Waiting for the actual shockwave from the sanctions, waiting for the first liquidation that can’t be absorbed.
The strongest bearish counterargument is this: the EU sanctions target exchange entities, not the semiconductor industry directly, so $AVGO ’s fundamentals have not changed. That is correct, but it ignores that the market is an emotion machine. Once the narrative of crypto liquidity hubs being choked off takes hold, panic can spread indiscriminately. On-chain derivatives traders are, by nature, among the highest-risk-appetite participants, and they will retreat faster than traditional stock investors.
The second-order impact is that exchanges and project teams are forced to rebalance. Funds linked to Sun Yuchen may need to find new channels or new strategies, and that process creates friction costs. Meanwhile, if $AVGO market makers and hedge funds also use crypto channels for hedging or cross-border settlement, their operating costs could suddenly rise. As costs go up, liquidity provision contracts immediately. When liquidity contracts, high-beta assets turn first.
My invalidation condition is very specific: if $AVGO can hold above 365, and open interest breaks above 70,000 contracts within three days, that would mean independent capital is absorbing the move against the trend, and the geopolitical drag is being isolated. At that point I’d admit I was wrong and close the short. Right now the price is stuck below 362 and open interest has not picked up, so on a single-signal basis the bias remains bearish.
Trading tag: #TradFi #链上美股 #AVGO
Where do you think this judgment is most likely to be wrong?
But on-chain U.S. equity derivatives cannot be judged only on-chain. What I’m watching is the line between Sun Yuchen and the EU sanctions on HTX. He himself said he would keep building amid complex geopolitical and financial conditions. Now the EU has moved, placing operators like HTX under regulatory control. The sanctions are not a direct strike at Sun Yuchen; they are aimed at the exchange channels associated with him. When trading channels are choked off, part of the cross-border liquidity in crypto markets gets squeezed, especially during Asian trading hours.
When liquidity tightens, the first to suffer are high-valuation growth stocks. Semiconductors are one of the most crowded trades, and names like $AVGO are extremely sensitive to liquidity. The EU sanctions on HTX are, on the surface, a regulatory event, but underneath they reflect geopolitical maneuvering and a systematic tightening of crypto channels. That will transmit into the pricing of all risk assets. Funding rate at zero means neither bulls nor bears dare to move recklessly right now. But open interest has not dropped sharply, which means everyone at the table is waiting. Waiting for what? Waiting for the actual shockwave from the sanctions, waiting for the first liquidation that can’t be absorbed.
The strongest bearish counterargument is this: the EU sanctions target exchange entities, not the semiconductor industry directly, so $AVGO ’s fundamentals have not changed. That is correct, but it ignores that the market is an emotion machine. Once the narrative of crypto liquidity hubs being choked off takes hold, panic can spread indiscriminately. On-chain derivatives traders are, by nature, among the highest-risk-appetite participants, and they will retreat faster than traditional stock investors.
The second-order impact is that exchanges and project teams are forced to rebalance. Funds linked to Sun Yuchen may need to find new channels or new strategies, and that process creates friction costs. Meanwhile, if $AVGO market makers and hedge funds also use crypto channels for hedging or cross-border settlement, their operating costs could suddenly rise. As costs go up, liquidity provision contracts immediately. When liquidity contracts, high-beta assets turn first.
My invalidation condition is very specific: if $AVGO can hold above 365, and open interest breaks above 70,000 contracts within three days, that would mean independent capital is absorbing the move against the trend, and the geopolitical drag is being isolated. At that point I’d admit I was wrong and close the short. Right now the price is stuck below 362 and open interest has not picked up, so on a single-signal basis the bias remains bearish.
Trading tag: #TradFi #链上美股 #AVGO
Where do you think this judgment is most likely to be wrong?
W9797:
大哥周末哪来的流动性

🚨 $AVGO PREPARES FOR HEAVY LIQUIDATION BREAKDOWN AS DEMAND EXHAUSTS! 📉
Entry: 360.79 ⚡
Target: 356.00 🎯
Stop Loss: 365.00 ⚠️
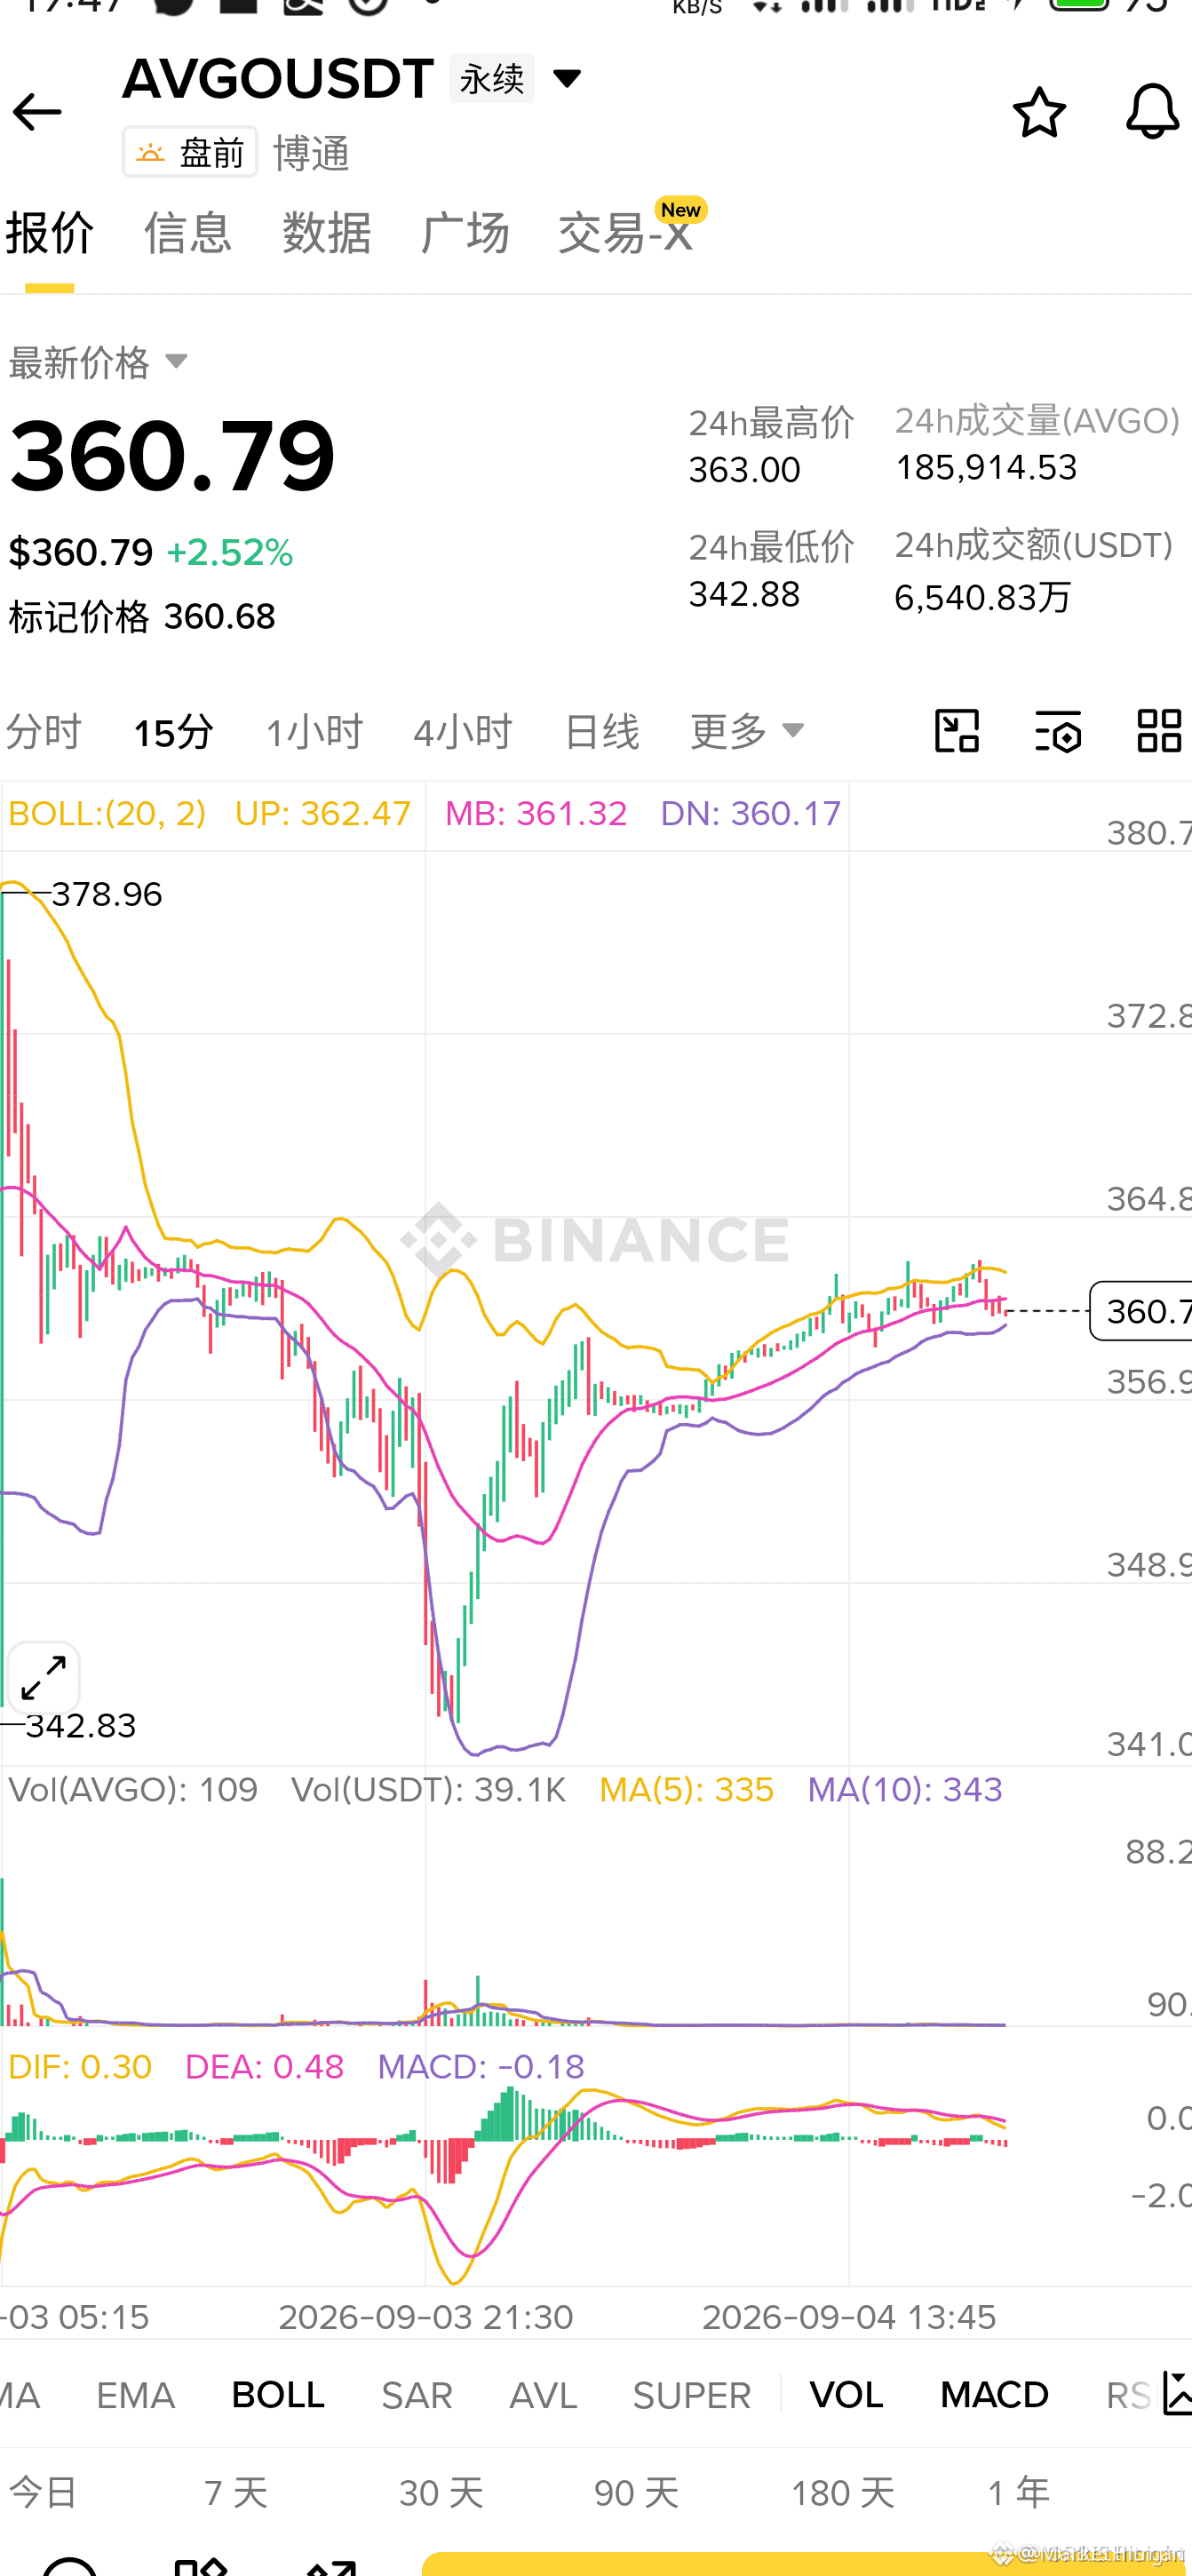
📌 Repeated supply rejections near 362 confirm heavy institutional distribution, while buy-side volume contracts sharply into key support. 📊 A fresh MACD bearish crossover confirms momentum is shifting firmly to sellers as order flow exhausts.
🔍 A decisive structural breach below the 360 pivot opens a rapid liquidity vacuum down toward the 356.00 inefficiency target. 💬 Are you shorting this structural breakdown or waiting for one last sweep into supply? 👇
⚠️ Not financial advice. Always manage your risk. 🛡️
🏷️ #AVGO #ShortSetup #Breakdown #Trading
🔴 📉
Entry: 360.79 ⚡
Target: 356.00 🎯
Stop Loss: 365.00 ⚠️
📌 Repeated supply rejections near 362 confirm heavy institutional distribution, while buy-side volume contracts sharply into key support. 📊 A fresh MACD bearish crossover confirms momentum is shifting firmly to sellers as order flow exhausts.
🔍 A decisive structural breach below the 360 pivot opens a rapid liquidity vacuum down toward the 356.00 inefficiency target. 💬 Are you shorting this structural breakdown or waiting for one last sweep into supply? 👇
⚠️ Not financial advice. Always manage your risk. 🛡️
🏷️ #AVGO #ShortSetup #Breakdown #Trading
🔴 📉
$AVGO 24-hour rise of 1.253%, which looks mild. But the funding rate is 0, and open interest is 61,000 contracts. From a political and military events perspective, there is currently no specific conflict news, but the semiconductor sector always lives under the muzzle of geopolitical risk.
My judgment: this kind of low-volatility, zero-funding, moderate-position structure is actually an opportunity to short volatility in semiconductor stocks. The market has not priced in the risk, and positions are not crowded, which is exactly the time to lay out a counter-position for a geopolitical shock.
Evidence chain: the price is up slightly, and the funding rate is flat at zero, indicating that longs are not blindly chasing higher and no crowded consensus has formed. Open interest has not expanded significantly, reflecting that big money is waiting on the sidelines. This is a single-signal judgment, calmly made based on the current position structure. Political and military events have a very direct impact path on semiconductor stocks: trade embargoes, technology blockades, supply-chain disruptions—any one of these can instantly change AVGO's fundamental valuation model.
The strongest opposing view is that semiconductor self-sufficiency and controllability are national policies everywhere, and geopolitical tensions will only accelerate domestic procurement, so AVGO, as a leader, would benefit instead. But this logic ignores one cost: the initial phase of global supply-chain restructuring will inevitably come with lower efficiency and soaring costs, and orders will not shift immediately. The second-order effect is that if substantive sanctions really materialize, the revenue loss from being excluded from certain markets is immediate, while replacement orders take time to land. The market always likes to linearly extrapolate policy tailwinds, while turning a blind eye to execution friction.
Invalidation condition: if within the next two weeks there is a clear geopolitical positive catalyst, such as a major economy announcing large-scale subsidies or procurement for the semiconductor industry, and AVGO's price breaks out of the current narrow range with volume, then my short thesis becomes invalid. The current price of 361.91 is the recent consolidation center; a break below 355 may trigger technical stop-loss selling.
Action: I will try a small short around the current price of 361, with leverage no more than 3x. Stop loss is set at 367, which is the recent local high; a breakout would mean short-term momentum has turned. First take-profit target is 350, and if it breaks below that, then 340. Position size will be kept within 5% of total capital, after all this is a short based on political and military uncertainty, so the position must be light.
If the price moves sideways around 360 for half a month and there is no geopolitical development, I will close the position and move on; I won't waste time cost.
Aggressive approach: short 3x at current price, stop at 367, betting on a geopolitical black swan.
Trade tag: #TradFi #链上美股 #AVGO
Where do you think this thesis is most likely wrong?
My judgment: this kind of low-volatility, zero-funding, moderate-position structure is actually an opportunity to short volatility in semiconductor stocks. The market has not priced in the risk, and positions are not crowded, which is exactly the time to lay out a counter-position for a geopolitical shock.
Evidence chain: the price is up slightly, and the funding rate is flat at zero, indicating that longs are not blindly chasing higher and no crowded consensus has formed. Open interest has not expanded significantly, reflecting that big money is waiting on the sidelines. This is a single-signal judgment, calmly made based on the current position structure. Political and military events have a very direct impact path on semiconductor stocks: trade embargoes, technology blockades, supply-chain disruptions—any one of these can instantly change AVGO's fundamental valuation model.
The strongest opposing view is that semiconductor self-sufficiency and controllability are national policies everywhere, and geopolitical tensions will only accelerate domestic procurement, so AVGO, as a leader, would benefit instead. But this logic ignores one cost: the initial phase of global supply-chain restructuring will inevitably come with lower efficiency and soaring costs, and orders will not shift immediately. The second-order effect is that if substantive sanctions really materialize, the revenue loss from being excluded from certain markets is immediate, while replacement orders take time to land. The market always likes to linearly extrapolate policy tailwinds, while turning a blind eye to execution friction.
Invalidation condition: if within the next two weeks there is a clear geopolitical positive catalyst, such as a major economy announcing large-scale subsidies or procurement for the semiconductor industry, and AVGO's price breaks out of the current narrow range with volume, then my short thesis becomes invalid. The current price of 361.91 is the recent consolidation center; a break below 355 may trigger technical stop-loss selling.
Action: I will try a small short around the current price of 361, with leverage no more than 3x. Stop loss is set at 367, which is the recent local high; a breakout would mean short-term momentum has turned. First take-profit target is 350, and if it breaks below that, then 340. Position size will be kept within 5% of total capital, after all this is a short based on political and military uncertainty, so the position must be light.
If the price moves sideways around 360 for half a month and there is no geopolitical development, I will close the position and move on; I won't waste time cost.
Aggressive approach: short 3x at current price, stop at 367, betting on a geopolitical black swan.
Trade tag: #TradFi #链上美股 #AVGO
Where do you think this thesis is most likely wrong?
The price of $AVGO is pinned at 361.9, up 1.253% over the past 24 hours. Funding has gone to zero, and open interest is just over 60,000. Put those three numbers together, and the surface looks as calm as a weekend lake.
But something is hiding beneath that calm. As a leading semiconductor name, $AVGO has never been valued on pure market trading alone; it carries two hard layers: the arms race for AI data centers, and supply chain restructuring under geopolitical pressure. When funding goes to zero, it means both longs and shorts are waiting. Waiting for what? Waiting for an event to break the balance and force one side to surrender. Right now price is inching up, but funding hasn’t followed. That’s a classic sign of insufficient one-way bullish momentum — longs have not been able to make shorts pay any cost.
Political and military events affect semiconductors in a very direct way. When tensions escalate, the first reaction is to rush into defense stocks; the second is to realize chips are the foundation of military technology and need to be stockpiled. History does not simply repeat, but the pattern is clear: during a certain period in 2022, geopolitical friction intensified, the semiconductor sector first fell and then rose, with the early phase driven by risk-off selling and the later phase by valuation rerating under the logic of supply-chain security. Now $AVGO ’s open interest is stuck at 60,000 while the price is slowly moving higher. That doesn’t look like panic accumulation; it looks more like patient capital gradually building a position, betting that the second reaction will arrive late, but not fail to arrive.
My view is that the market is trading an option with spot-like thinking. $AVGO has become a call option on geopolitical risk in the semiconductor industry, but at the current price, the value of that option is almost zero. The zero funding rate supports that. No one is willing to pay a premium for the bullish side, and no one dares to short aggressively either. Everyone is waiting for a catalyst. What is the strongest counterargument? Simply that this time the wolf may not come. If major economies suddenly ease chip controls, or if military tensions fade without consequence, that geopolitical premium logic collapses instantly, and the price will quickly fall back into a range driven purely by rates and demand.
The second-order effects are already clear. Once a catalyst appears, shorts will be the first to get squeezed. Since they are currently holding positions for free, any whiff of trouble will force them to cover, pushing prices higher. At the same time, the money flowing into defense names will realize that pure defense stocks have limited elasticity, while semiconductor names like $AVGO , which have real defense-related demand, will become a more favored leveraged vehicle.
So the move is clear: do nothing for now.
Trading tag: #TradFi #链上美股 #AVGO
Where do you think this whole line of reasoning is most likely to be wrong?
But something is hiding beneath that calm. As a leading semiconductor name, $AVGO has never been valued on pure market trading alone; it carries two hard layers: the arms race for AI data centers, and supply chain restructuring under geopolitical pressure. When funding goes to zero, it means both longs and shorts are waiting. Waiting for what? Waiting for an event to break the balance and force one side to surrender. Right now price is inching up, but funding hasn’t followed. That’s a classic sign of insufficient one-way bullish momentum — longs have not been able to make shorts pay any cost.
Political and military events affect semiconductors in a very direct way. When tensions escalate, the first reaction is to rush into defense stocks; the second is to realize chips are the foundation of military technology and need to be stockpiled. History does not simply repeat, but the pattern is clear: during a certain period in 2022, geopolitical friction intensified, the semiconductor sector first fell and then rose, with the early phase driven by risk-off selling and the later phase by valuation rerating under the logic of supply-chain security. Now $AVGO ’s open interest is stuck at 60,000 while the price is slowly moving higher. That doesn’t look like panic accumulation; it looks more like patient capital gradually building a position, betting that the second reaction will arrive late, but not fail to arrive.
My view is that the market is trading an option with spot-like thinking. $AVGO has become a call option on geopolitical risk in the semiconductor industry, but at the current price, the value of that option is almost zero. The zero funding rate supports that. No one is willing to pay a premium for the bullish side, and no one dares to short aggressively either. Everyone is waiting for a catalyst. What is the strongest counterargument? Simply that this time the wolf may not come. If major economies suddenly ease chip controls, or if military tensions fade without consequence, that geopolitical premium logic collapses instantly, and the price will quickly fall back into a range driven purely by rates and demand.
The second-order effects are already clear. Once a catalyst appears, shorts will be the first to get squeezed. Since they are currently holding positions for free, any whiff of trouble will force them to cover, pushing prices higher. At the same time, the money flowing into defense names will realize that pure defense stocks have limited elasticity, while semiconductor names like $AVGO , which have real defense-related demand, will become a more favored leveraged vehicle.
So the move is clear: do nothing for now.
Trading tag: #TradFi #链上美股 #AVGO
Where do you think this whole line of reasoning is most likely to be wrong?

Setting up for a potential leg down on $AVGO as a new short play hits our radar.
⚡ $AVGO — SHORT SETUP
📍 Entry: 361.62 – 363.78
🎯 TP1: 357.3
🎯 TP2: 354.42
🎯 TP3: 350.09
🛑 Stop Loss: 365.94
Trade here 👇
📌 Trade management rules: see pinned post.
Are you trading this range, or waiting on the sidelines? Follow for more clean setups!
#WriteToEarn #AVGO #CryptoTrading #BinanceSquare #Crypto
⚡ $AVGO — SHORT SETUP
📍 Entry: 361.62 – 363.78
🎯 TP1: 357.3
🎯 TP2: 354.42
🎯 TP3: 350.09
🛑 Stop Loss: 365.94
Trade here 👇
📌 Trade management rules: see pinned post.
Are you trading this range, or waiting on the sidelines? Follow for more clean setups!
#WriteToEarn #AVGO #CryptoTrading #BinanceSquare #Crypto
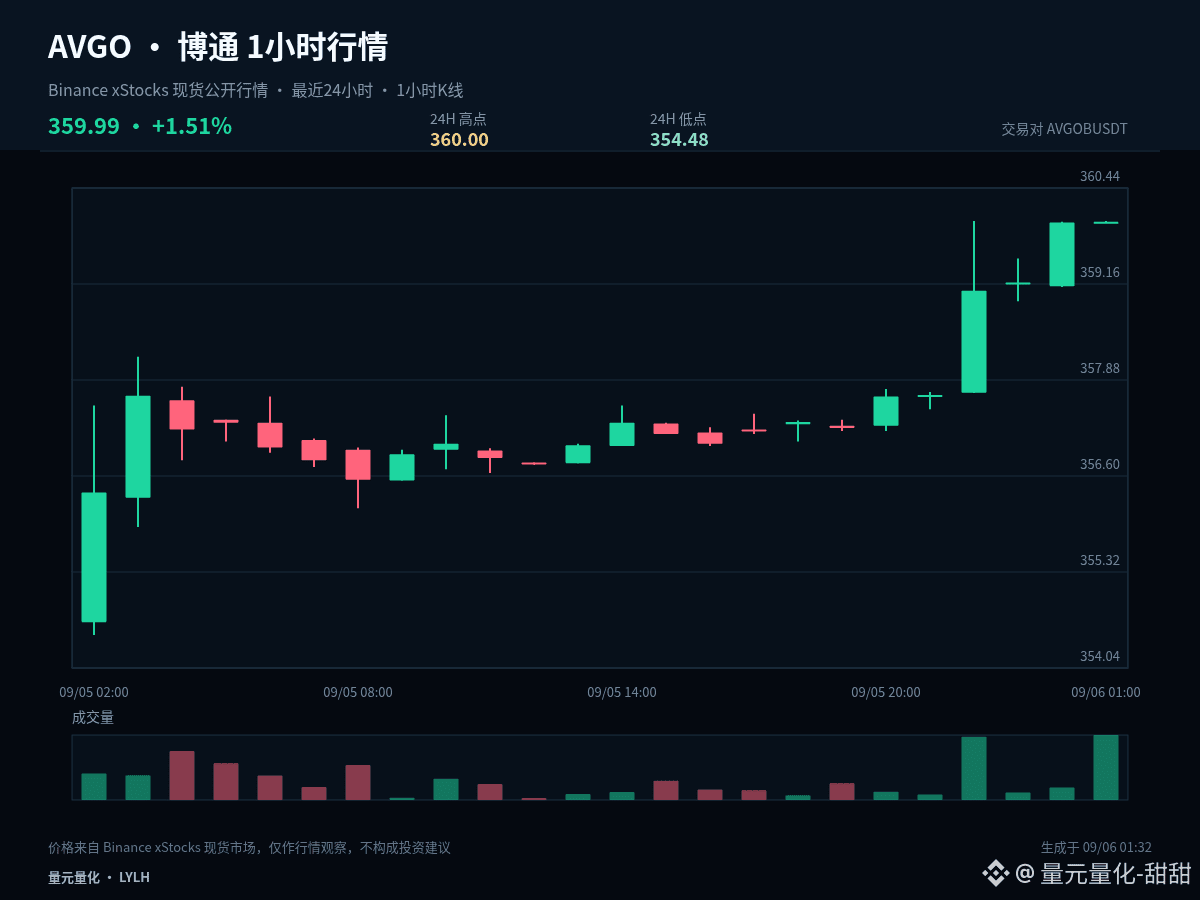
$AVGOB #AVGO This time, let’s break it down from a position-holding perspective. On the same chart, the key points seen by an existing position and by a flat position are different; current price is 359.99, 1-hour +0.00%, 24-hour +1.55%.
The current price is close to the upper end of the recent 24-hour range, with 1-hour +0.00% and 24-hour +1.55%. At elevated levels, the most important thing is to confirm acceptance after the breakout: if price can stay above the upper band, it shows the market recognizes a higher range; if it only briefly pierces through and then quickly retreats, watch out for a false breakout.
For existing positions, first observe whether there is repeated resistance around 360, and use 357.24 as the protective structure; for flat positions, do not chase near resistance. Wait for support after a pullback to the midline, or for a second confirmation after a breakout above resistance.
In execution, set clear conditions: after breaking above 360, confirmation is needed, rather than chasing a sudden surge; after dipping below 354.48, see whether it can quickly recover, rather than blindly buying on every drop; in the middle range, if there is not enough risk-reward, waiting is also part of the strategy.
Existing positions can be managed in stages according to key levels, avoiding making all decisions at once; flat traders should wait for breakout confirmation or a successful retest and stabilization. For U.S. stocks, also pay attention to volatility caused by session changes; the plan should be based on price conditions, not emotions replacing execution.
A trading plan must include invalidation conditions. If the judgment is right, profits can be taken in stages; if the judgment is wrong, allow yourself to exit, and do not use adding to a position to cover up the fact that the original logic has already changed. The market will keep updating, and opinions should also adjust with price evidence.
#ZECHitsANewAllTimeHigh
The current price is close to the upper end of the recent 24-hour range, with 1-hour +0.00% and 24-hour +1.55%. At elevated levels, the most important thing is to confirm acceptance after the breakout: if price can stay above the upper band, it shows the market recognizes a higher range; if it only briefly pierces through and then quickly retreats, watch out for a false breakout.
For existing positions, first observe whether there is repeated resistance around 360, and use 357.24 as the protective structure; for flat positions, do not chase near resistance. Wait for support after a pullback to the midline, or for a second confirmation after a breakout above resistance.
In execution, set clear conditions: after breaking above 360, confirmation is needed, rather than chasing a sudden surge; after dipping below 354.48, see whether it can quickly recover, rather than blindly buying on every drop; in the middle range, if there is not enough risk-reward, waiting is also part of the strategy.
Existing positions can be managed in stages according to key levels, avoiding making all decisions at once; flat traders should wait for breakout confirmation or a successful retest and stabilization. For U.S. stocks, also pay attention to volatility caused by session changes; the plan should be based on price conditions, not emotions replacing execution.
A trading plan must include invalidation conditions. If the judgment is right, profits can be taken in stages; if the judgment is wrong, allow yourself to exit, and do not use adding to a position to cover up the fact that the original logic has already changed. The market will keep updating, and opinions should also adjust with price evidence.
#ZECHitsANewAllTimeHigh

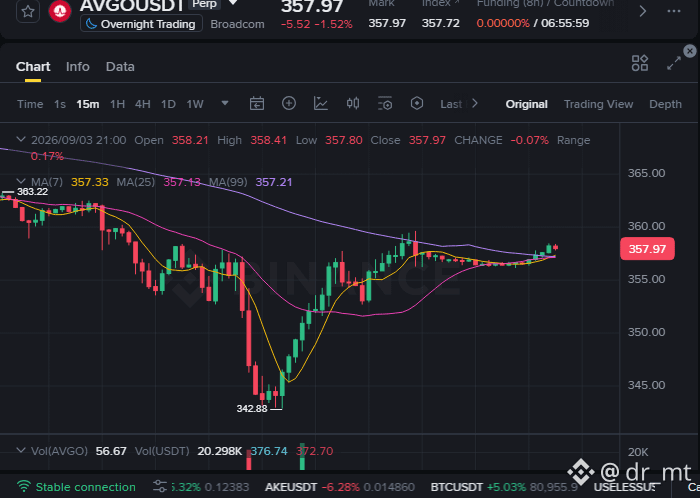
AVGO is giving a clean MACD long watch on 15M 👀
This one is already confirmed.
MACD is 0.5296147199746315,
and the signal line is 0.5119046407552554.
That crossover matters.
It tells us momentum has shifted bullish,
not just hovered near a turn 📈
What makes it interesting?
24h quote volume is 71.75M.
That gives the move enough activity
to make the setup worth tracking.
Still, confirmed crosses can fade.
So this is a long idea,
not a certainty or promise ⚠️
If buyers keep pressing,
the upside map is already there.
Entry: 357.9400
TP1: 361.5194
TP2: 365.0988
TP3: 368.6782
Stop Loss: 350.7812
#AVGO #AVGOUSDT #MACD #LongSetup #CryptoTrading
This one is already confirmed.
MACD is 0.5296147199746315,
and the signal line is 0.5119046407552554.
That crossover matters.
It tells us momentum has shifted bullish,
not just hovered near a turn 📈
What makes it interesting?
24h quote volume is 71.75M.
That gives the move enough activity
to make the setup worth tracking.
Still, confirmed crosses can fade.
So this is a long idea,
not a certainty or promise ⚠️
If buyers keep pressing,
the upside map is already there.
Entry: 357.9400
TP1: 361.5194
TP2: 365.0988
TP3: 368.6782
Stop Loss: 350.7812
#AVGO #AVGOUSDT #MACD #LongSetup #CryptoTrading
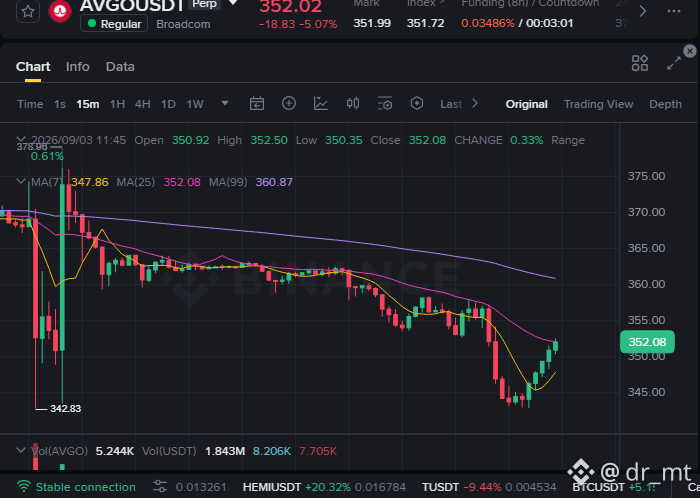
AVGOUSDT is printing a cleaner MACD long watch on 15M 👀
This is not a “maybe” crossover.
MACD has confirmed bullish:
- MACD: -2.7974784326476083
- Signal: -2.9914077093878317
That tells me momentum has already shifted
in the buyer’s favor, even though
it’s still below zero overall.
So this is an early recovery setup,
not a loud trend reversal claim.
What makes it interesting here?
The spread is already established,
and 24h quote volume is 155.57M.
That gives the move enough activity
to stay worth watching for follow-through 📈
The key now is simple:
can price keep pressing higher
after the confirmed cross?
If it can, the upside map is ready.
Entry: 351.9800
TP1: 355.4998
TP2: 359.0196
TP3: 362.5394
Stop Loss: 344.9404
Risk still matters here ⚠️
MACD confirmation helps,
but momentum can fade fast.
#AVGO #AVGOUSDT #MACD #LongSetup #CryptoTrading
This is not a “maybe” crossover.
MACD has confirmed bullish:
- MACD: -2.7974784326476083
- Signal: -2.9914077093878317
That tells me momentum has already shifted
in the buyer’s favor, even though
it’s still below zero overall.
So this is an early recovery setup,
not a loud trend reversal claim.
What makes it interesting here?
The spread is already established,
and 24h quote volume is 155.57M.
That gives the move enough activity
to stay worth watching for follow-through 📈
The key now is simple:
can price keep pressing higher
after the confirmed cross?
If it can, the upside map is ready.
Entry: 351.9800
TP1: 355.4998
TP2: 359.0196
TP3: 362.5394
Stop Loss: 344.9404
Risk still matters here ⚠️
MACD confirmation helps,
but momentum can fade fast.
#AVGO #AVGOUSDT #MACD #LongSetup #CryptoTrading


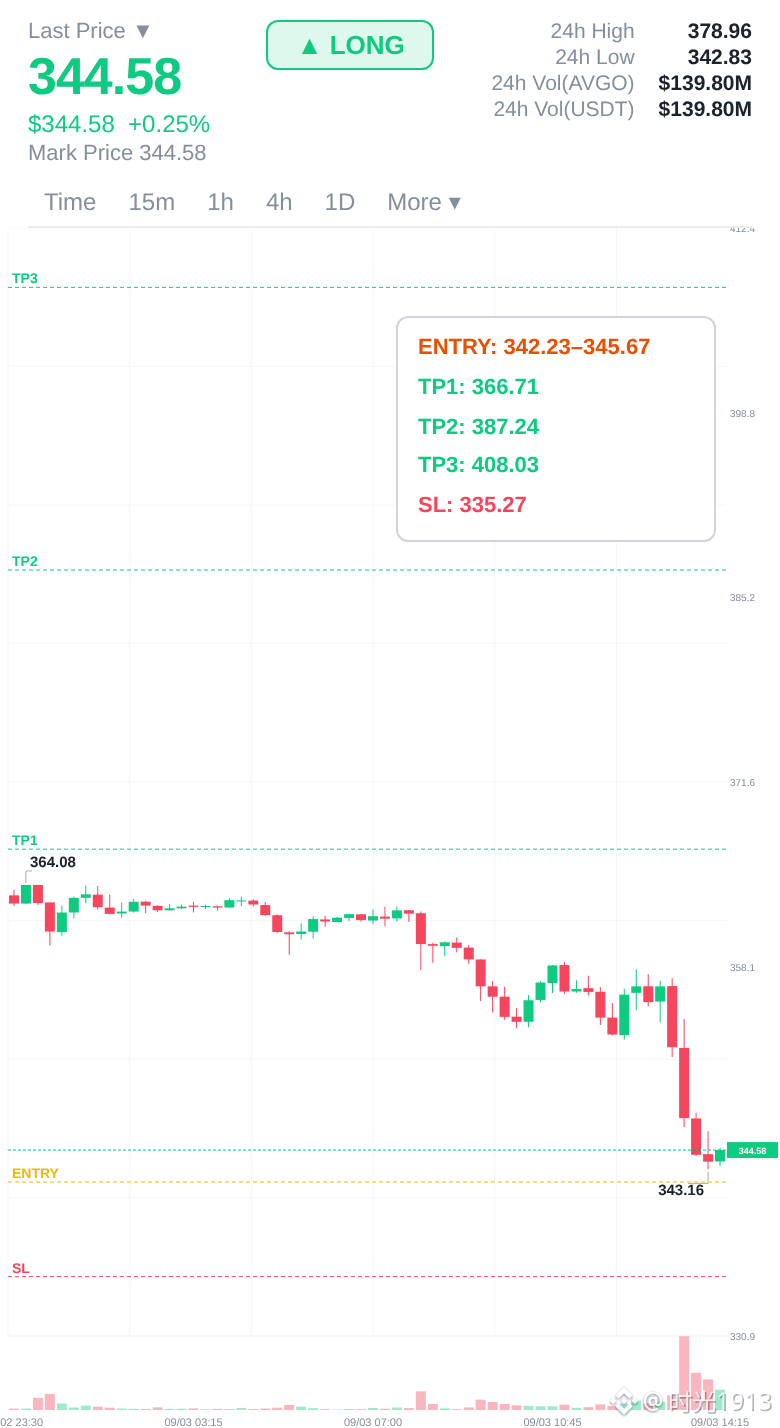
Is AVGO setting up for the most anticipated continuation move? Here's why
CONTINUATION | 📈 LONG
💰 Price: 344.31
📊 24H Range: 342.83 – 378.96
📦 Volume: $139.80M
📐 Technicals:
RSI(14): 29.1 — Oversold
EMA20: $358.10 | EMA50: $363.40 ⚠️ Below EMA50
📈 Entry: 342.23 – 345.67
🛑 Stop: 335.27
🎯 TP1: 366.71
🎯 TP2: 387.24
🎯 TP3: 408.03
📊 Confidence: 80%
The accumulation pattern is complete — markup phase begins.
Bulls on have the momentum — ride it.
Low Risk Entry 👉 $AVGO 👈 Right Here
#AVGO
CONTINUATION | 📈 LONG
💰 Price: 344.31
📊 24H Range: 342.83 – 378.96
📦 Volume: $139.80M
📐 Technicals:
RSI(14): 29.1 — Oversold
EMA20: $358.10 | EMA50: $363.40 ⚠️ Below EMA50
📈 Entry: 342.23 – 345.67
🛑 Stop: 335.27
🎯 TP1: 366.71
🎯 TP2: 387.24
🎯 TP3: 408.03
📊 Confidence: 80%
The accumulation pattern is complete — markup phase begins.
Bulls on have the momentum — ride it.
Low Risk Entry 👉 $AVGO 👈 Right Here
#AVGO



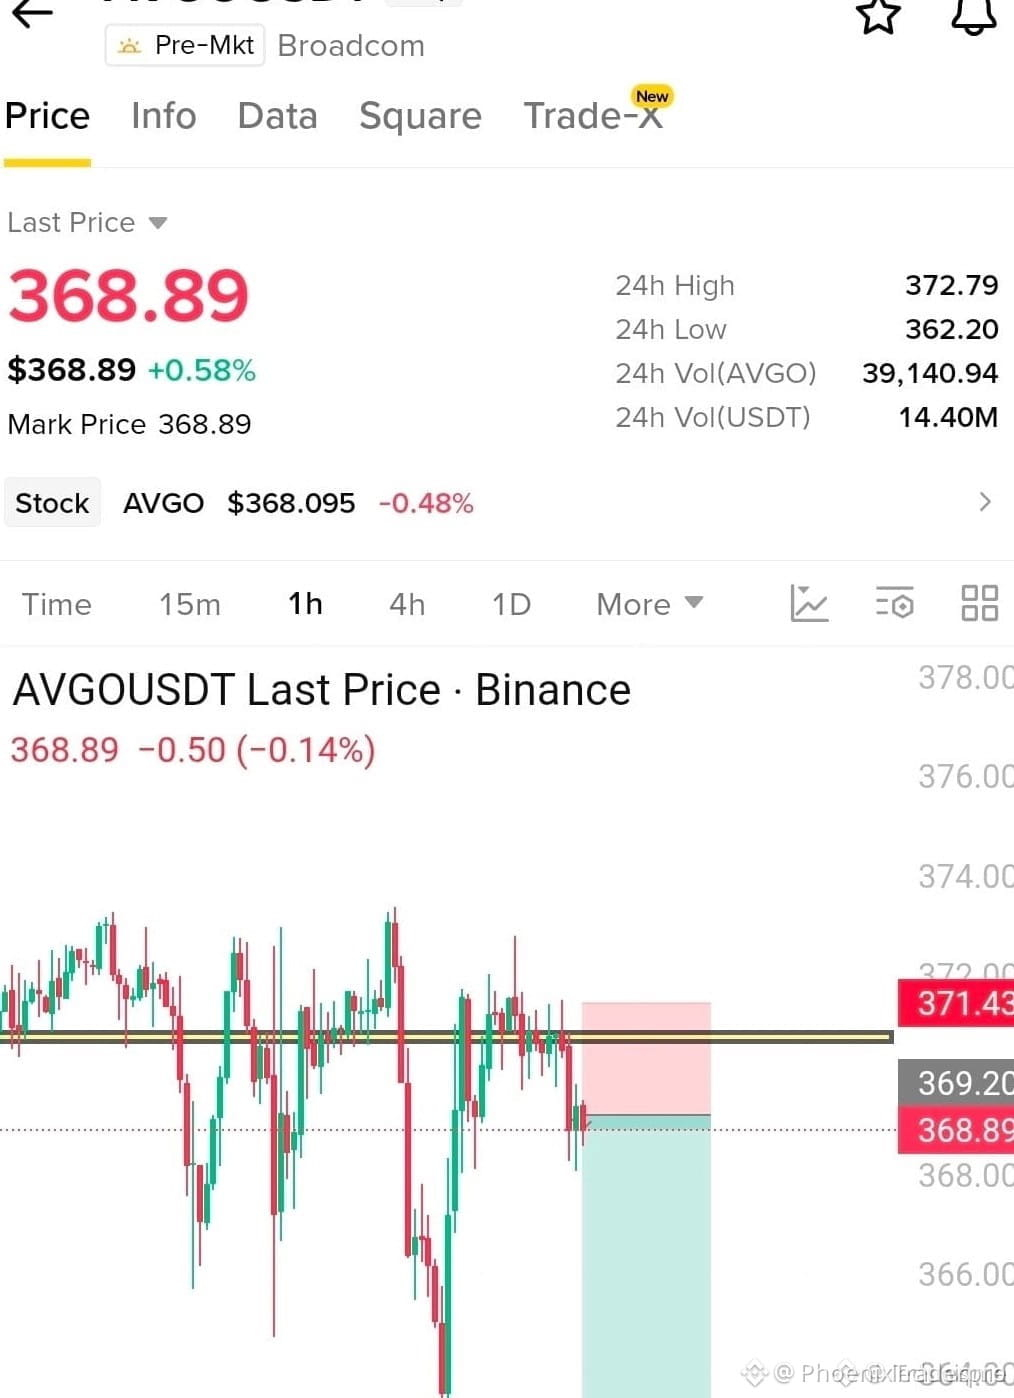
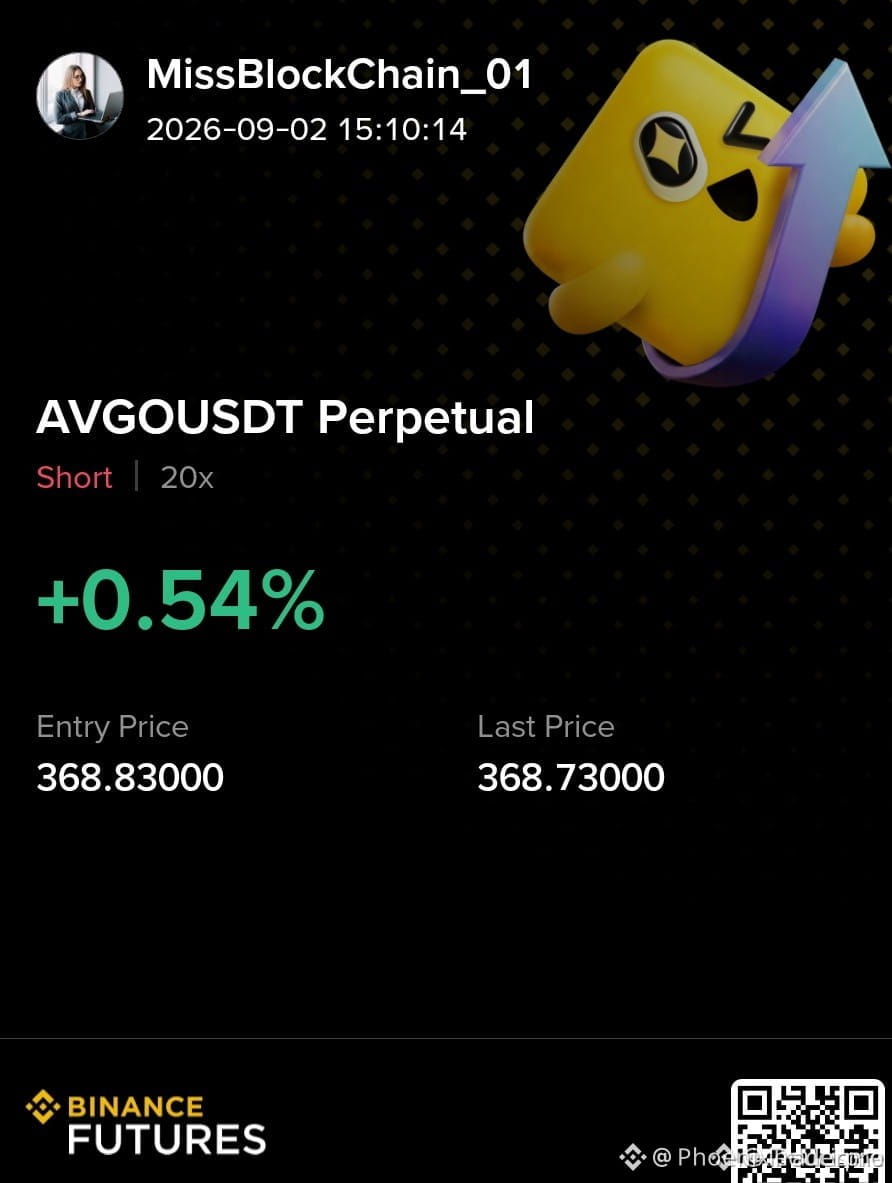
🔴 HEAVY SELLING PRESSURE REJECTS $AVGO AT RESISTANCE FOR A TEXTBOOK SHORT FLIP! 📉
Entry: 368.90 - 369.20 ⚡
Target: 367.00 - 365.00 - 362.41 🎯
Stop Loss: 371.43 🛑
The attempt to reclaim the 369 - 371 supply ceiling collapsed instantly as aggressive sellers stepped in to trap overextended buyers. 🔍 Momentum has completely shifted downward, with order flow showing heavy distribution as bears force price toward key liquidity levels below.
📌 Support structures are fading fast, creating a prime window for momentum traders capitalizing on this structural breakdown. 💡 As long as resistance holds firm overhead, the path of least resistance points straight down. 💬 Are you taking the short drive down to support or waiting for a relief retest? 👇
⚠️ Not financial advice. Always manage your risk. 🛡️
🏷️ #AVGO #ShortSetup #CryptoTrading #Bearish #Breakdown
📉 🩸
Entry: 368.90 - 369.20 ⚡
Target: 367.00 - 365.00 - 362.41 🎯
Stop Loss: 371.43 🛑
The attempt to reclaim the 369 - 371 supply ceiling collapsed instantly as aggressive sellers stepped in to trap overextended buyers. 🔍 Momentum has completely shifted downward, with order flow showing heavy distribution as bears force price toward key liquidity levels below.
📌 Support structures are fading fast, creating a prime window for momentum traders capitalizing on this structural breakdown. 💡 As long as resistance holds firm overhead, the path of least resistance points straight down. 💬 Are you taking the short drive down to support or waiting for a relief retest? 👇
⚠️ Not financial advice. Always manage your risk. 🛡️
🏷️ #AVGO #ShortSetup #CryptoTrading #Bearish #Breakdown
📉 🩸
Log in to explore more content