
#tradingideas
tradingideas
145,756 views
344 Discussing
Hot
Latest

·
--
Bullish
$RESOLV Entering Momentum Territory
📈 $RESOLV is catching attention after a strong +26.46% rally! Market participants are aggressively accumulating, and price action suggests growing confidence among buyers.
📊 Market Overview
Strong bullish sentiment
Fresh momentum building
Watch for breakout continuation
🎯 Trade Targets
Target 1: 0.0260
Target 2: 0.0290
Target 3: 0.0320
🛡️ Key Support
0.0215
0.0195
🚧 Key Resistance
0.0260
0.0290
0.0320
💡 Pro Tip Scale out profits gradually instead of waiting for a single target. Consistent profit-taking improves long-term performance.
{spot}(RESOLVUSDT)
$MUB
{spot}(MUBUSDT)
#RESOLV #CryptoTrader #MarketWatch #AltcoinAlert #TradingIdeas
$RESOLV Entering Momentum Territory
📈 $RESOLV is catching attention after a strong +26.46% rally! Market participants are aggressively accumulating, and price action suggests growing confidence among buyers.
📊 Market Overview
Strong bullish sentiment
Fresh momentum building
Watch for breakout continuation
🎯 Trade Targets
Target 1: 0.0260
Target 2: 0.0290
Target 3: 0.0320
🛡️ Key Support
0.0215
0.0195
🚧 Key Resistance
0.0260
0.0290
0.0320
💡 Pro Tip Scale out profits gradually instead of waiting for a single target. Consistent profit-taking improves long-term performance.
$MUB
#RESOLV #CryptoTrader #MarketWatch #AltcoinAlert #TradingIdeas
📈 $RESOLV is catching attention after a strong +26.46% rally! Market participants are aggressively accumulating, and price action suggests growing confidence among buyers.
📊 Market Overview
Strong bullish sentiment
Fresh momentum building
Watch for breakout continuation
🎯 Trade Targets
Target 1: 0.0260
Target 2: 0.0290
Target 3: 0.0320
🛡️ Key Support
0.0215
0.0195
🚧 Key Resistance
0.0260
0.0290
0.0320
💡 Pro Tip Scale out profits gradually instead of waiting for a single target. Consistent profit-taking improves long-term performance.
$MUB
#RESOLV #CryptoTrader #MarketWatch #AltcoinAlert #TradingIdeas
125

·
--
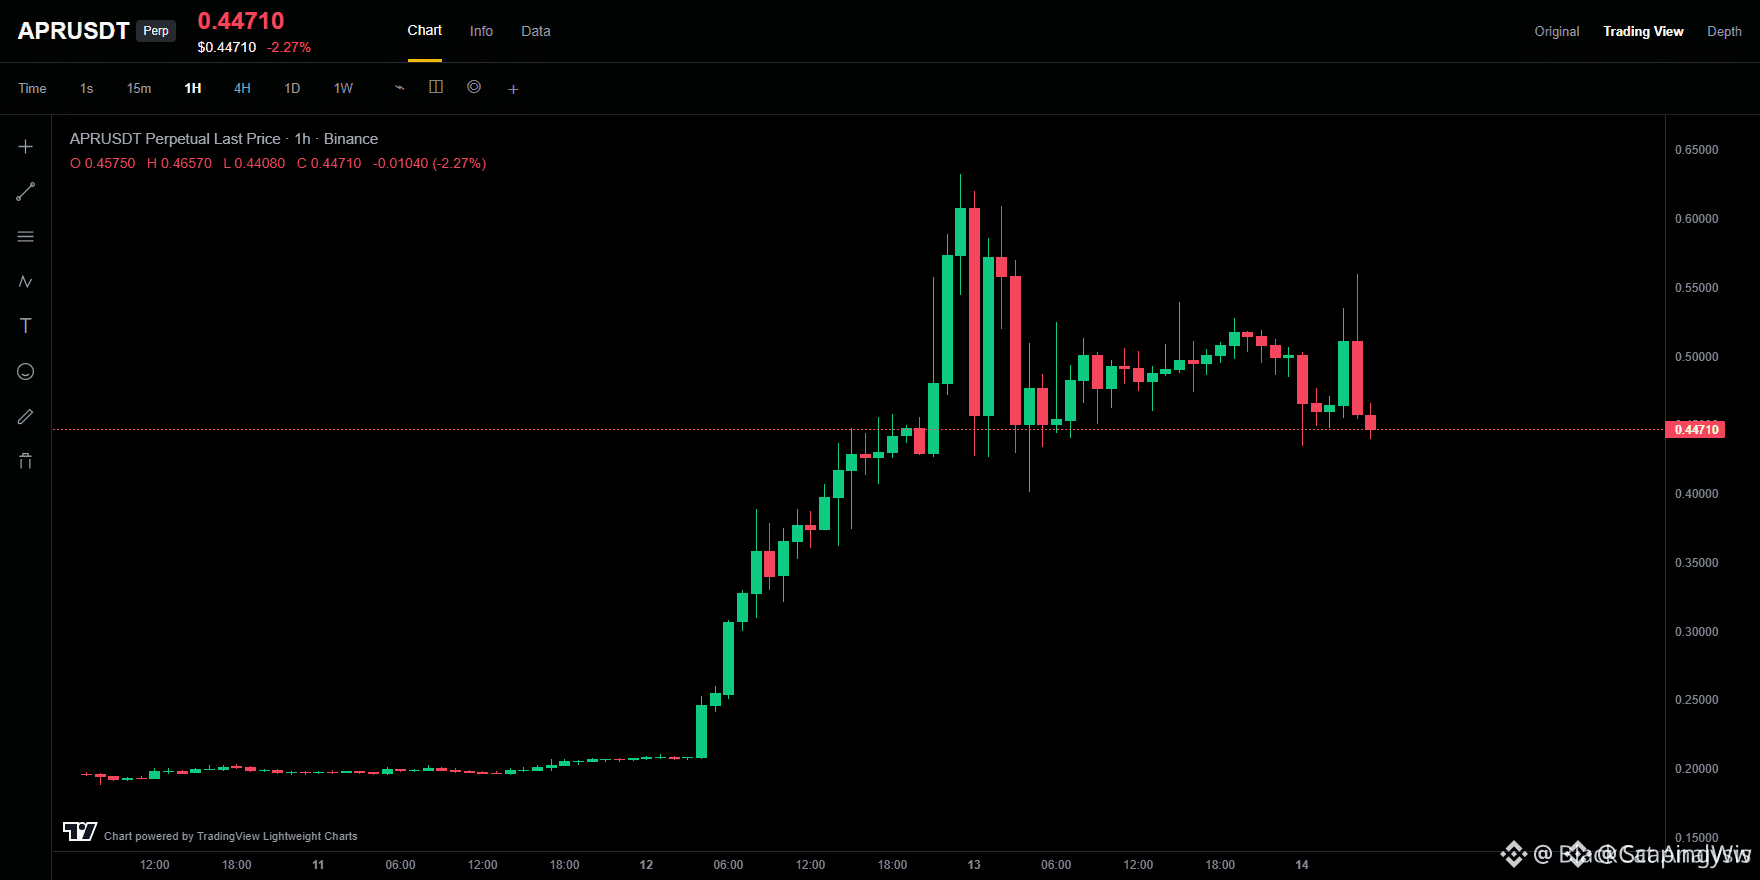
$APR BREAKOUT ZONE APPROACHING — CATCH THE LONGS BEFORE THE BID WALL CRACKS 🎯📈
Entry zone: 0.4442–0.4528 📥
Target 1: 0.4669 🎯
Target 2: 0.4852 🎯
Target 3: 0.5036 🚀
Stop-loss: below 0.4301 🛑
The tape is quiet. Volume is thin. That's exactly when sharp money leans in early. Accumulation isn't loud — it's calculated. $APR is flirting with a zone where sellers have been stretched thin, and a sweep lower could ignite the same move the big players have been quietly positioning for. This is a momentum trader's chessboard, not a casino.
The risk defines the trade — stop below 0.4301 keeps the thesis honest. If the bids hold and price flips through the first target, the path to 0.4852 opens up like a door left ajar. If it fails, you shake hands and walk. Clean structure. Clean execution. No emotional attachments.
Are you buying the dip or waiting for the breakout confirmation? Drop your read below 👇
⚠️ Not financial advice. Always manage your risk. 🛡️
🏷️ $APR #Altcoins #Momentum #CryptoSignals #TradingIdeas
🔥🎯
$APR BREAKOUT ZONE APPROACHING — CATCH THE LONGS BEFORE THE BID WALL CRACKS 🎯📈
Entry zone: 0.4442–0.4528 📥
Target 1: 0.4669 🎯
Target 2: 0.4852 🎯
Target 3: 0.5036 🚀
Stop-loss: below 0.4301 🛑
The tape is quiet. Volume is thin. That's exactly when sharp money leans in early. Accumulation isn't loud — it's calculated. $APR is flirting with a zone where sellers have been stretched thin, and a sweep lower could ignite the same move the big players have been quietly positioning for. This is a momentum trader's chessboard, not a casino.
The risk defines the trade — stop below 0.4301 keeps the thesis honest. If the bids hold and price flips through the first target, the path to 0.4852 opens up like a door left ajar. If it fails, you shake hands and walk. Clean structure. Clean execution. No emotional attachments.
Are you buying the dip or waiting for the breakout confirmation? Drop your read below 👇
⚠️ Not financial advice. Always manage your risk. 🛡️
🏷️ $APR #Altcoins #Momentum #CryptoSignals #TradingIdeas
🔥🎯
Entry zone: 0.4442–0.4528 📥
Target 1: 0.4669 🎯
Target 2: 0.4852 🎯
Target 3: 0.5036 🚀
Stop-loss: below 0.4301 🛑
The tape is quiet. Volume is thin. That's exactly when sharp money leans in early. Accumulation isn't loud — it's calculated. $APR is flirting with a zone where sellers have been stretched thin, and a sweep lower could ignite the same move the big players have been quietly positioning for. This is a momentum trader's chessboard, not a casino.
The risk defines the trade — stop below 0.4301 keeps the thesis honest. If the bids hold and price flips through the first target, the path to 0.4852 opens up like a door left ajar. If it fails, you shake hands and walk. Clean structure. Clean execution. No emotional attachments.
Are you buying the dip or waiting for the breakout confirmation? Drop your read below 👇
⚠️ Not financial advice. Always manage your risk. 🛡️
🏷️ $APR #Altcoins #Momentum #CryptoSignals #TradingIdeas
🔥🎯
227

·
--
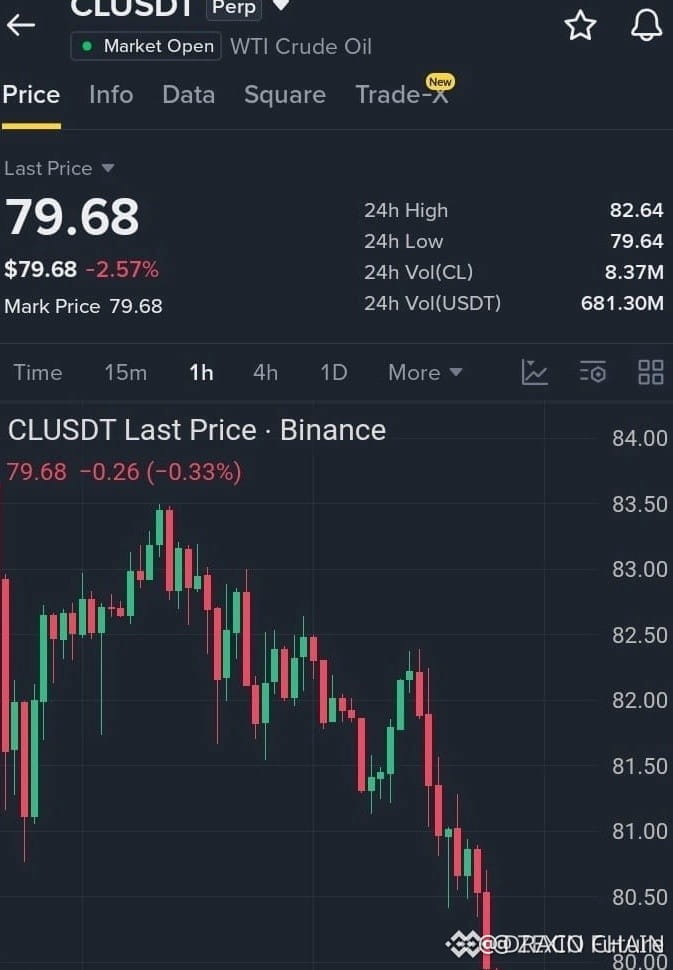
SHORT $CL – LOWER LOWS CONFIRMED ON 1H, BREAKDOWN IN PLAY 📉⚡
ENTRY: 79.65 - 79.90 📍
TP1: 79.20 🎯
TP2: 78.80 🎯
TP3: 78.30 🎯
STOP LOSS: 80.35 🛑
The 1H structure just printed a clean lower low – the kind of displacement that traps breakout buyers above 80. Price is now pressing into the sell-side liquidity pool, and the reaction off that failed reclaim tells me institutional flow is one-sided. That 80.00 handle is the battleground, and once it breaks, the path to 78.30 opens up like a textbook liquidity cascade.
This isn't a chase – it's a structural short with defined risk. The entry zone sits right at the order block retest, and the stop above 80.35 keeps you safe from any engineered wick. If price respects the breakdown, we get a clean 1:3+ R:R without any heroics. Just let the market come to you and manage the trade like a pro – trail your stop to entry once TP1 prints.
What's your read on the 80 pivot – fakeout or fundamental shift? Drop your levels below 👇
⚠️ Not financial advice. Always manage your risk. 🛡️
🏷️ $CL #SmartMoneyConcepts #ShortSetup #TradingIdeas #StructureBreak
📉🎯
SHORT $CL – LOWER LOWS CONFIRMED ON 1H, BREAKDOWN IN PLAY 📉⚡
ENTRY: 79.65 - 79.90 📍
TP1: 79.20 🎯
TP2: 78.80 🎯
TP3: 78.30 🎯
STOP LOSS: 80.35 🛑
The 1H structure just printed a clean lower low – the kind of displacement that traps breakout buyers above 80. Price is now pressing into the sell-side liquidity pool, and the reaction off that failed reclaim tells me institutional flow is one-sided. That 80.00 handle is the battleground, and once it breaks, the path to 78.30 opens up like a textbook liquidity cascade.
This isn't a chase – it's a structural short with defined risk. The entry zone sits right at the order block retest, and the stop above 80.35 keeps you safe from any engineered wick. If price respects the breakdown, we get a clean 1:3+ R:R without any heroics. Just let the market come to you and manage the trade like a pro – trail your stop to entry once TP1 prints.
What's your read on the 80 pivot – fakeout or fundamental shift? Drop your levels below 👇
⚠️ Not financial advice. Always manage your risk. 🛡️
🏷️ $CL #SmartMoneyConcepts #ShortSetup #TradingIdeas #StructureBreak
📉🎯
ENTRY: 79.65 - 79.90 📍
TP1: 79.20 🎯
TP2: 78.80 🎯
TP3: 78.30 🎯
STOP LOSS: 80.35 🛑
The 1H structure just printed a clean lower low – the kind of displacement that traps breakout buyers above 80. Price is now pressing into the sell-side liquidity pool, and the reaction off that failed reclaim tells me institutional flow is one-sided. That 80.00 handle is the battleground, and once it breaks, the path to 78.30 opens up like a textbook liquidity cascade.
This isn't a chase – it's a structural short with defined risk. The entry zone sits right at the order block retest, and the stop above 80.35 keeps you safe from any engineered wick. If price respects the breakdown, we get a clean 1:3+ R:R without any heroics. Just let the market come to you and manage the trade like a pro – trail your stop to entry once TP1 prints.
What's your read on the 80 pivot – fakeout or fundamental shift? Drop your levels below 👇
⚠️ Not financial advice. Always manage your risk. 🛡️
🏷️ $CL #SmartMoneyConcepts #ShortSetup #TradingIdeas #StructureBreak
📉🎯
59

·
--
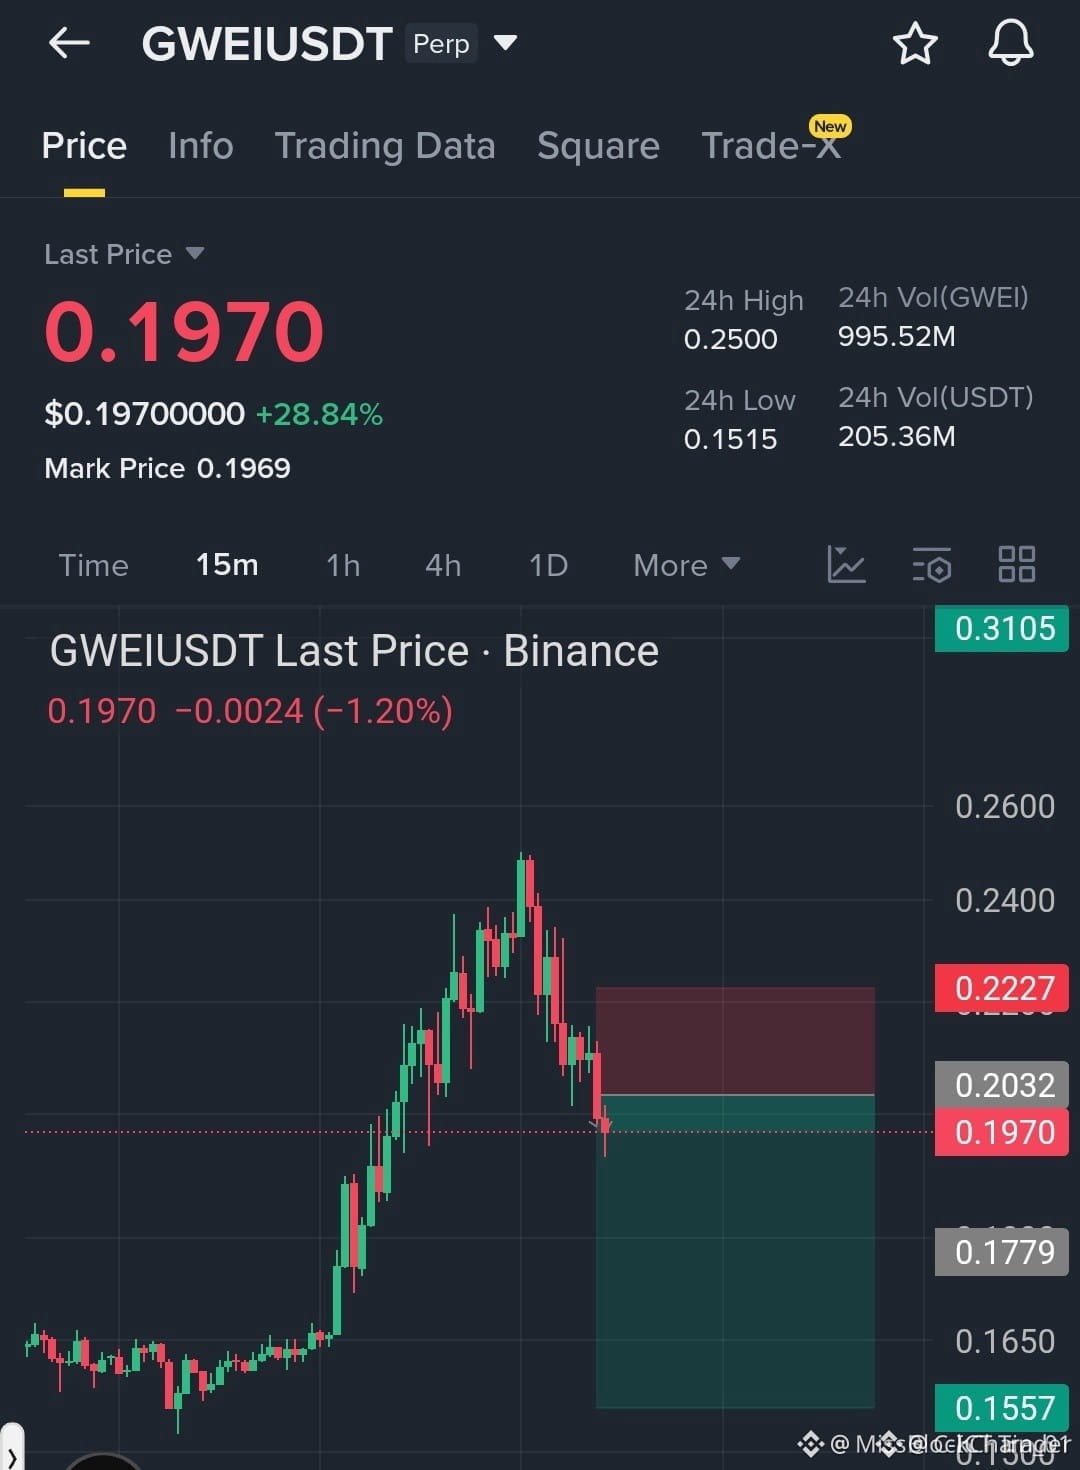
$GWEI 'S BULLISH MOMENTUM FADES — SHORT SETUP IN PLAY ⚡
Entry: 0.1970 - 0.2030 🔥
Target: 0.1850 🚀
Stop Loss: 0.2227 ⚠️
GWEI rejected sharply at the local top and has now broken below the 0.1970 support zone, confirming seller control. Structure clearly favors continuation lower toward 0.1850 as long as 0.2227 resistance holds. Volume is drying up on the bounce, reinforcing weak buying interest and making the short bias more convincing.
Are you already positioned for the breakdown or waiting for a retest of the entry zone?
Not financial advice. Always manage your risk.
#GWEI #ShortSetup #Bearish #TradingIdeas
⚡
$GWEI 'S BULLISH MOMENTUM FADES — SHORT SETUP IN PLAY ⚡
Entry: 0.1970 - 0.2030 🔥
Target: 0.1850 🚀
Stop Loss: 0.2227 ⚠️
GWEI rejected sharply at the local top and has now broken below the 0.1970 support zone, confirming seller control. Structure clearly favors continuation lower toward 0.1850 as long as 0.2227 resistance holds. Volume is drying up on the bounce, reinforcing weak buying interest and making the short bias more convincing.
Are you already positioned for the breakdown or waiting for a retest of the entry zone?
Not financial advice. Always manage your risk.
#GWEI #ShortSetup #Bearish #TradingIdeas
⚡
Entry: 0.1970 - 0.2030 🔥
Target: 0.1850 🚀
Stop Loss: 0.2227 ⚠️
GWEI rejected sharply at the local top and has now broken below the 0.1970 support zone, confirming seller control. Structure clearly favors continuation lower toward 0.1850 as long as 0.2227 resistance holds. Volume is drying up on the bounce, reinforcing weak buying interest and making the short bias more convincing.
Are you already positioned for the breakdown or waiting for a retest of the entry zone?
Not financial advice. Always manage your risk.
#GWEI #ShortSetup #Bearish #TradingIdeas
⚡
63
·
--
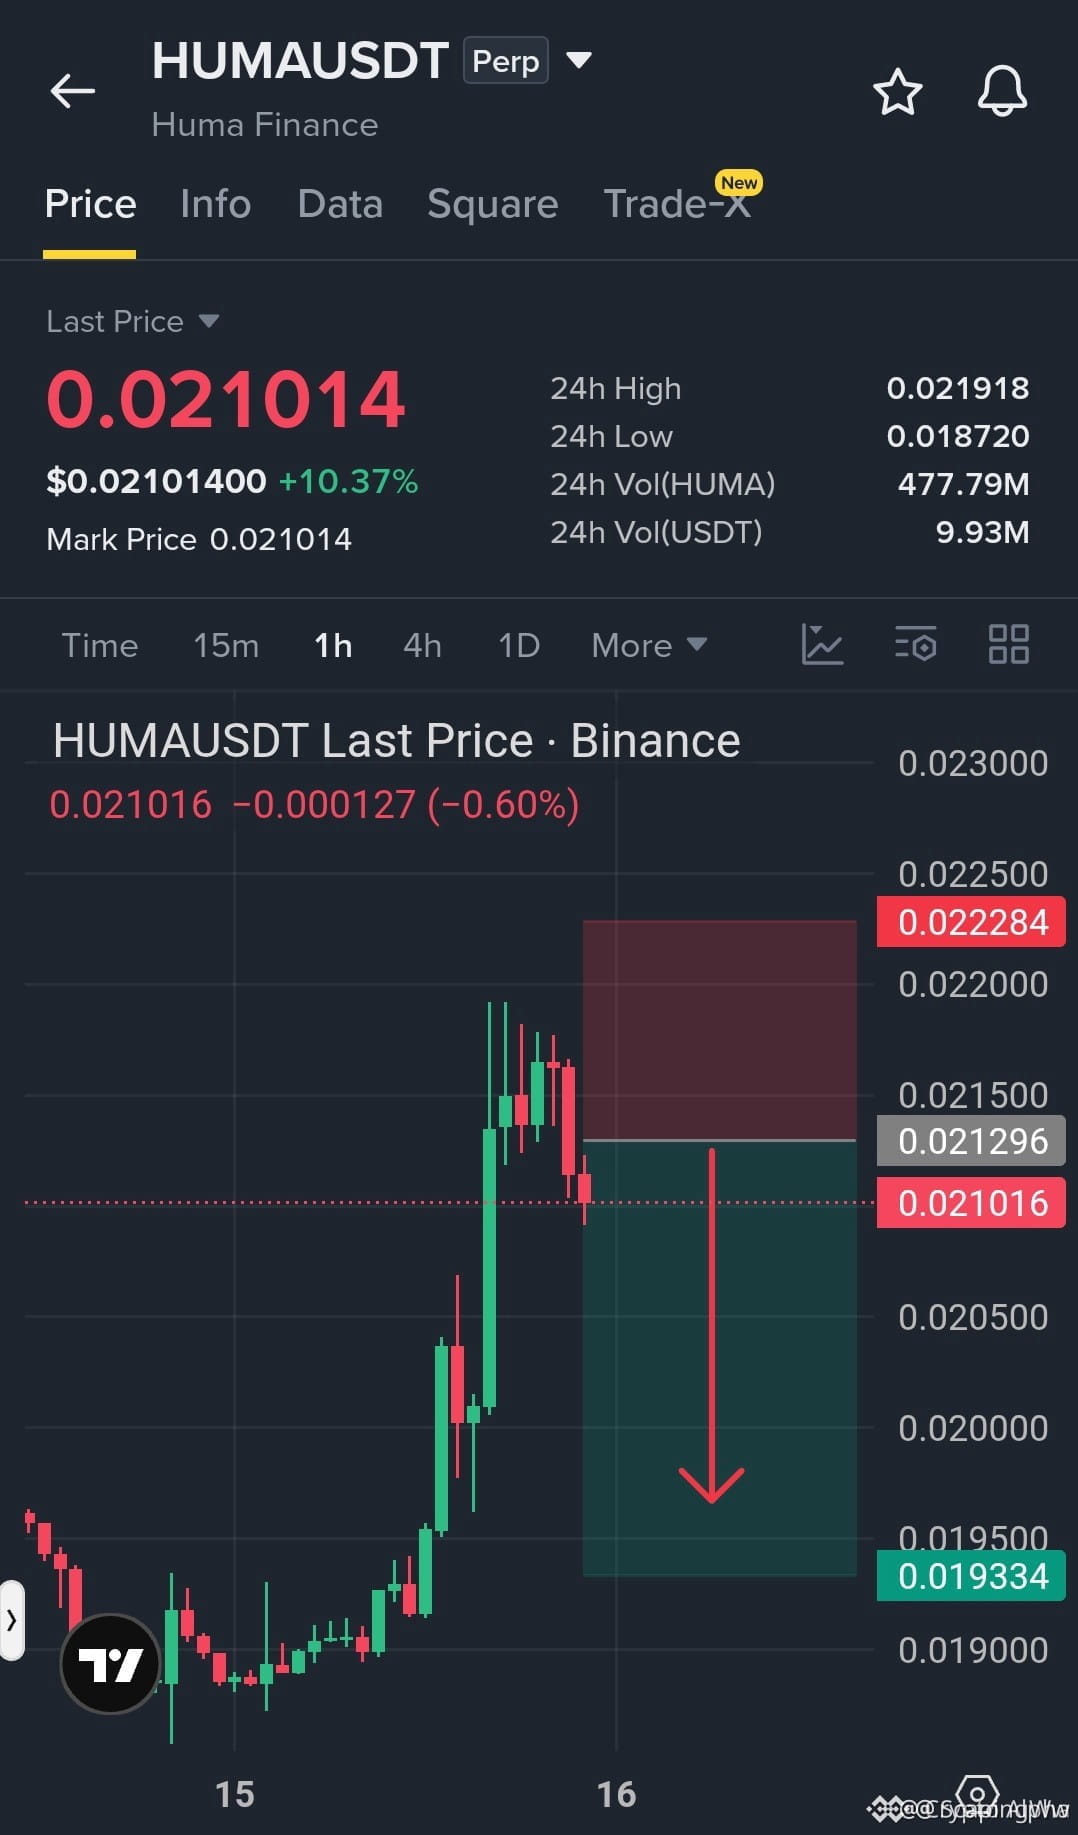
🔻 $HUMA REJECTING HARD AT 0.0215–0.0219 — BID STACKS ARE MELTING! 🚨
Entry: 0.0210–0.0213 🔻
Target: 0.0205 🎯
Target: 0.0199 💥
Target: 0.01935 💣
Stop Loss: 0.0223 ⚠️
📌 Those repeated upper wicks in the 0.0215–0.0219 zone aren't random noise — that's seller aggression stepping in every time bulls try to extend the move. Buyers are getting rejected with force, and the momentum that fueled the rally is now flipping into exhaustion. 📉 Each failed push above range is pulling more passive bids, leaving the path of least resistance pointing down.
🔍 The shorter-term structure is already cracking. Price keeps losing the bid on every micro-retest, and with liquidity sitting below, a sweep toward 0.01935 looks like the natural magnet. 📊 This isn't a fade-the-top gamble — it's a high-probability reaction trade with defined edge and tight risk. 💬 How many upper wicks does it take before you respect the rejection? 👇
⚠️ Not financial advice. Always manage your risk. 🛡️
🏷️ #HUMA #ShortSetup #Crypto #TradingIdeas
🎯 🔻
🔻 $HUMA REJECTING HARD AT 0.0215–0.0219 — BID STACKS ARE MELTING! 🚨
Entry: 0.0210–0.0213 🔻
Target: 0.0205 🎯
Target: 0.0199 💥
Target: 0.01935 💣
Stop Loss: 0.0223 ⚠️
📌 Those repeated upper wicks in the 0.0215–0.0219 zone aren't random noise — that's seller aggression stepping in every time bulls try to extend the move. Buyers are getting rejected with force, and the momentum that fueled the rally is now flipping into exhaustion. 📉 Each failed push above range is pulling more passive bids, leaving the path of least resistance pointing down.
🔍 The shorter-term structure is already cracking. Price keeps losing the bid on every micro-retest, and with liquidity sitting below, a sweep toward 0.01935 looks like the natural magnet. 📊 This isn't a fade-the-top gamble — it's a high-probability reaction trade with defined edge and tight risk. 💬 How many upper wicks does it take before you respect the rejection? 👇
⚠️ Not financial advice. Always manage your risk. 🛡️
🏷️ #HUMA #ShortSetup #Crypto #TradingIdeas
🎯 🔻
Entry: 0.0210–0.0213 🔻
Target: 0.0205 🎯
Target: 0.0199 💥
Target: 0.01935 💣
Stop Loss: 0.0223 ⚠️
📌 Those repeated upper wicks in the 0.0215–0.0219 zone aren't random noise — that's seller aggression stepping in every time bulls try to extend the move. Buyers are getting rejected with force, and the momentum that fueled the rally is now flipping into exhaustion. 📉 Each failed push above range is pulling more passive bids, leaving the path of least resistance pointing down.
🔍 The shorter-term structure is already cracking. Price keeps losing the bid on every micro-retest, and with liquidity sitting below, a sweep toward 0.01935 looks like the natural magnet. 📊 This isn't a fade-the-top gamble — it's a high-probability reaction trade with defined edge and tight risk. 💬 How many upper wicks does it take before you respect the rejection? 👇
⚠️ Not financial advice. Always manage your risk. 🛡️
🏷️ #HUMA #ShortSetup #Crypto #TradingIdeas
🎯 🔻
39
·
--
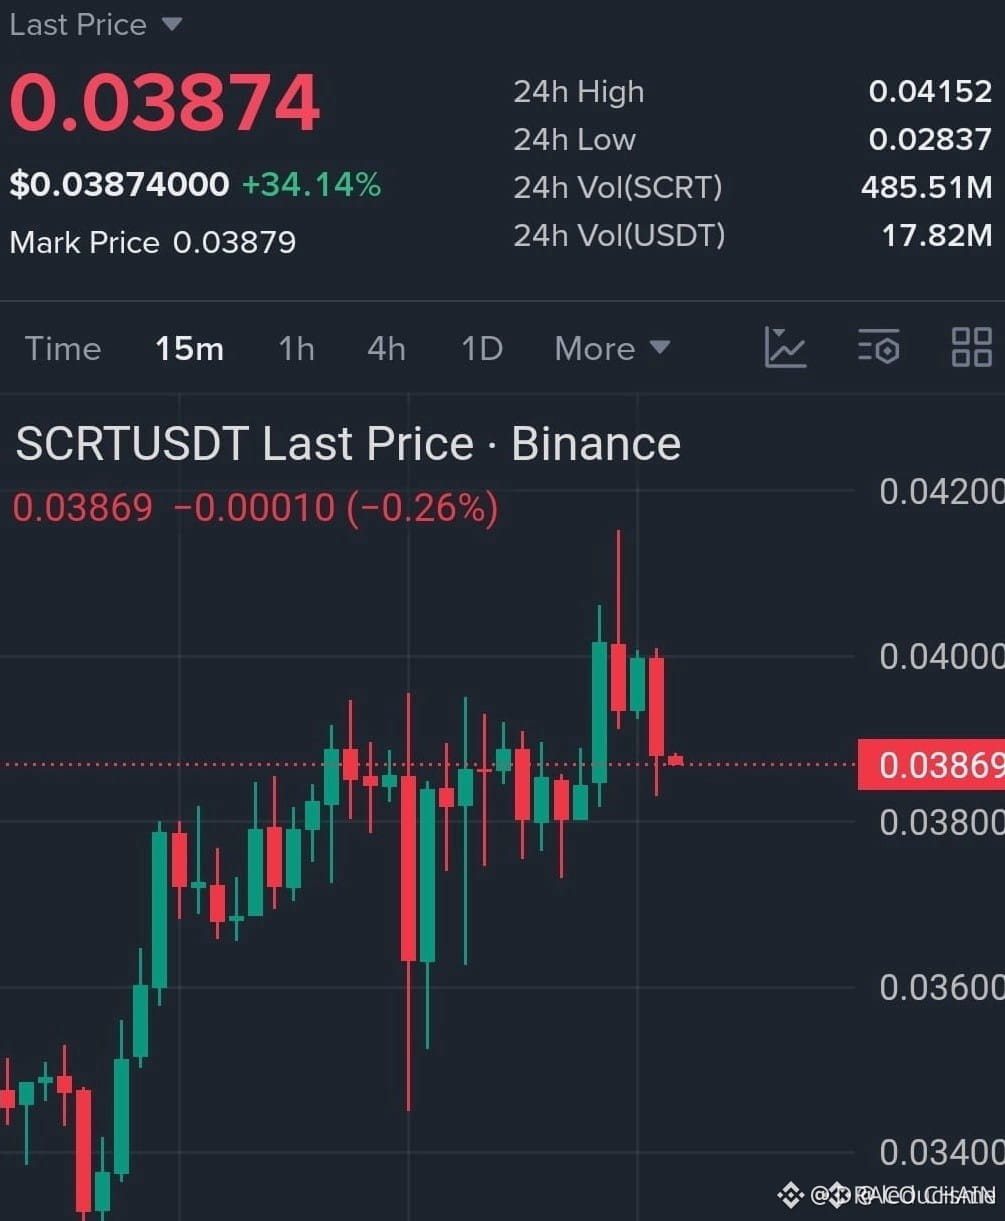
SHORT $SCRT AT A HARD CEILING THAT WON'T GIVE WAY 📉🔻
Entry: 0.0382 – 0.0392 📉
Target: 0.0365 / 0.0348 / 0.0325 / 0.0300 🎯
Stop Loss: 0.0458 🛑
$SCRT keeps kissing the 0.0388 supply band, and every attempt above gets absorbed on the spot. Price action reads like a coiled breakdown — each rejection tightens the range and builds sell-side pressure beneath that wall. The structure is showing distribution footprints, not accumulation. Once this ceiling confirms, the flush toward 0.0300 becomes the path of least resistance.
Smart money has already left their mark at the entry zone. The reaction profile off 0.0388 tells the story: buyers show up weak, sellers reload every time. The lower timeframes are carving out a descending continuation that targets the range lows with room to extend.
Do you see 0.0388 as the final guard before the drop, or are you going to fade this short and wait for a breakout?
⚠️ Not financial advice. Always manage your risk. 🛡️
🏷️ $SCRT #Scrt #ShortSetup #CryptoAnalysis #TradingIdeas
📊⚡
SHORT $SCRT AT A HARD CEILING THAT WON'T GIVE WAY 📉🔻
Entry: 0.0382 – 0.0392 📉
Target: 0.0365 / 0.0348 / 0.0325 / 0.0300 🎯
Stop Loss: 0.0458 🛑
$SCRT keeps kissing the 0.0388 supply band, and every attempt above gets absorbed on the spot. Price action reads like a coiled breakdown — each rejection tightens the range and builds sell-side pressure beneath that wall. The structure is showing distribution footprints, not accumulation. Once this ceiling confirms, the flush toward 0.0300 becomes the path of least resistance.
Smart money has already left their mark at the entry zone. The reaction profile off 0.0388 tells the story: buyers show up weak, sellers reload every time. The lower timeframes are carving out a descending continuation that targets the range lows with room to extend.
Do you see 0.0388 as the final guard before the drop, or are you going to fade this short and wait for a breakout?
⚠️ Not financial advice. Always manage your risk. 🛡️
🏷️ $SCRT #Scrt #ShortSetup #CryptoAnalysis #TradingIdeas
📊⚡
Entry: 0.0382 – 0.0392 📉
Target: 0.0365 / 0.0348 / 0.0325 / 0.0300 🎯
Stop Loss: 0.0458 🛑
$SCRT keeps kissing the 0.0388 supply band, and every attempt above gets absorbed on the spot. Price action reads like a coiled breakdown — each rejection tightens the range and builds sell-side pressure beneath that wall. The structure is showing distribution footprints, not accumulation. Once this ceiling confirms, the flush toward 0.0300 becomes the path of least resistance.
Smart money has already left their mark at the entry zone. The reaction profile off 0.0388 tells the story: buyers show up weak, sellers reload every time. The lower timeframes are carving out a descending continuation that targets the range lows with room to extend.
Do you see 0.0388 as the final guard before the drop, or are you going to fade this short and wait for a breakout?
⚠️ Not financial advice. Always manage your risk. 🛡️
🏷️ $SCRT #Scrt #ShortSetup #CryptoAnalysis #TradingIdeas
📊⚡
30

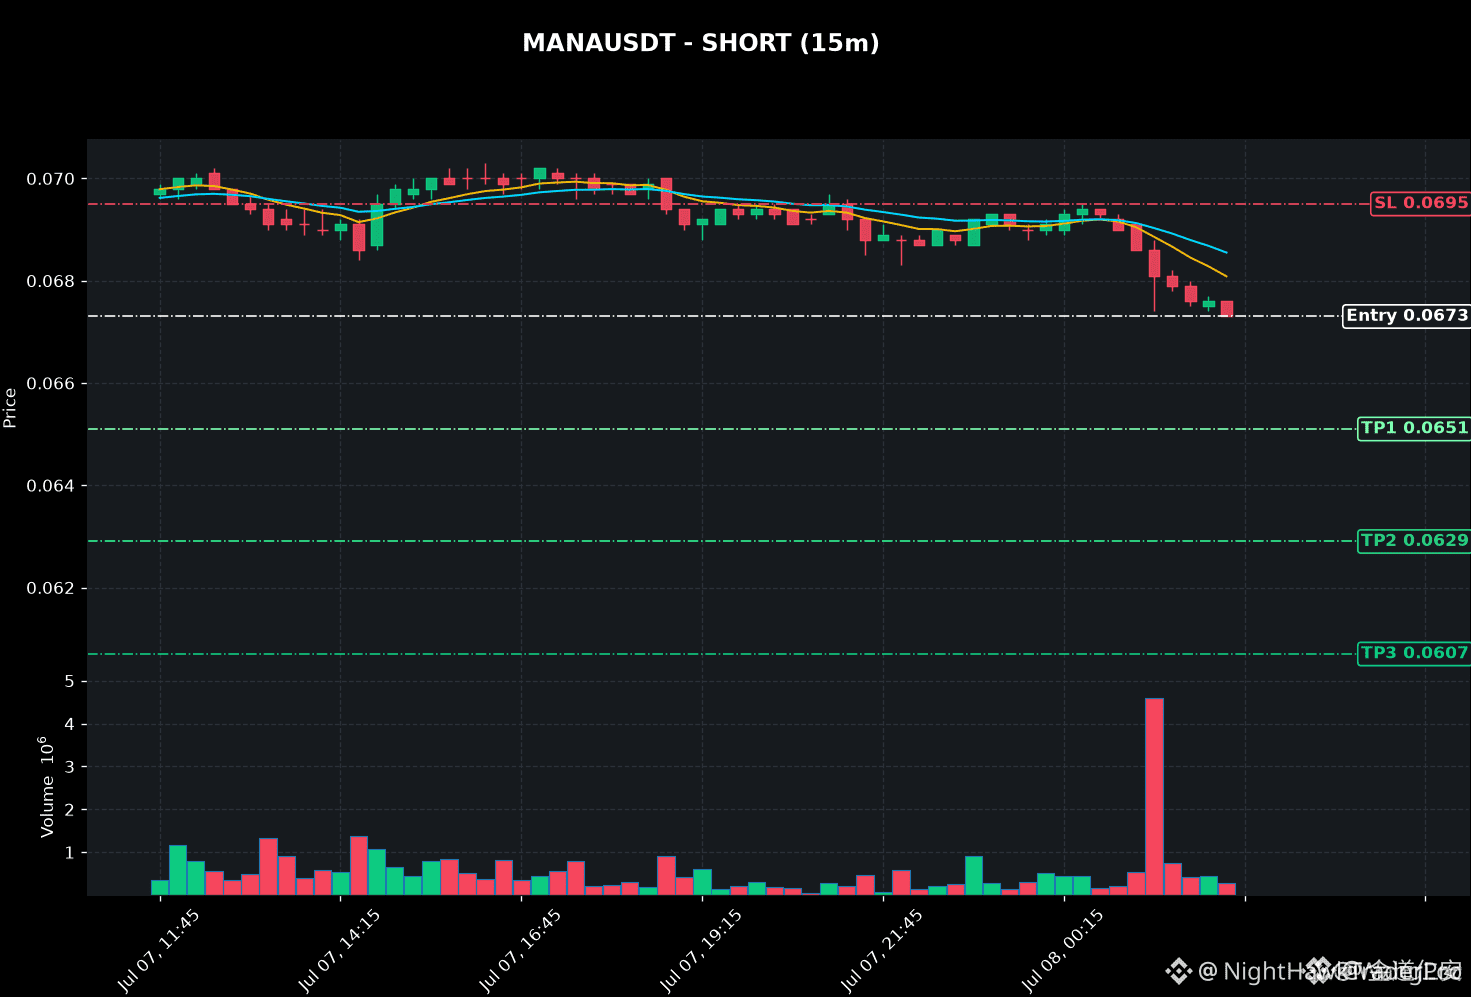
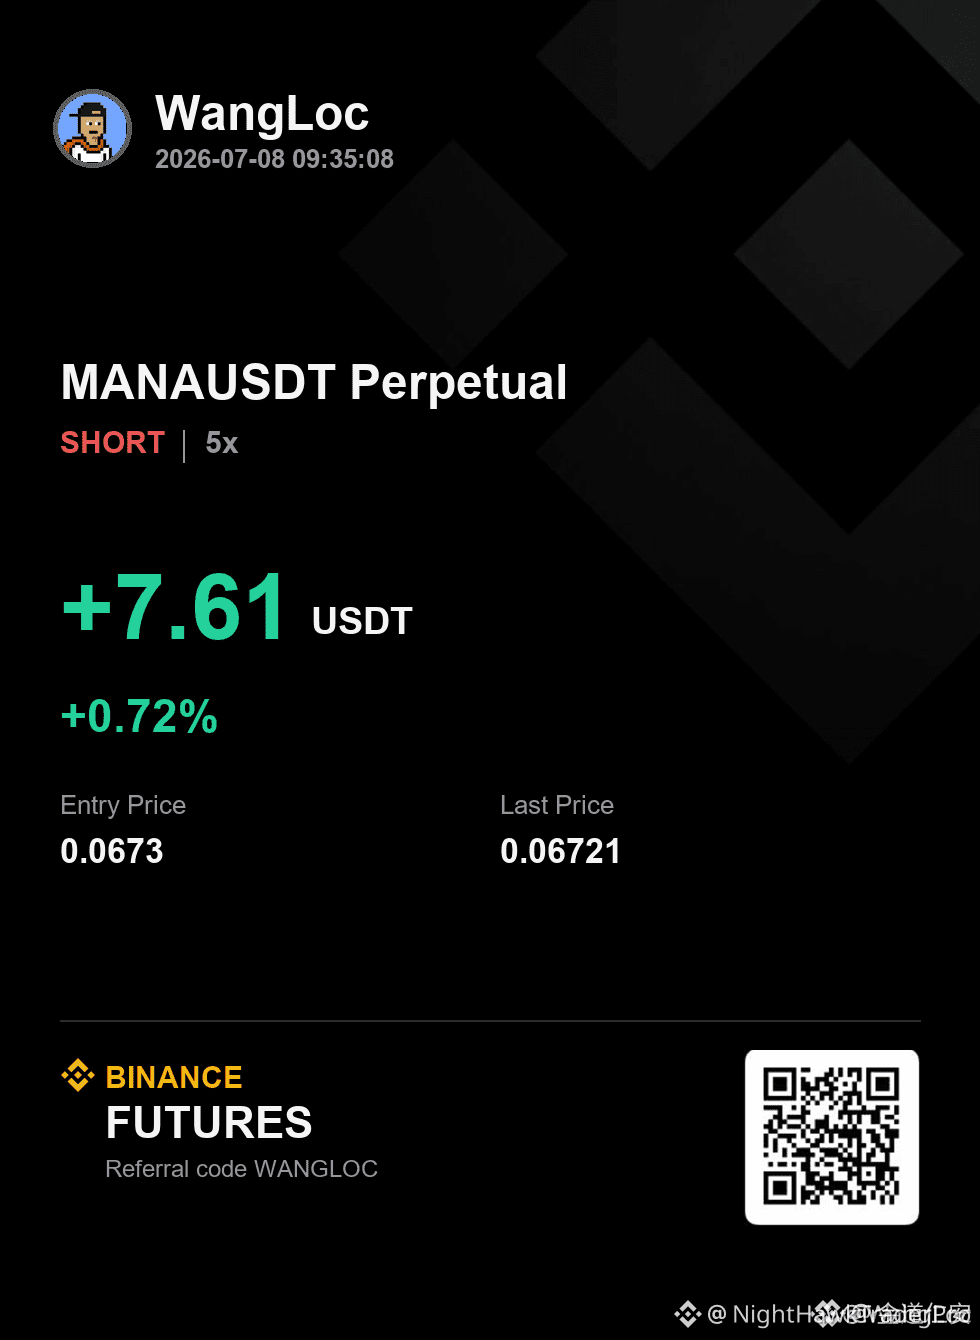
$MANA SHORT SETUP ACTIVE AFTER RSI HITS 24.8 🚨
Entry: 0.0673 🔥
Target: 0.0651 🚀
Stop Loss: 0.0695 ⚠️
The RSI on the 15-minute chart just dropped to 24.8 — extreme oversold territory. But don't take that as an automatic buy signal. Both EMA9 and EMA20 are stacking bearishly, and the volume confirms sellers are still in control. I'm leaning short with about 70% confidence on this move.
The setup makes sense if you respect the trend. Price can still drift lower while RSI stays low. First target at 0.0651 gives a clean risk-reward. Are you shorting this dip or waiting for a reclaim?
Not financial advice. Always manage your risk.
#MANA #ShortSetup #CryptoSignals #TradingIdeas
💎
$MANA SHORT SETUP ACTIVE AFTER RSI HITS 24.8 🚨
Entry: 0.0673 🔥
Target: 0.0651 🚀
Stop Loss: 0.0695 ⚠️
The RSI on the 15-minute chart just dropped to 24.8 — extreme oversold territory. But don't take that as an automatic buy signal. Both EMA9 and EMA20 are stacking bearishly, and the volume confirms sellers are still in control. I'm leaning short with about 70% confidence on this move.
The setup makes sense if you respect the trend. Price can still drift lower while RSI stays low. First target at 0.0651 gives a clean risk-reward. Are you shorting this dip or waiting for a reclaim?
Not financial advice. Always manage your risk.
#MANA #ShortSetup #CryptoSignals #TradingIdeas
💎
Entry: 0.0673 🔥
Target: 0.0651 🚀
Stop Loss: 0.0695 ⚠️
The RSI on the 15-minute chart just dropped to 24.8 — extreme oversold territory. But don't take that as an automatic buy signal. Both EMA9 and EMA20 are stacking bearishly, and the volume confirms sellers are still in control. I'm leaning short with about 70% confidence on this move.
The setup makes sense if you respect the trend. Price can still drift lower while RSI stays low. First target at 0.0651 gives a clean risk-reward. Are you shorting this dip or waiting for a reclaim?
Not financial advice. Always manage your risk.
#MANA #ShortSetup #CryptoSignals #TradingIdeas
💎
97

·
--
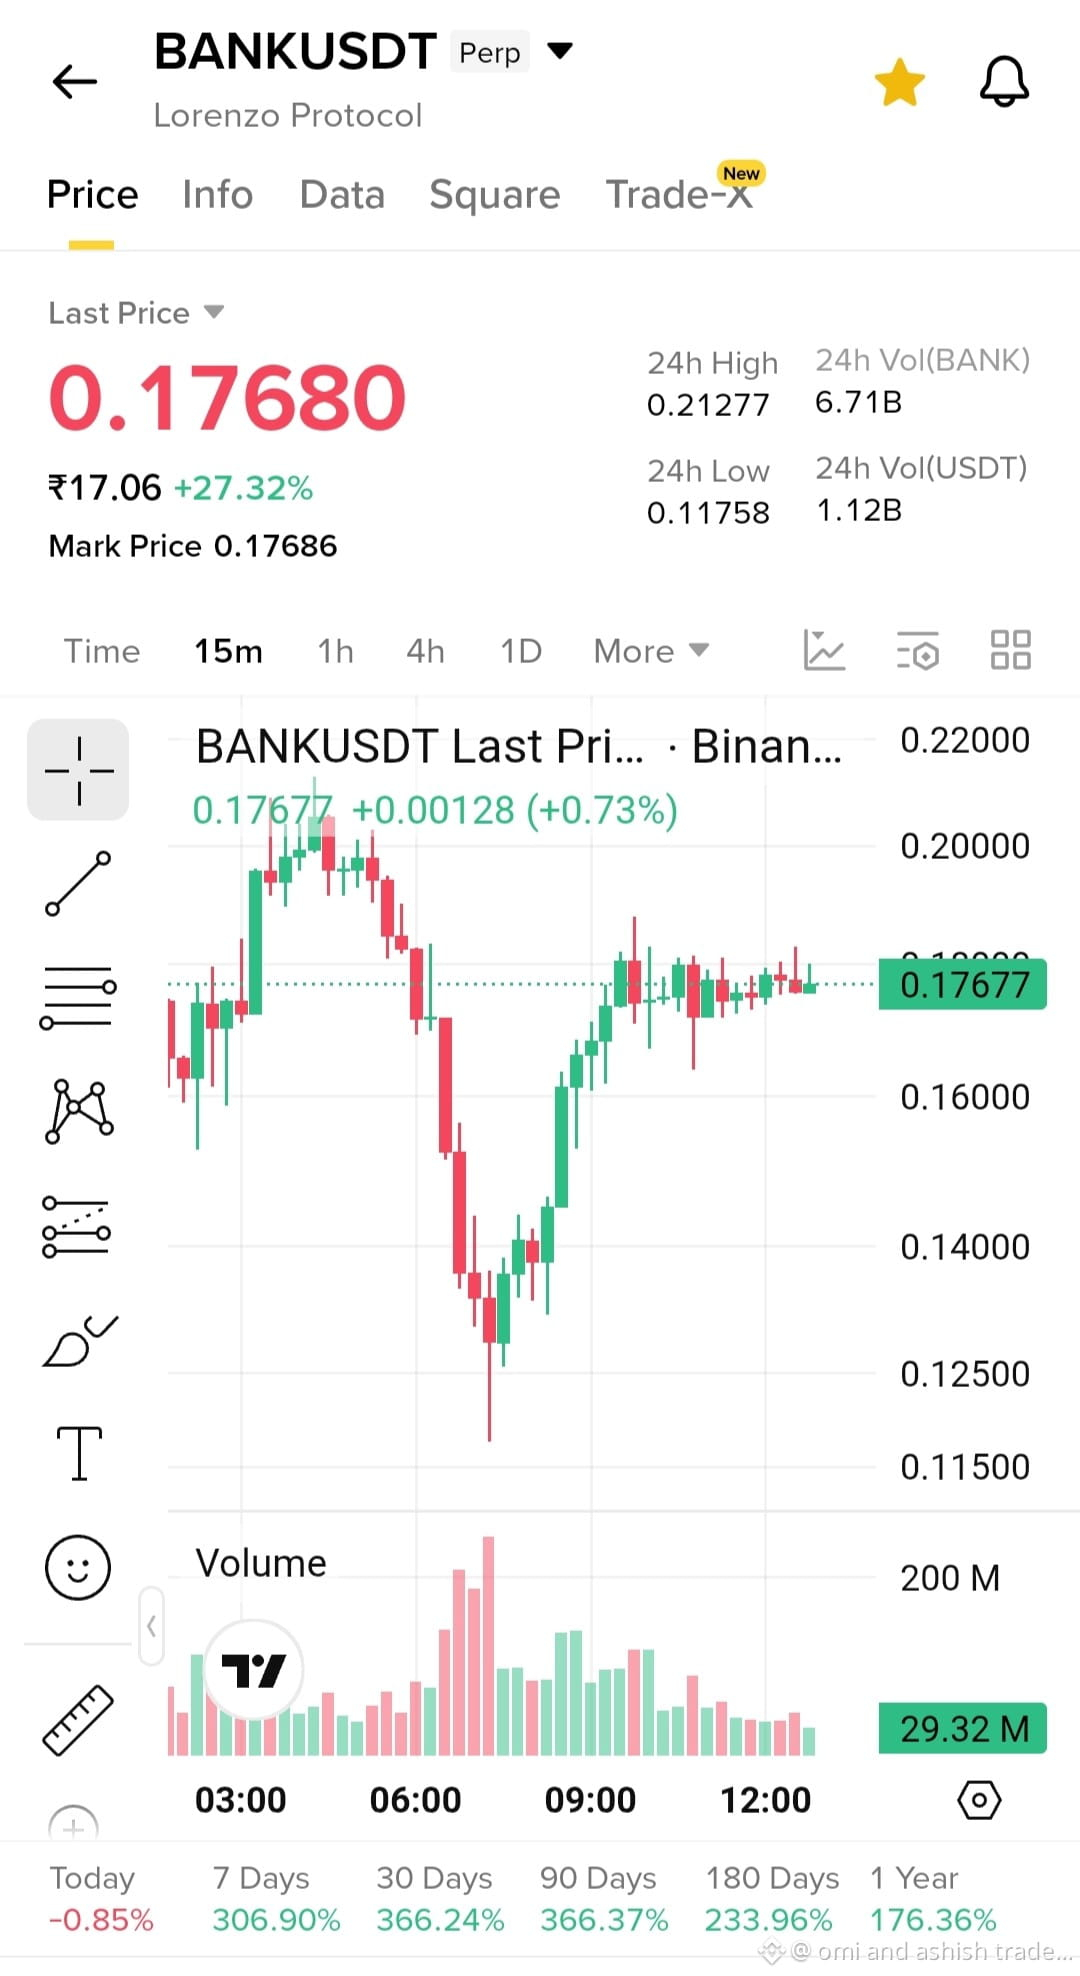
📊 $BANK Trade Idea
BANK is holding above 0.1700, showing buyers are defending support after strong volatility. A sustained move above 0.1800 could attract fresh momentum.
🎯 Entry: 0.1710–0.1750
🎯 Target 1: 0.1850
🎯 Target 2: 0.1980
🛑 Stop-loss: 0.1660
Always wait for confirmation before entering and never risk more than you can afford to lose. What are your thoughts on BANK's next move? 👇
#bank #crypto #TradingIdeas #RiskManagementMastery $RE $AKE
{future}(BANKUSDT)
{future}(AKEUSDT)
{future}(REUSDT)
📊 $BANK Trade Idea
BANK is holding above 0.1700, showing buyers are defending support after strong volatility. A sustained move above 0.1800 could attract fresh momentum.
🎯 Entry: 0.1710–0.1750
🎯 Target 1: 0.1850
🎯 Target 2: 0.1980
🛑 Stop-loss: 0.1660
Always wait for confirmation before entering and never risk more than you can afford to lose. What are your thoughts on BANK's next move? 👇
#bank #crypto #TradingIdeas #RiskManagementMastery $RE $AKE
BANK is holding above 0.1700, showing buyers are defending support after strong volatility. A sustained move above 0.1800 could attract fresh momentum.
🎯 Entry: 0.1710–0.1750
🎯 Target 1: 0.1850
🎯 Target 2: 0.1980
🛑 Stop-loss: 0.1660
Always wait for confirmation before entering and never risk more than you can afford to lose. What are your thoughts on BANK's next move? 👇
#bank #crypto #TradingIdeas #RiskManagementMastery $RE $AKE
1
319

·
--
Bullish
🔥 $ESPORTS Breaking Out! Healthy Retest Before the Next Massive Pump? 🚀🔥 $ESPORT
{alpha}(560xf39e4b21c84e737df08e2c3b32541d856f508e48)
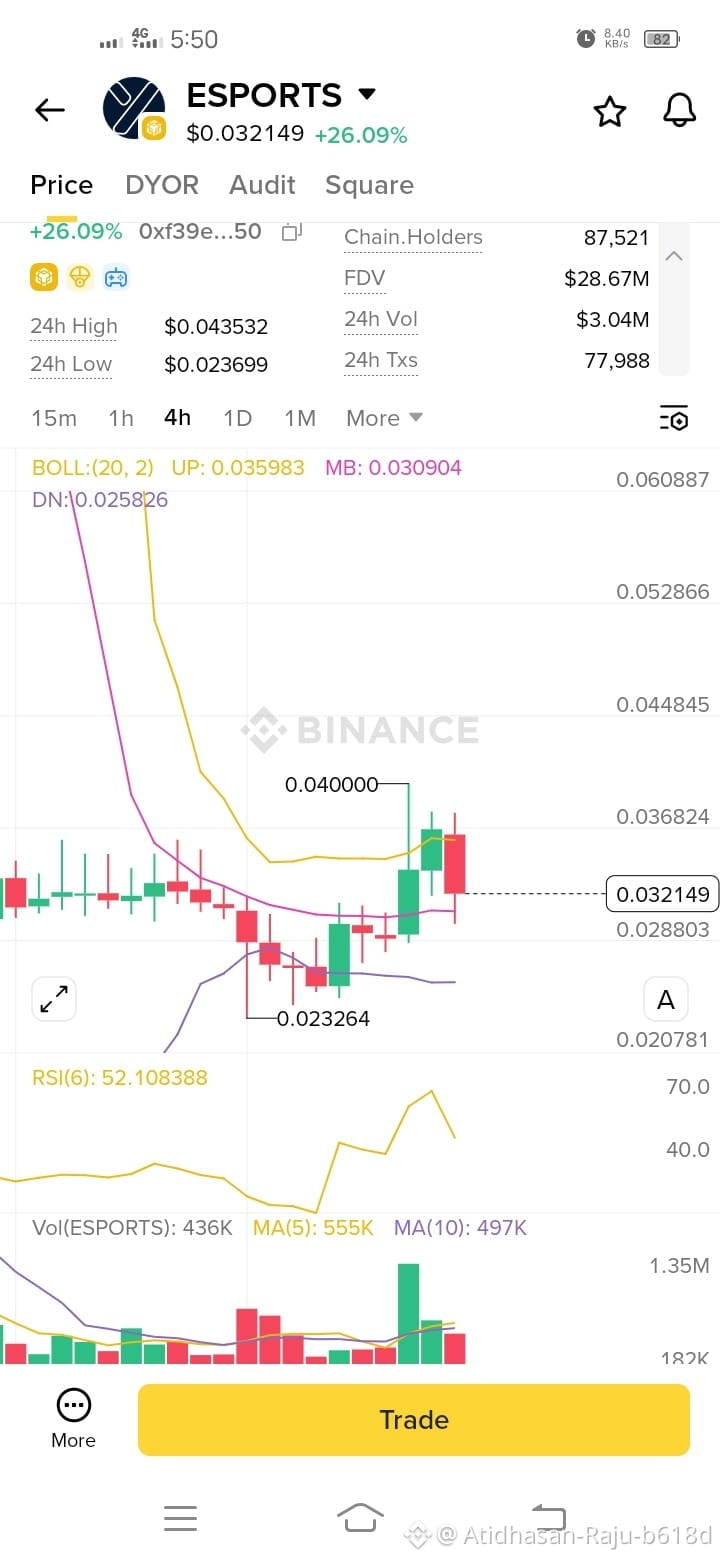
$ESPORTS is flashing highly bullish structural behavior on the 4-hour chart! After bouncing hard off its major bottom at $0.023264, the price cleanly broke above the middle Bollinger Band (MB: 0.030904) and is currently undergoing a healthy retest of this line to establish it as new support.
The RSI(6) has successfully cooled down to a perfectly neutral 52.10 from overbought levels, giving the asset massive runway for its next explosive leg up. Trading volume on the prior breakout candles was strong, indicating real buying interest behind the move. This looks like a prime spot-only accumulation opportunity right on the support cushion!
🛒 Entry Zone: $0.03100 - $0.03250
🎯 Target 1 (TP1): $0.03600
🎯 Target 2 (TP2): $0.04000
🎯 Target 3 (TP3): $0.04350+
🛑 Stop Loss (SL): $0.02850 (Below the middle Bollinger Band cushion)
💬 Do you think $ESPORTS will successfully hold the middle band support and smash past $0.04000 on the next candle? Drop your technical views below! 👇
#esports #CryptoSignals #SpotTrading #TradingIdeas #altcoins
🔥 $ESPORTS Breaking Out! Healthy Retest Before the Next Massive Pump? 🚀🔥 $ESPORT
$ESPORTS is flashing highly bullish structural behavior on the 4-hour chart! After bouncing hard off its major bottom at $0.023264, the price cleanly broke above the middle Bollinger Band (MB: 0.030904) and is currently undergoing a healthy retest of this line to establish it as new support.
The RSI(6) has successfully cooled down to a perfectly neutral 52.10 from overbought levels, giving the asset massive runway for its next explosive leg up. Trading volume on the prior breakout candles was strong, indicating real buying interest behind the move. This looks like a prime spot-only accumulation opportunity right on the support cushion!
🛒 Entry Zone: $0.03100 - $0.03250
🎯 Target 1 (TP1): $0.03600
🎯 Target 2 (TP2): $0.04000
🎯 Target 3 (TP3): $0.04350+
🛑 Stop Loss (SL): $0.02850 (Below the middle Bollinger Band cushion)
💬 Do you think $ESPORTS will successfully hold the middle band support and smash past $0.04000 on the next candle? Drop your technical views below! 👇
#esports #CryptoSignals #SpotTrading #TradingIdeas #altcoins
$ESPORTS is flashing highly bullish structural behavior on the 4-hour chart! After bouncing hard off its major bottom at $0.023264, the price cleanly broke above the middle Bollinger Band (MB: 0.030904) and is currently undergoing a healthy retest of this line to establish it as new support.
The RSI(6) has successfully cooled down to a perfectly neutral 52.10 from overbought levels, giving the asset massive runway for its next explosive leg up. Trading volume on the prior breakout candles was strong, indicating real buying interest behind the move. This looks like a prime spot-only accumulation opportunity right on the support cushion!
🛒 Entry Zone: $0.03100 - $0.03250
🎯 Target 1 (TP1): $0.03600
🎯 Target 2 (TP2): $0.04000
🎯 Target 3 (TP3): $0.04350+
🛑 Stop Loss (SL): $0.02850 (Below the middle Bollinger Band cushion)
💬 Do you think $ESPORTS will successfully hold the middle band support and smash past $0.04000 on the next candle? Drop your technical views below! 👇
#esports #CryptoSignals #SpotTrading #TradingIdeas #altcoins
193

·
--
🚀 APPB: Is Another Bullish Move Coming, or Is the Rally Losing Momentum?
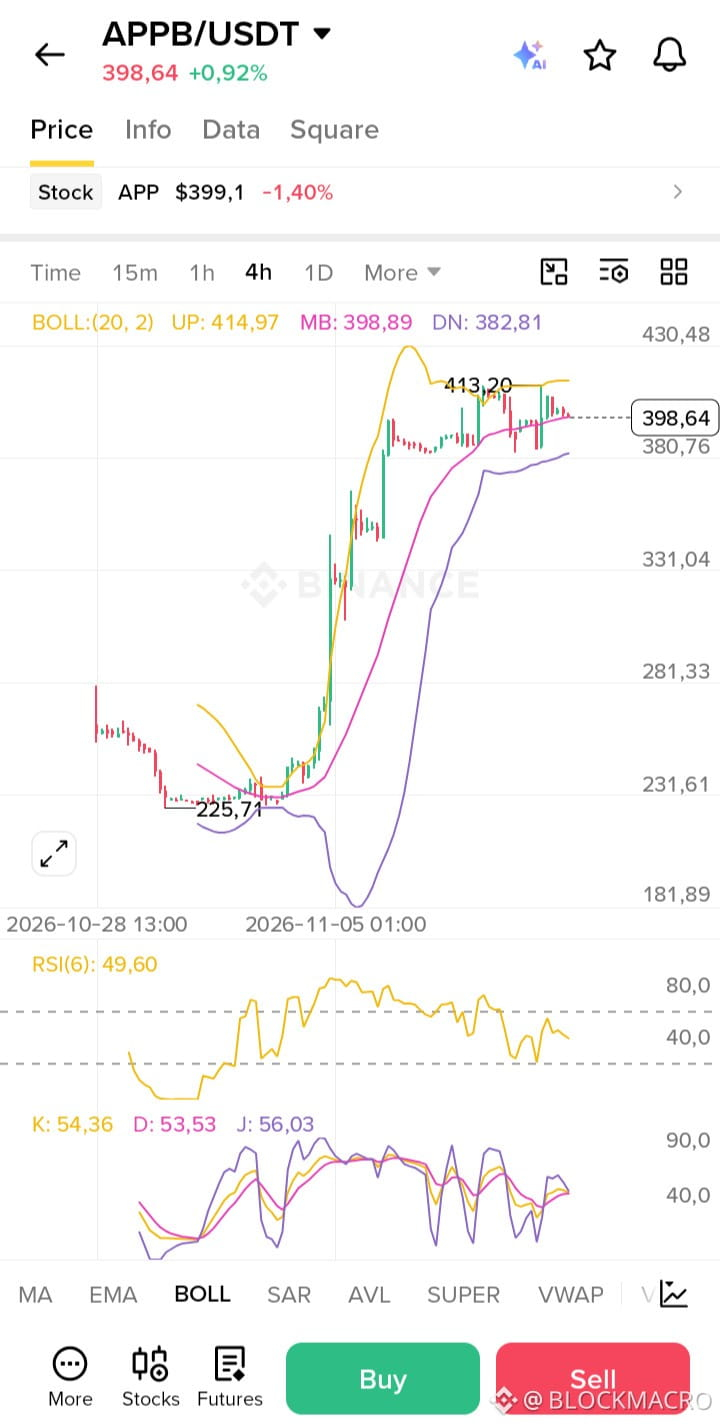
APPB has experienced a remarkable rally, climbing from $225.74 to $413.32. Now, the market is consolidating near $398.64, and the next move could be important.
📊 4H Technical Outlook
Current Price: $398.64
RSI(6): 49.60 – Neutral momentum
Bollinger Upper: $414.97
Bollinger Middle: $398.89
Bollinger Lower: $382.81
🟢 Bullish Scenario: A confirmed breakout above $405 could open the way toward:
$413.32
$414.97
$430.00
🔴 Bearish Scenario: A breakdown below $380.76 could expose lower support levels:
$365.00
$350.00
$331.00
🔥 Fundamental Perspective
AppLovin delivered impressive Q3 2026 results, with revenue increasing 55% year-over-year and net income rising 72%.
Its strong profitability and AI-driven advertising technology provide a positive fundamental backdrop.
🎯 My Trading Bias:
Cautiously BULLISH, but I want confirmation above $405 before considering a LONG position.
A breakdown below $380.76 would invalidate this bullish setup and shift my attention toward the SHORT scenario.
The key question: Is APPB preparing for another breakout, or will sellers take control below $400?
My conclusion: APPB has stronger fundamental support than its current technical momentum suggests. I would wait for the $405 breakout before committing to a LONG trade.
$APPB #APPBUSDT #TradingIdeas
🚀 APPB: Is Another Bullish Move Coming, or Is the Rally Losing Momentum?
APPB has experienced a remarkable rally, climbing from $225.74 to $413.32. Now, the market is consolidating near $398.64, and the next move could be important.
📊 4H Technical Outlook
Current Price: $398.64
RSI(6): 49.60 – Neutral momentum
Bollinger Upper: $414.97
Bollinger Middle: $398.89
Bollinger Lower: $382.81
🟢 Bullish Scenario: A confirmed breakout above $405 could open the way toward:
$413.32
$414.97
$430.00
🔴 Bearish Scenario: A breakdown below $380.76 could expose lower support levels:
$365.00
$350.00
$331.00
🔥 Fundamental Perspective
AppLovin delivered impressive Q3 2026 results, with revenue increasing 55% year-over-year and net income rising 72%.
Its strong profitability and AI-driven advertising technology provide a positive fundamental backdrop.
🎯 My Trading Bias:
Cautiously BULLISH, but I want confirmation above $405 before considering a LONG position.
A breakdown below $380.76 would invalidate this bullish setup and shift my attention toward the SHORT scenario.
The key question: Is APPB preparing for another breakout, or will sellers take control below $400?
My conclusion: APPB has stronger fundamental support than its current technical momentum suggests. I would wait for the $405 breakout before committing to a LONG trade.
$APPB #APPBUSDT #TradingIdeas
APPB has experienced a remarkable rally, climbing from $225.74 to $413.32. Now, the market is consolidating near $398.64, and the next move could be important.
📊 4H Technical Outlook
Current Price: $398.64
RSI(6): 49.60 – Neutral momentum
Bollinger Upper: $414.97
Bollinger Middle: $398.89
Bollinger Lower: $382.81
🟢 Bullish Scenario: A confirmed breakout above $405 could open the way toward:
$413.32
$414.97
$430.00
🔴 Bearish Scenario: A breakdown below $380.76 could expose lower support levels:
$365.00
$350.00
$331.00
🔥 Fundamental Perspective
AppLovin delivered impressive Q3 2026 results, with revenue increasing 55% year-over-year and net income rising 72%.
Its strong profitability and AI-driven advertising technology provide a positive fundamental backdrop.
🎯 My Trading Bias:
Cautiously BULLISH, but I want confirmation above $405 before considering a LONG position.
A breakdown below $380.76 would invalidate this bullish setup and shift my attention toward the SHORT scenario.
The key question: Is APPB preparing for another breakout, or will sellers take control below $400?
My conclusion: APPB has stronger fundamental support than its current technical momentum suggests. I would wait for the $405 breakout before committing to a LONG trade.
$APPB #APPBUSDT #TradingIdeas
68
·
--
🚀 AGTUSDT: Bullish Breakout or the Beginning of a Major Correction?
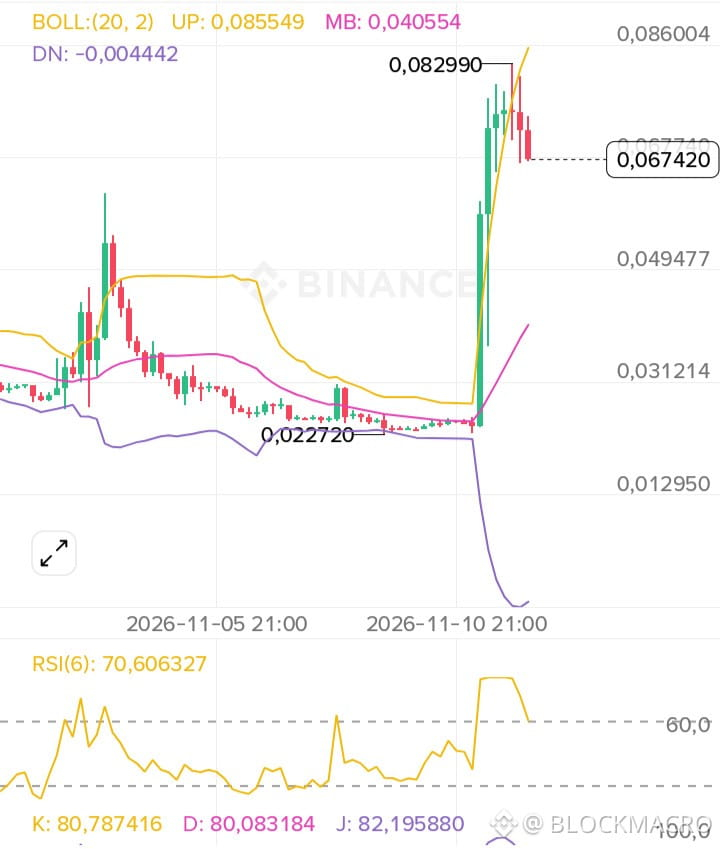
AGT has delivered an explosive rally, climbing from $0.02270 to a recent high of $0.08299. But after such an aggressive move, the market is facing an important decision.
📊 4H Technical Analysis
Current price on the chart: $0.06742
RSI(6): 70.61 – strong momentum, but correction risk remains.
Bollinger Upper Band: $0.08555
Bollinger Middle Band: $0.04055
Recent resistance: $0.07800–$0.08300
🟢 Bullish Scenario – LONG A successful retest of $0.06800–$0.07100, followed by a strong 4H bullish candle, could create an opportunity for another upward move.
Targets:
TP1: $0.07800
TP2: $0.08300
TP3: $0.08550
🔴 Bearish Scenario – SHORT A confirmed 4H breakdown below $0.06500 could signal deeper profit-taking.
Potential targets:
TP1: $0.06000
TP2: $0.05500
TP3: $0.04800
🔥 Fundamental Perspective
AGT is connected to the Alaya AI ecosystem, operating at the intersection of artificial intelligence, blockchain, and decentralized data.
The AI narrative provides potential long-term interest, but token supply dynamics, unlock events, speculative positioning, and market liquidity remain important risks.
My Strategy: I remain cautiously bullish on the broader structure, but I won't chase the rally. I want confirmation of support before considering a LONG position.
⚡ Let's debate:
After a rally of more than 260% from the recent low, is AGT preparing for another leg higher, or are buyers about to get trapped?
Are you LONG or SHORT?
$AGT #AGTUSDT #TradingIdeas
🚀 AGTUSDT: Bullish Breakout or the Beginning of a Major Correction?
AGT has delivered an explosive rally, climbing from $0.02270 to a recent high of $0.08299. But after such an aggressive move, the market is facing an important decision.
📊 4H Technical Analysis
Current price on the chart: $0.06742
RSI(6): 70.61 – strong momentum, but correction risk remains.
Bollinger Upper Band: $0.08555
Bollinger Middle Band: $0.04055
Recent resistance: $0.07800–$0.08300
🟢 Bullish Scenario – LONG A successful retest of $0.06800–$0.07100, followed by a strong 4H bullish candle, could create an opportunity for another upward move.
Targets:
TP1: $0.07800
TP2: $0.08300
TP3: $0.08550
🔴 Bearish Scenario – SHORT A confirmed 4H breakdown below $0.06500 could signal deeper profit-taking.
Potential targets:
TP1: $0.06000
TP2: $0.05500
TP3: $0.04800
🔥 Fundamental Perspective
AGT is connected to the Alaya AI ecosystem, operating at the intersection of artificial intelligence, blockchain, and decentralized data.
The AI narrative provides potential long-term interest, but token supply dynamics, unlock events, speculative positioning, and market liquidity remain important risks.
My Strategy: I remain cautiously bullish on the broader structure, but I won't chase the rally. I want confirmation of support before considering a LONG position.
⚡ Let's debate:
After a rally of more than 260% from the recent low, is AGT preparing for another leg higher, or are buyers about to get trapped?
Are you LONG or SHORT?
$AGT #AGTUSDT #TradingIdeas
AGT has delivered an explosive rally, climbing from $0.02270 to a recent high of $0.08299. But after such an aggressive move, the market is facing an important decision.
📊 4H Technical Analysis
Current price on the chart: $0.06742
RSI(6): 70.61 – strong momentum, but correction risk remains.
Bollinger Upper Band: $0.08555
Bollinger Middle Band: $0.04055
Recent resistance: $0.07800–$0.08300
🟢 Bullish Scenario – LONG A successful retest of $0.06800–$0.07100, followed by a strong 4H bullish candle, could create an opportunity for another upward move.
Targets:
TP1: $0.07800
TP2: $0.08300
TP3: $0.08550
🔴 Bearish Scenario – SHORT A confirmed 4H breakdown below $0.06500 could signal deeper profit-taking.
Potential targets:
TP1: $0.06000
TP2: $0.05500
TP3: $0.04800
🔥 Fundamental Perspective
AGT is connected to the Alaya AI ecosystem, operating at the intersection of artificial intelligence, blockchain, and decentralized data.
The AI narrative provides potential long-term interest, but token supply dynamics, unlock events, speculative positioning, and market liquidity remain important risks.
My Strategy: I remain cautiously bullish on the broader structure, but I won't chase the rally. I want confirmation of support before considering a LONG position.
⚡ Let's debate:
After a rally of more than 260% from the recent low, is AGT preparing for another leg higher, or are buyers about to get trapped?
Are you LONG or SHORT?
$AGT #AGTUSDT #TradingIdeas
345
·
--
🚀 ERA (Caldera) – Bullish LONG Setup | Technical & Fundamental Analysis
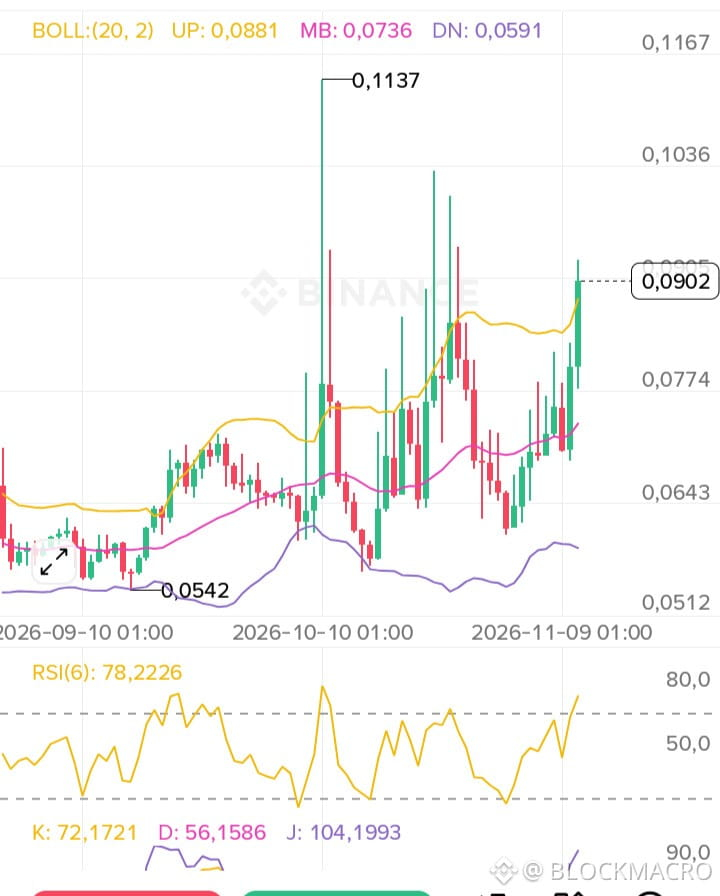
1. Technical Analysis (Daily Timeframe)
ERA is showing strong bullish momentum after breaking above its upper Bollinger Band.
Current reference price: $0.0902
RSI (6): 78.22 – Overbought, suggesting a possible short-term pullback.
Bollinger Upper Band: $0.0881
Middle Band: $0.0736
KDJ: Bullish momentum, with J above 100.
The price structure shows higher highs and higher lows, supporting a bullish market structure.
2. Fundamental Outlook
Caldera is building blockchain infrastructure through its Metalayer technology, designed to improve interoperability between rollups.
Its ecosystem and infrastructure-focused approach provide a potential long-term growth narrative.
However, traders should monitor token unlocks scheduled for November 17, 2026, as additional supply could create short-term selling pressure.
3. LONG Trading Setup
📍 Entry Zone: $0.0860 – $0.0880
🛑 Stop Loss: $0.0805
🎯 Take Profit Targets:
TP1: $0.0950
TP2: $0.1036
TP3: $0.1130
4. Market Scenarios
Bullish scenario: A successful retest of $0.0881 followed by strong buying pressure could open the way toward $0.1036 and potentially $0.1130.
Bearish invalidation: A daily close below $0.0805 would weaken the bullish setup and increase the probability of a deeper correction.
My Verdict: BULLISH – LONG BIAS
I favor buying the pullback rather than chasing the current breakout. Confirmation is essential, especially with the upcoming token unlock.
⚠️ This is a conditional trading setup, not a guaranteed outcome. Always manage risk and avoid entering without confirmation.
What do you think? Can ERA reach $0.1130 before the token unlock, or will sellers take control first?
$ERA #TradingIdeas
🚀 ERA (Caldera) – Bullish LONG Setup | Technical & Fundamental Analysis
1. Technical Analysis (Daily Timeframe)
ERA is showing strong bullish momentum after breaking above its upper Bollinger Band.
Current reference price: $0.0902
RSI (6): 78.22 – Overbought, suggesting a possible short-term pullback.
Bollinger Upper Band: $0.0881
Middle Band: $0.0736
KDJ: Bullish momentum, with J above 100.
The price structure shows higher highs and higher lows, supporting a bullish market structure.
2. Fundamental Outlook
Caldera is building blockchain infrastructure through its Metalayer technology, designed to improve interoperability between rollups.
Its ecosystem and infrastructure-focused approach provide a potential long-term growth narrative.
However, traders should monitor token unlocks scheduled for November 17, 2026, as additional supply could create short-term selling pressure.
3. LONG Trading Setup
📍 Entry Zone: $0.0860 – $0.0880
🛑 Stop Loss: $0.0805
🎯 Take Profit Targets:
TP1: $0.0950
TP2: $0.1036
TP3: $0.1130
4. Market Scenarios
Bullish scenario: A successful retest of $0.0881 followed by strong buying pressure could open the way toward $0.1036 and potentially $0.1130.
Bearish invalidation: A daily close below $0.0805 would weaken the bullish setup and increase the probability of a deeper correction.
My Verdict: BULLISH – LONG BIAS
I favor buying the pullback rather than chasing the current breakout. Confirmation is essential, especially with the upcoming token unlock.
⚠️ This is a conditional trading setup, not a guaranteed outcome. Always manage risk and avoid entering without confirmation.
What do you think? Can ERA reach $0.1130 before the token unlock, or will sellers take control first?
$ERA #TradingIdeas
1. Technical Analysis (Daily Timeframe)
ERA is showing strong bullish momentum after breaking above its upper Bollinger Band.
Current reference price: $0.0902
RSI (6): 78.22 – Overbought, suggesting a possible short-term pullback.
Bollinger Upper Band: $0.0881
Middle Band: $0.0736
KDJ: Bullish momentum, with J above 100.
The price structure shows higher highs and higher lows, supporting a bullish market structure.
2. Fundamental Outlook
Caldera is building blockchain infrastructure through its Metalayer technology, designed to improve interoperability between rollups.
Its ecosystem and infrastructure-focused approach provide a potential long-term growth narrative.
However, traders should monitor token unlocks scheduled for November 17, 2026, as additional supply could create short-term selling pressure.
3. LONG Trading Setup
📍 Entry Zone: $0.0860 – $0.0880
🛑 Stop Loss: $0.0805
🎯 Take Profit Targets:
TP1: $0.0950
TP2: $0.1036
TP3: $0.1130
4. Market Scenarios
Bullish scenario: A successful retest of $0.0881 followed by strong buying pressure could open the way toward $0.1036 and potentially $0.1130.
Bearish invalidation: A daily close below $0.0805 would weaken the bullish setup and increase the probability of a deeper correction.
My Verdict: BULLISH – LONG BIAS
I favor buying the pullback rather than chasing the current breakout. Confirmation is essential, especially with the upcoming token unlock.
⚠️ This is a conditional trading setup, not a guaranteed outcome. Always manage risk and avoid entering without confirmation.
What do you think? Can ERA reach $0.1130 before the token unlock, or will sellers take control first?
$ERA #TradingIdeas
1
164

·
--
$ETH #Ethereum
Keep your eyes on Ethereum...
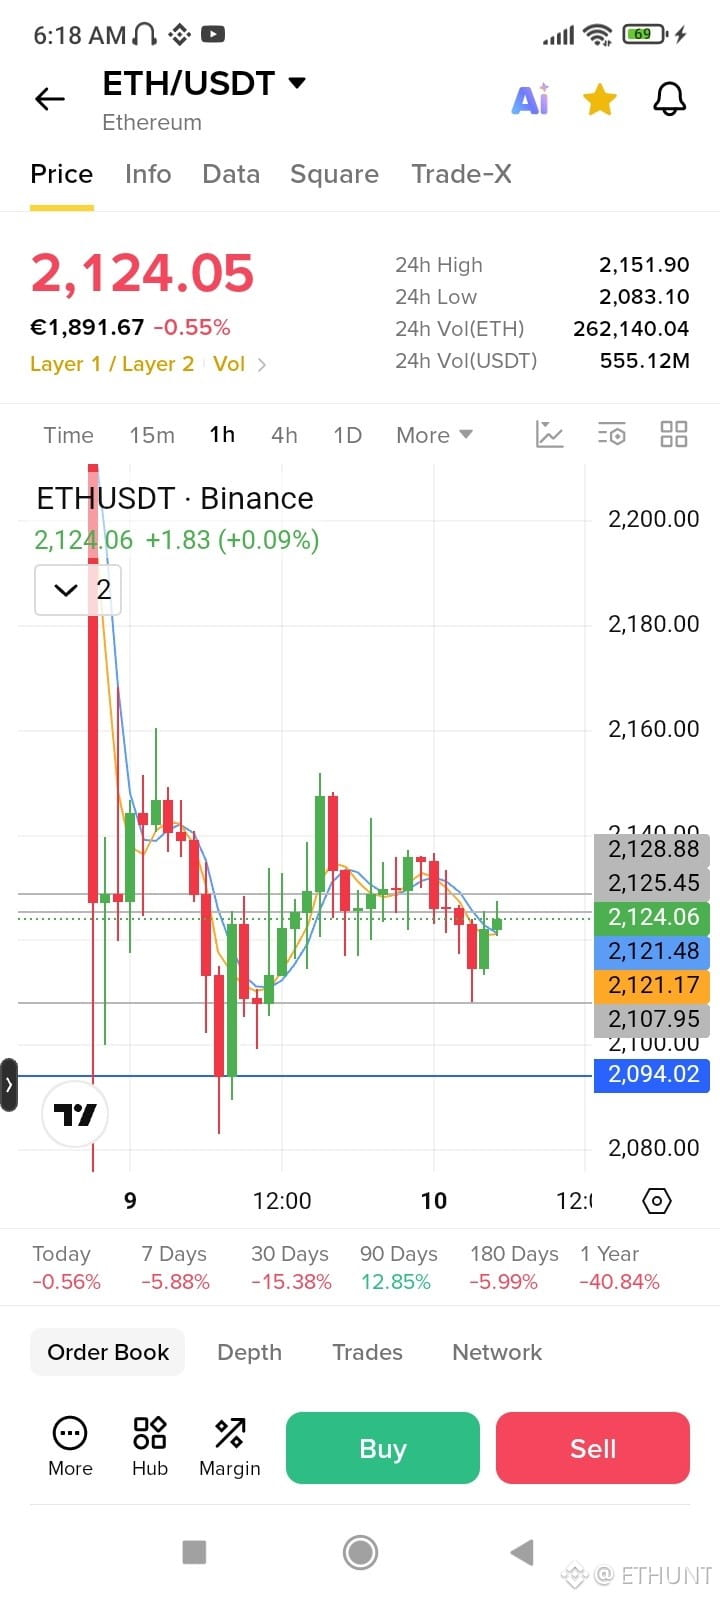
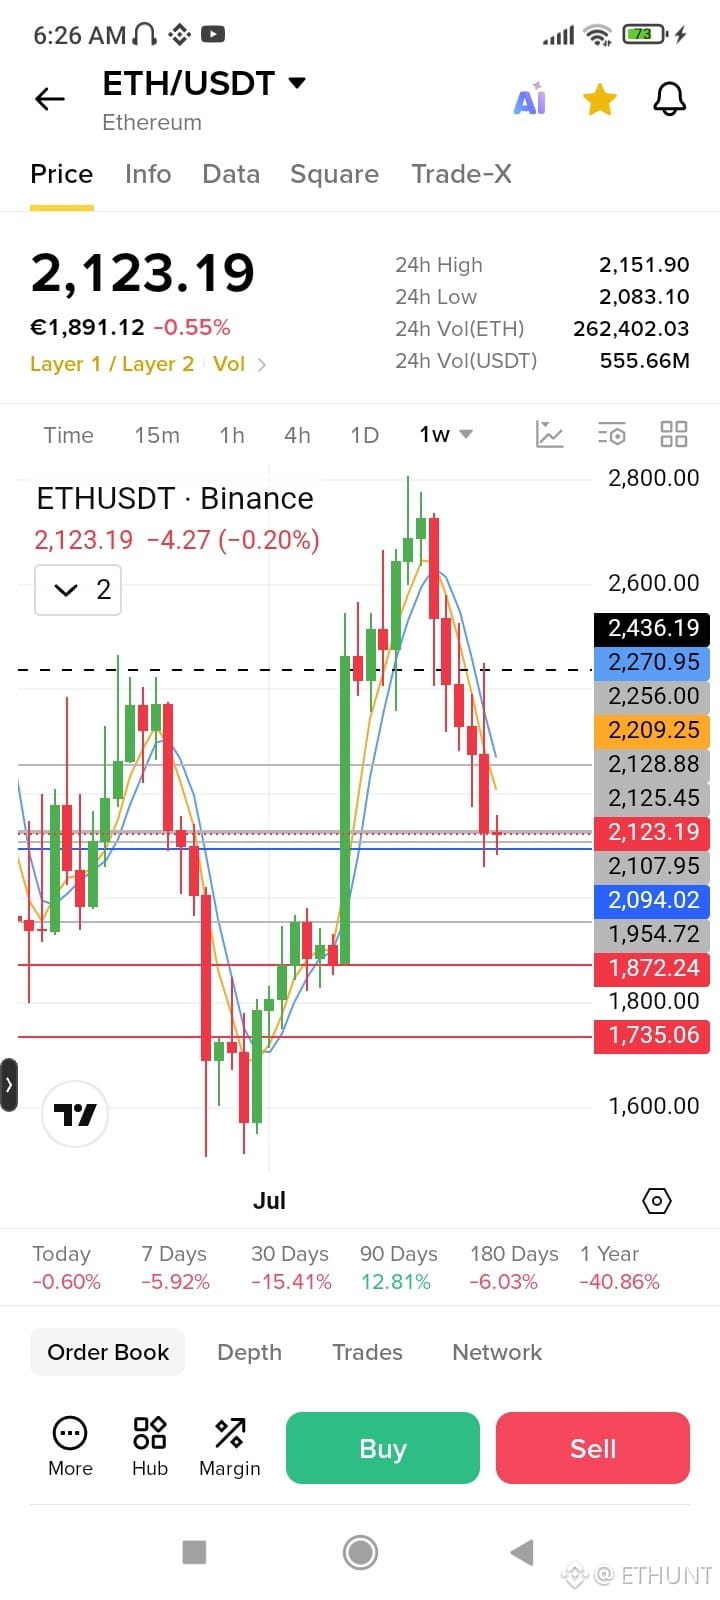
If ETH manages to stay below the 2125.45 level on the 1-hour chart, it will drop again to retest 2094.02.
And if a 4-hour candle closes below 2094.02 and price holds below it, as I mentioned in my previous post, we're most likely going to witness a bearish rally, initially targeting 1955.00, followed by 1872.00–1735.00
#TradingSignals #TradingIdeas
{future}(ETHUSDT)
$ETH #Ethereum
Keep your eyes on Ethereum...
If ETH manages to stay below the 2125.45 level on the 1-hour chart, it will drop again to retest 2094.02.
And if a 4-hour candle closes below 2094.02 and price holds below it, as I mentioned in my previous post, we're most likely going to witness a bearish rally, initially targeting 1955.00, followed by 1872.00–1735.00
#TradingSignals #TradingIdeas
Keep your eyes on Ethereum...
If ETH manages to stay below the 2125.45 level on the 1-hour chart, it will drop again to retest 2094.02.
And if a 4-hour candle closes below 2094.02 and price holds below it, as I mentioned in my previous post, we're most likely going to witness a bearish rally, initially targeting 1955.00, followed by 1872.00–1735.00
#TradingSignals #TradingIdeas
1
1
71
·
--
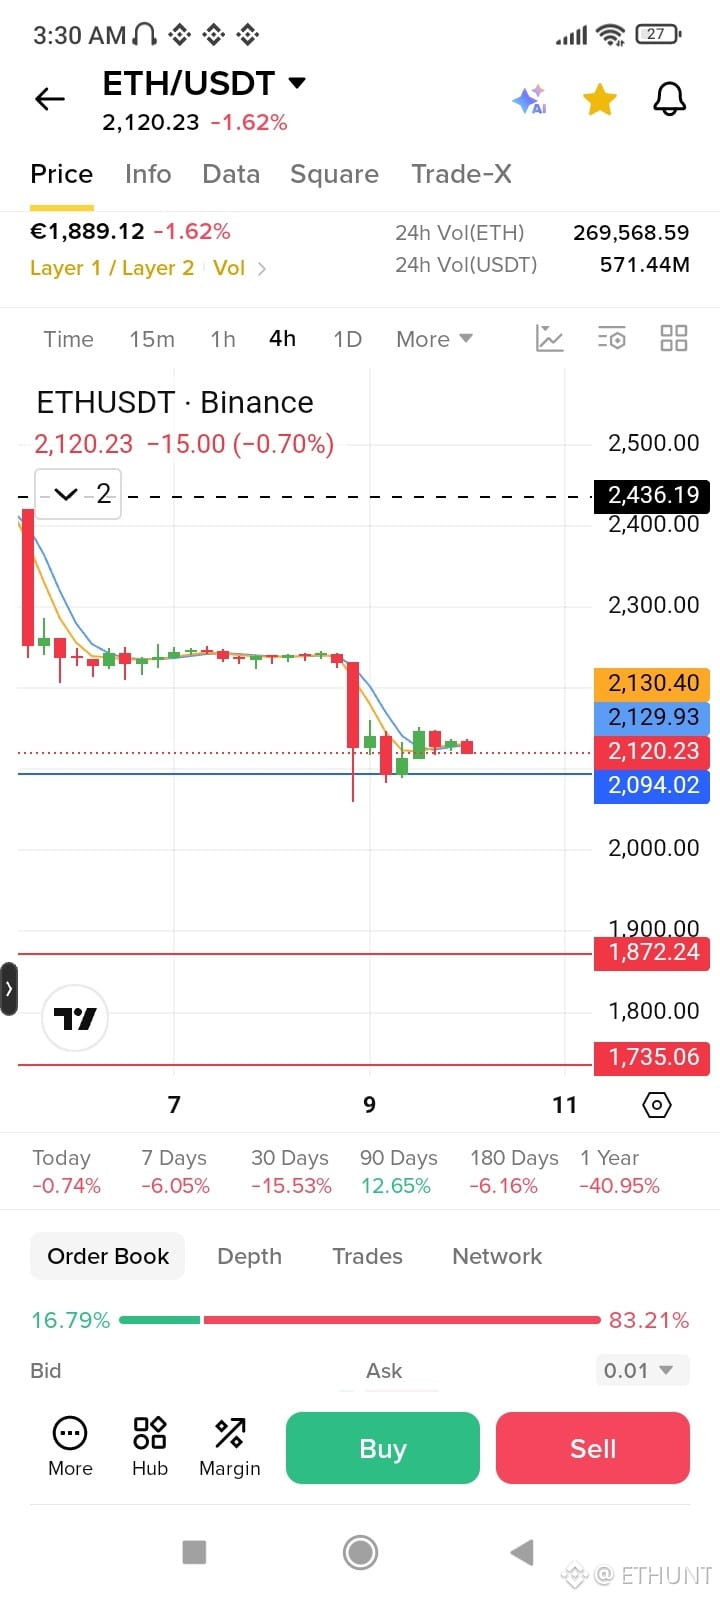
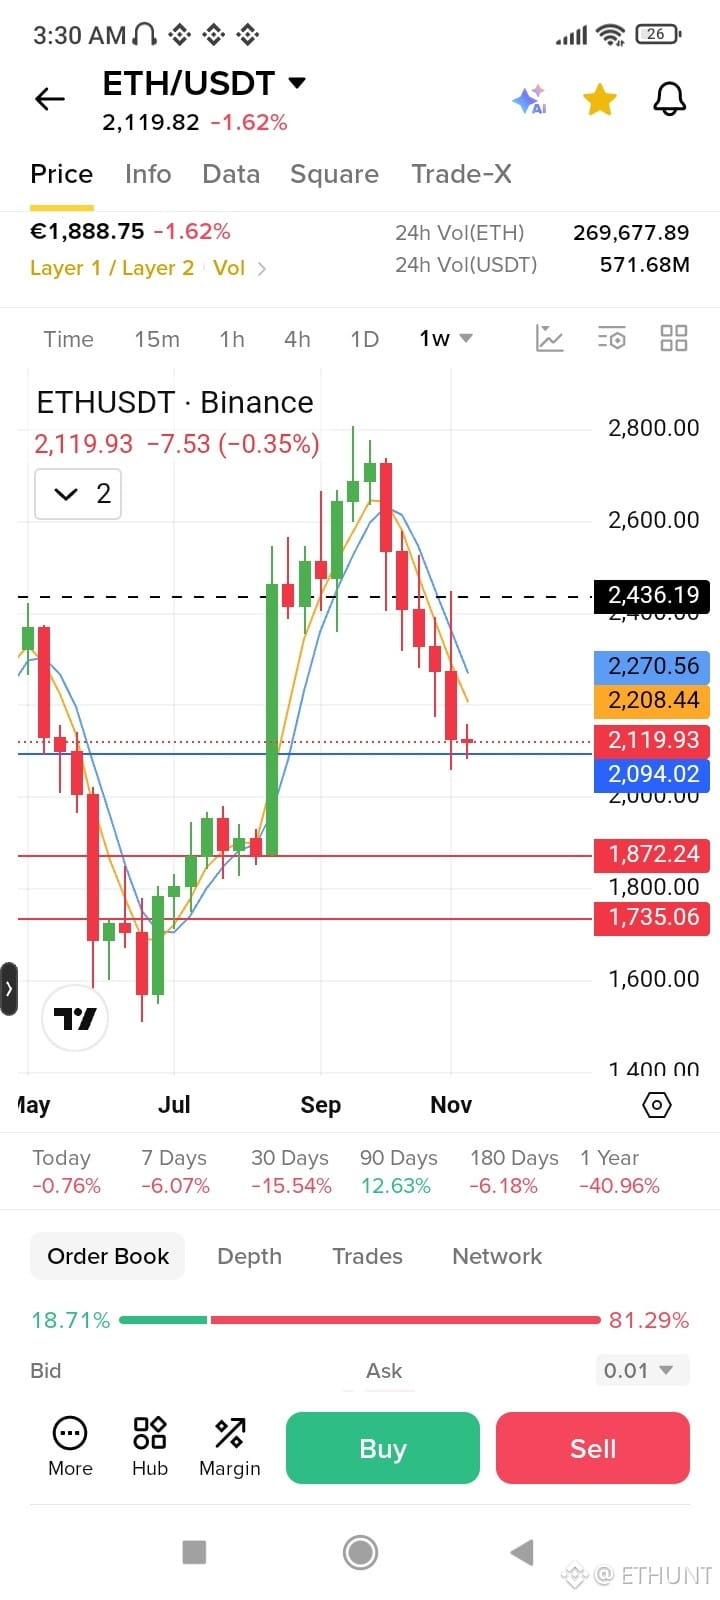
If $ETH 4-hour candle closes below 2094.02 and holds below this level, there is a strong possibility of further downside, potentially reaching the 1872.00–1735.00 levels.
#Ethereum #TradingSignals #TradingIdeas
{future}(ETHUSDT)
If $ETH 4-hour candle closes below 2094.02 and holds below this level, there is a strong possibility of further downside, potentially reaching the 1872.00–1735.00 levels.
#Ethereum #TradingSignals #TradingIdeas
#Ethereum #TradingSignals #TradingIdeas
BLOCKMACRO:
agreed
1
1
82

$COTI — Privacy-focused payment infrastructure gives COTI a distinctive position in the blockchain market; watch ecosystem adoption and rising spot volume for signs of renewed buyer interest.
{spot}(COTIUSDT)
$DYM — Dymension's modular blockchain approach connects with the growing rollup narrative; expanding ecosystem activity could improve sentiment if the token manages to reclaim important resistance.
{spot}(DYMUSDT)
$SFP — SafePal benefits from the growing demand for secure crypto self-custody, and increased wallet adoption could strengthen its utility narrative; monitor whether buyers support a sustained recovery.
{spot}(SFPUSDT)
#COTI #DYM #SFP #CryptoAnalysis #TradingIdeas
$COTI — Privacy-focused payment infrastructure gives COTI a distinctive position in the blockchain market; watch ecosystem adoption and rising spot volume for signs of renewed buyer interest.
$DYM — Dymension's modular blockchain approach connects with the growing rollup narrative; expanding ecosystem activity could improve sentiment if the token manages to reclaim important resistance.
$SFP — SafePal benefits from the growing demand for secure crypto self-custody, and increased wallet adoption could strengthen its utility narrative; monitor whether buyers support a sustained recovery.
#COTI #DYM #SFP #CryptoAnalysis #TradingIdeas
$DYM — Dymension's modular blockchain approach connects with the growing rollup narrative; expanding ecosystem activity could improve sentiment if the token manages to reclaim important resistance.
$SFP — SafePal benefits from the growing demand for secure crypto self-custody, and increased wallet adoption could strengthen its utility narrative; monitor whether buyers support a sustained recovery.
#COTI #DYM #SFP #CryptoAnalysis #TradingIdeas

1
76

·
--
🐻 $DOGE /USDT | SHORT SETUP
DOGE is facing another rejection near resistance, suggesting buyers are struggling to maintain upward momentum. Sellers are stepping back in, making the downside scenario worth watching.
Trade Parameters:
📍 Direction: SHORT
⚡ Leverage: 33x
🎯 Entry: 0.07116 – 0.07127
🛑 Stop Loss: 0.07235
Profit Targets:
- TP1: 0.06945
- TP2: 0.06827
- TP3: 0.06629
Market Outlook:
As long as DOGE remains under the resistance area, bearish pressure could continue. Watch for confirmation around the entry zone before considering the setup.
Trade smart, protect your capital, and don't let leverage control your decisions.
#DOGE #GateSquare #CryptoTrading #TradingIdeas #BinanceReopensWithdrawalsForHYPE&APT #SouthKoreaDraftLawTargets15To20%ShareholderCap #TradFiForBeginners
🐻 $DOGE /USDT | SHORT SETUP
DOGE is facing another rejection near resistance, suggesting buyers are struggling to maintain upward momentum. Sellers are stepping back in, making the downside scenario worth watching.
Trade Parameters:
📍 Direction: SHORT
⚡ Leverage: 33x
🎯 Entry: 0.07116 – 0.07127
🛑 Stop Loss: 0.07235
Profit Targets:
- TP1: 0.06945
- TP2: 0.06827
- TP3: 0.06629
Market Outlook:
As long as DOGE remains under the resistance area, bearish pressure could continue. Watch for confirmation around the entry zone before considering the setup.
Trade smart, protect your capital, and don't let leverage control your decisions.
#DOGE #GateSquare #CryptoTrading #TradingIdeas #BinanceReopensWithdrawalsForHYPE&APT #SouthKoreaDraftLawTargets15To20%ShareholderCap #TradFiForBeginners
DOGE is facing another rejection near resistance, suggesting buyers are struggling to maintain upward momentum. Sellers are stepping back in, making the downside scenario worth watching.
Trade Parameters:
📍 Direction: SHORT
⚡ Leverage: 33x
🎯 Entry: 0.07116 – 0.07127
🛑 Stop Loss: 0.07235
Profit Targets:
- TP1: 0.06945
- TP2: 0.06827
- TP3: 0.06629
Market Outlook:
As long as DOGE remains under the resistance area, bearish pressure could continue. Watch for confirmation around the entry zone before considering the setup.
Trade smart, protect your capital, and don't let leverage control your decisions.
#DOGE #GateSquare #CryptoTrading #TradingIdeas #BinanceReopensWithdrawalsForHYPE&APT #SouthKoreaDraftLawTargets15To20%ShareholderCap #TradFiForBeginners
45
·
--
🔻 $GTC /USDT — SHORT OPPORTUNITY
GTC is approaching a potential selling zone. If bearish pressure continues and buyers fail to defend the price, another leg down could follow.
Trade Direction: SHORT 📉
Entry: 0.172 – 0.176
Stop Loss: 0.190
Target Levels:
🎯 TP1: 0.169
🎯 TP2: 0.163
🎯 TP3: 0.160
Watch the entry zone closely and avoid chasing the move. Confirmation matters more than rushing into a trade.
Stay disciplined and manage your risk.
#GTC #GateSquare #TradingIdeas #BinanceReopensWithdrawalsForHYPE&APT #SouthKoreaDraftLawTargets15To20%ShareholderCap #TradFiForBeginners
🔻 $GTC /USDT — SHORT OPPORTUNITY
GTC is approaching a potential selling zone. If bearish pressure continues and buyers fail to defend the price, another leg down could follow.
Trade Direction: SHORT 📉
Entry: 0.172 – 0.176
Stop Loss: 0.190
Target Levels:
🎯 TP1: 0.169
🎯 TP2: 0.163
🎯 TP3: 0.160
Watch the entry zone closely and avoid chasing the move. Confirmation matters more than rushing into a trade.
Stay disciplined and manage your risk.
#GTC #GateSquare #TradingIdeas #BinanceReopensWithdrawalsForHYPE&APT #SouthKoreaDraftLawTargets15To20%ShareholderCap #TradFiForBeginners
GTC is approaching a potential selling zone. If bearish pressure continues and buyers fail to defend the price, another leg down could follow.
Trade Direction: SHORT 📉
Entry: 0.172 – 0.176
Stop Loss: 0.190
Target Levels:
🎯 TP1: 0.169
🎯 TP2: 0.163
🎯 TP3: 0.160
Watch the entry zone closely and avoid chasing the move. Confirmation matters more than rushing into a trade.
Stay disciplined and manage your risk.
#GTC #GateSquare #TradingIdeas #BinanceReopensWithdrawalsForHYPE&APT #SouthKoreaDraftLawTargets15To20%ShareholderCap #TradFiForBeginners
60

·
--
🔴 $XPL | SHORT SETUP
XPL is on the radar for a potential bearish move. Sellers will be looking to defend the resistance zone, making this an important area to watch.
📉 Trade Plan: SHORT $XPL
Entry Zone: $0.0580 – $0.0592
Stop Loss: $0.0635
🎯 Profit Targets
- TP1: $0.0570
- TP2: $0.0548
- TP3: $0.0535
Keep risk management in focus and avoid chasing the move. Let price confirm the setup before entering.
#XPL #TradingIdeas #Binance
🔴 $XPL | SHORT SETUP
XPL is on the radar for a potential bearish move. Sellers will be looking to defend the resistance zone, making this an important area to watch.
📉 Trade Plan: SHORT $XPL
Entry Zone: $0.0580 – $0.0592
Stop Loss: $0.0635
🎯 Profit Targets
- TP1: $0.0570
- TP2: $0.0548
- TP3: $0.0535
Keep risk management in focus and avoid chasing the move. Let price confirm the setup before entering.
#XPL #TradingIdeas #Binance
XPL is on the radar for a potential bearish move. Sellers will be looking to defend the resistance zone, making this an important area to watch.
📉 Trade Plan: SHORT $XPL
Entry Zone: $0.0580 – $0.0592
Stop Loss: $0.0635
🎯 Profit Targets
- TP1: $0.0570
- TP2: $0.0548
- TP3: $0.0535
Keep risk management in focus and avoid chasing the move. Let price confirm the setup before entering.
#XPL #TradingIdeas #Binance
95

Market-wide selling can create sharp price swings. Keep your trading plan flexible and your risk controlled.
$PYTH — Watch for stronger volume and a sustained move above the nearest resistance.
$ALGO — Price stability around support could be an early sign of improving buyer interest.
$VET — Compare its performance with the wider altcoin market to spot relative strength or weakness.
#PYTH #ALGO #VET #MarketAnalysis #tradingIdeas
Market-wide selling can create sharp price swings. Keep your trading plan flexible and your risk controlled.
$PYTH — Watch for stronger volume and a sustained move above the nearest resistance.
$ALGO — Price stability around support could be an early sign of improving buyer interest.
$VET — Compare its performance with the wider altcoin market to spot relative strength or weakness.
#PYTH #ALGO #VET #MarketAnalysis #tradingIdeas
$PYTH — Watch for stronger volume and a sustained move above the nearest resistance.
$ALGO — Price stability around support could be an early sign of improving buyer interest.
$VET — Compare its performance with the wider altcoin market to spot relative strength or weakness.
#PYTH #ALGO #VET #MarketAnalysis #tradingIdeas
4
Log in to explore more content
Join global crypto users on Binance Square
⚡️ Get latest and useful information about crypto.
💬 Trusted by the world’s largest crypto exchange.
👍 Discover real insights from verified creators.
Email / Phone number
Trending Topics
1
#HuangRisksOusterOverReportedAffairWithSubordinate
60,361 views
832 Discussing
2
#AnthropicRejectsIPODelayValuationinQuestion
517,975 views
4,223 Discussing
3
#CoreWeaveJumps10%On168%RevenueGrowth
91,174 views
1,071 Discussing
4
#ZcashFallsBelow$1000ForFirstTimeSinceSeptember
49,430 views
214 Discussing
5
#MSCIRemovalMayCurbStrategy’sBitcoinBuying
11,419 views
188 Discussing
6
#HKSFCSaysTokenizationMovingToCommercialUse
315 views
20 Discussing
7
#CanNvidiaEarningsEaseMarketConcerns?
199,907 views
1,981 Discussing
8
#SouthKoreaToLetExchangesSuspendWithdrawalsOnSuspectedHacks
203 views
12 Discussing
9
#PythAddsNYSERealTimeDataToMarketplace
5,343 views
132 Discussing
10
#SolanaCompanyReports$3.4MQ3Revenue
1,465 views
30 Discussing