
#tradfiforbeginners
tradfiforbeginners
Hot
Latest



Article
The TradFi List for Crypto UsersDividends, yield, collateral, spread, spot price. All of it came from traditional finance long before the first block was mined.
TradFi and crypto are fascinating in their own ways. Different, yet related.
Here is a curated list to boost your knowledge! 👇
🎯 Must watch
🔸 [From TradFi to Crypto](https://www.binance.com/en/academy/track/from-tradfi-to-crypto): maps the concepts across, and the main differences.
🔸 [Understanding Stocks](https://www.binance.com/en/academy/track/understanding-stocks): equity, explained from zero. From shares and dividends to risk management.
🔸 [Understanding Bonds](https://www.binance.com/en/academy/track/understanding-bonds): debt, coupons, yields, and why they affect all other markets.
📚 Reading
Read these four, in this order:
🔸 [Stock Trading for Beginners](https://www.binance.com/en/academy/articles/stock-trading-for-beginners-your-first-steps-to-take). For the first steps.
🔸 [Types of Stocks: Dividends, Growth, Value, and More](https://www.binance.com/en/academy/articles/types-of-stocks-dividends-growth-value-etfs-and-more). The different kinds, side by side.
🔸 [How Do Dividend Stocks Work?](https://www.binance.com/en/academy/articles/how-do-dividend-stocks-work) To go beyond price.
🔸 [What Is a Stock Sector and How Are Sectors Classified?](https://www.binance.com/en/academy/articles/what-is-a-stock-sector-and-how-are-sectors-classified) For a clear view of the markets and how they react to economic cycles.
🔍 For the full picture
🔸 [A Guide to Stock Trading: The Complete Landscape](https://www.binance.com/en/academy/articles/a-guide-to-stock-trading-the-complete-landscape). Market structure, trading styles, technical and fundamental analysis, trading bots, and more.
🔸 [Tokenized Stocks vs. Traditional Brokerage](https://www.binance.com/en/academy/articles/tokenized-stocks-vs-traditional-brokerage-which-is-better). A fair comparison with pros and cons.
📈 Ready to trade
🔸 [What Is Binance Stocks Trading?](https://www.binance.com/en/academy/articles/what-is-binance-stocks-trading)
🔸 [TradFi Assets You Can Trade on Binance](https://www.binance.com/en/academy/articles/tradfi-assets-you-can-trade-on-binance-futures)
📖 Quick glossary
🔸 [TradFi](https://www.binance.com/en/academy/glossary/tradfi): takes a sentence to learn, and it appears in half the material above.
✅ Pick for me
Want structure? Take the course: [From TradFi to Crypto](https://www.binance.com/en/academy/track/from-tradfi-to-crypto).Got 7 minutes? Read [Stock Trading for Beginners](https://www.binance.com/en/academy/articles/stock-trading-for-beginners-your-first-steps-to-take).
Disclaimer: Educational content only. Not financial advice. Digital asset prices can be volatile. Do your own research.
The TradFi List for Crypto Users
Dividends, yield, collateral, spread, spot price. All of it came from traditional finance long before the first block was mined.
TradFi and crypto are fascinating in their own ways. Different, yet related.
Here is a curated list to boost your knowledge! 👇
🎯 Must watch
🔸 From TradFi to Crypto: maps the concepts across, and the main differences.
🔸 Understanding Stocks: equity, explained from zero. From shares and dividends to risk management.
🔸 Understanding Bonds: debt, coupons, yields, and why they affect all other markets.
📚 Reading
Read these four, in this order:
🔸 Stock Trading for Beginners. For the first steps.
🔸 Types of Stocks: Dividends, Growth, Value, and More. The different kinds, side by side.
🔸 How Do Dividend Stocks Work? To go beyond price.
🔸 What Is a Stock Sector and How Are Sectors Classified? For a clear view of the markets and how they react to economic cycles.
🔍 For the full picture
🔸 A Guide to Stock Trading: The Complete Landscape. Market structure, trading styles, technical and fundamental analysis, trading bots, and more.
🔸 Tokenized Stocks vs. Traditional Brokerage. A fair comparison with pros and cons.
📈 Ready to trade
🔸 What Is Binance Stocks Trading?
🔸 TradFi Assets You Can Trade on Binance
📖 Quick glossary
🔸 TradFi: takes a sentence to learn, and it appears in half the material above.
✅ Pick for me
Want structure? Take the course: From TradFi to Crypto.Got 7 minutes? Read Stock Trading for Beginners.
Disclaimer: Educational content only. Not financial advice. Digital asset prices can be volatile. Do your own research.
TradFi and crypto are fascinating in their own ways. Different, yet related.
Here is a curated list to boost your knowledge! 👇
🎯 Must watch
🔸 From TradFi to Crypto: maps the concepts across, and the main differences.
🔸 Understanding Stocks: equity, explained from zero. From shares and dividends to risk management.
🔸 Understanding Bonds: debt, coupons, yields, and why they affect all other markets.
📚 Reading
Read these four, in this order:
🔸 Stock Trading for Beginners. For the first steps.
🔸 Types of Stocks: Dividends, Growth, Value, and More. The different kinds, side by side.
🔸 How Do Dividend Stocks Work? To go beyond price.
🔸 What Is a Stock Sector and How Are Sectors Classified? For a clear view of the markets and how they react to economic cycles.
🔍 For the full picture
🔸 A Guide to Stock Trading: The Complete Landscape. Market structure, trading styles, technical and fundamental analysis, trading bots, and more.
🔸 Tokenized Stocks vs. Traditional Brokerage. A fair comparison with pros and cons.
📈 Ready to trade
🔸 What Is Binance Stocks Trading?
🔸 TradFi Assets You Can Trade on Binance
📖 Quick glossary
🔸 TradFi: takes a sentence to learn, and it appears in half the material above.
✅ Pick for me
Want structure? Take the course: From TradFi to Crypto.Got 7 minutes? Read Stock Trading for Beginners.
Disclaimer: Educational content only. Not financial advice. Digital asset prices can be volatile. Do your own research.
Crypto Pensioner:
Thanks @CZ
2
16
38k

·
--
$ONE
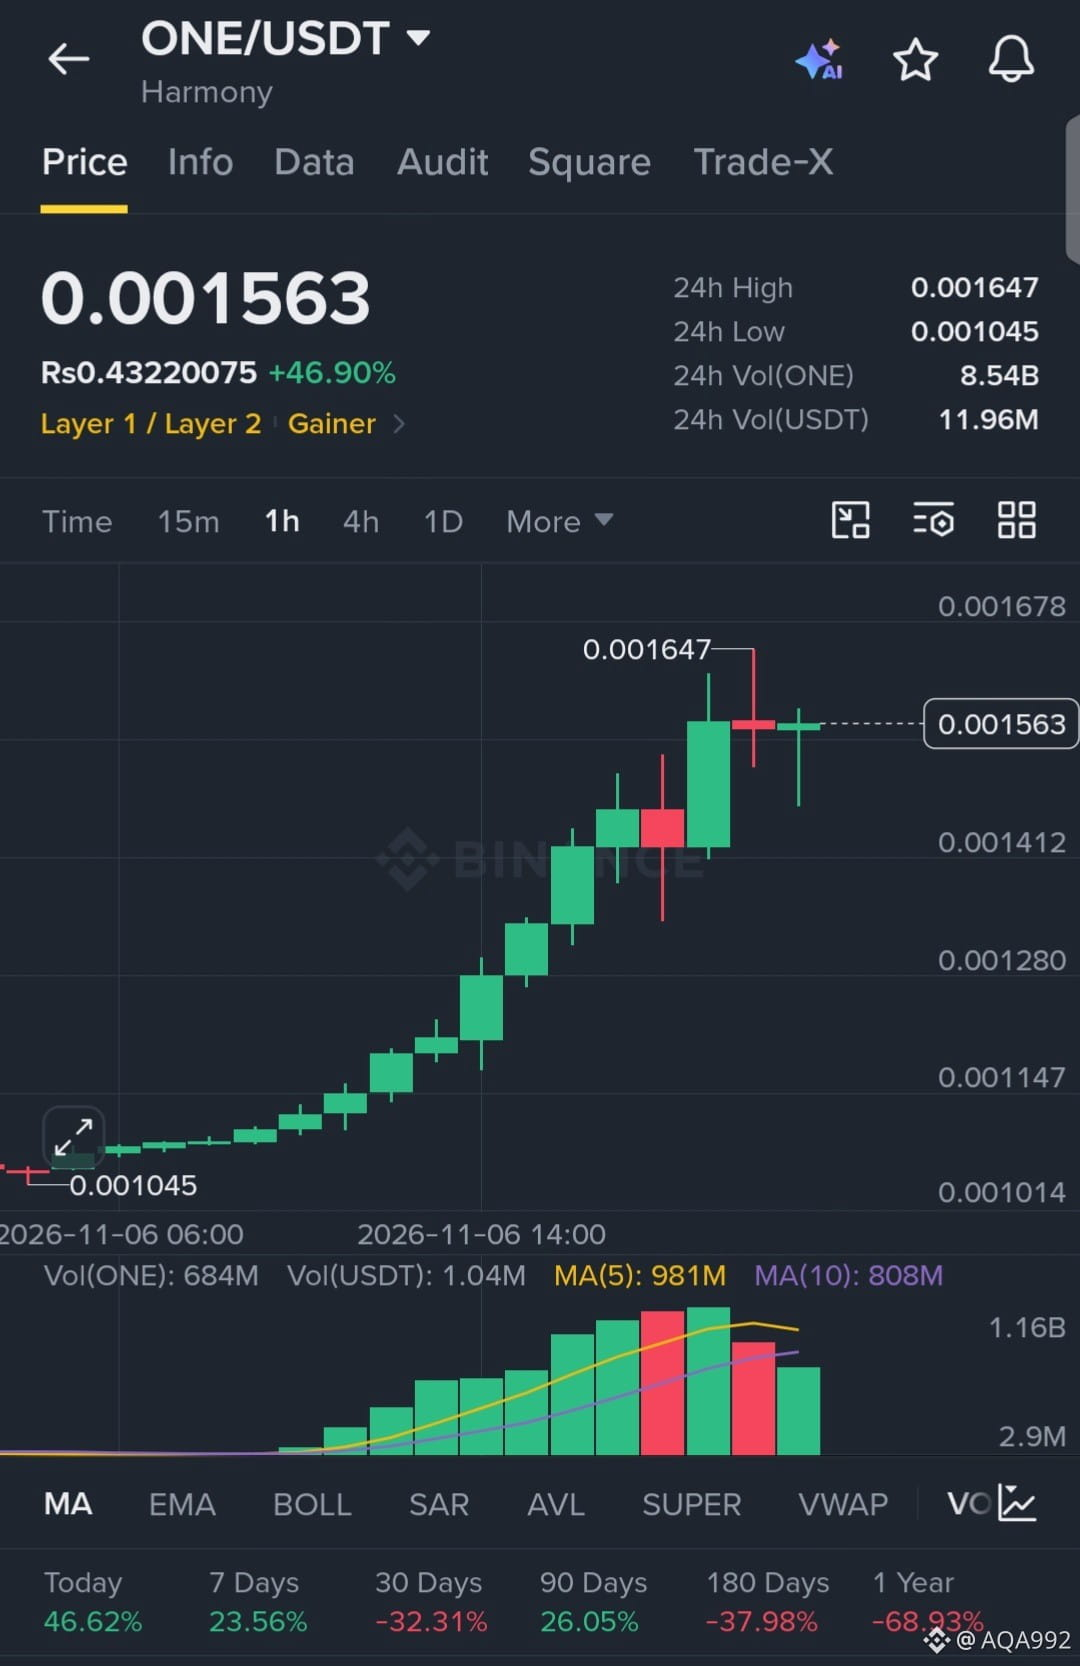
Aggressive volume expansion is fueling a parabolic breakout on the 1H chart. Buyers are in absolute control, defending higher lows with shallow retracements. Price is currently consolidating near local highs, setting up a high-probability continuation play for the next impulsive leg up.
EP: 0.001540 - 0.001570
TP1: 0.001650
TP2: 0.001720
TP3: 0.001800
SL: 0.001480
Execute with precision and respect the stop. $ONE
#JobsReportRaisesHikeOdds
#USNovemberMichiganExpectationsIndexPrelimAt50.9
#TradFiForBeginners
#USMidtermsCouldShakeUpUS-IranTies
#HyperliquidStrategiesHolds38.52MillionHYPE
{future}(ONEUSDT)
$ONE
Aggressive volume expansion is fueling a parabolic breakout on the 1H chart. Buyers are in absolute control, defending higher lows with shallow retracements. Price is currently consolidating near local highs, setting up a high-probability continuation play for the next impulsive leg up.
EP: 0.001540 - 0.001570
TP1: 0.001650
TP2: 0.001720
TP3: 0.001800
SL: 0.001480
Execute with precision and respect the stop. $ONE
#JobsReportRaisesHikeOdds
#USNovemberMichiganExpectationsIndexPrelimAt50.9
#TradFiForBeginners
#USMidtermsCouldShakeUpUS-IranTies
#HyperliquidStrategiesHolds38.52MillionHYPE
Aggressive volume expansion is fueling a parabolic breakout on the 1H chart. Buyers are in absolute control, defending higher lows with shallow retracements. Price is currently consolidating near local highs, setting up a high-probability continuation play for the next impulsive leg up.
EP: 0.001540 - 0.001570
TP1: 0.001650
TP2: 0.001720
TP3: 0.001800
SL: 0.001480
Execute with precision and respect the stop. $ONE
#JobsReportRaisesHikeOdds
#USNovemberMichiganExpectationsIndexPrelimAt50.9
#TradFiForBeginners
#USMidtermsCouldShakeUpUS-IranTies
#HyperliquidStrategiesHolds38.52MillionHYPE
1

$AKE
Write a short AKE latest analysis with picture
🚀 AKEDO (AKE) Latest Market Analysis
Bullish Momentum
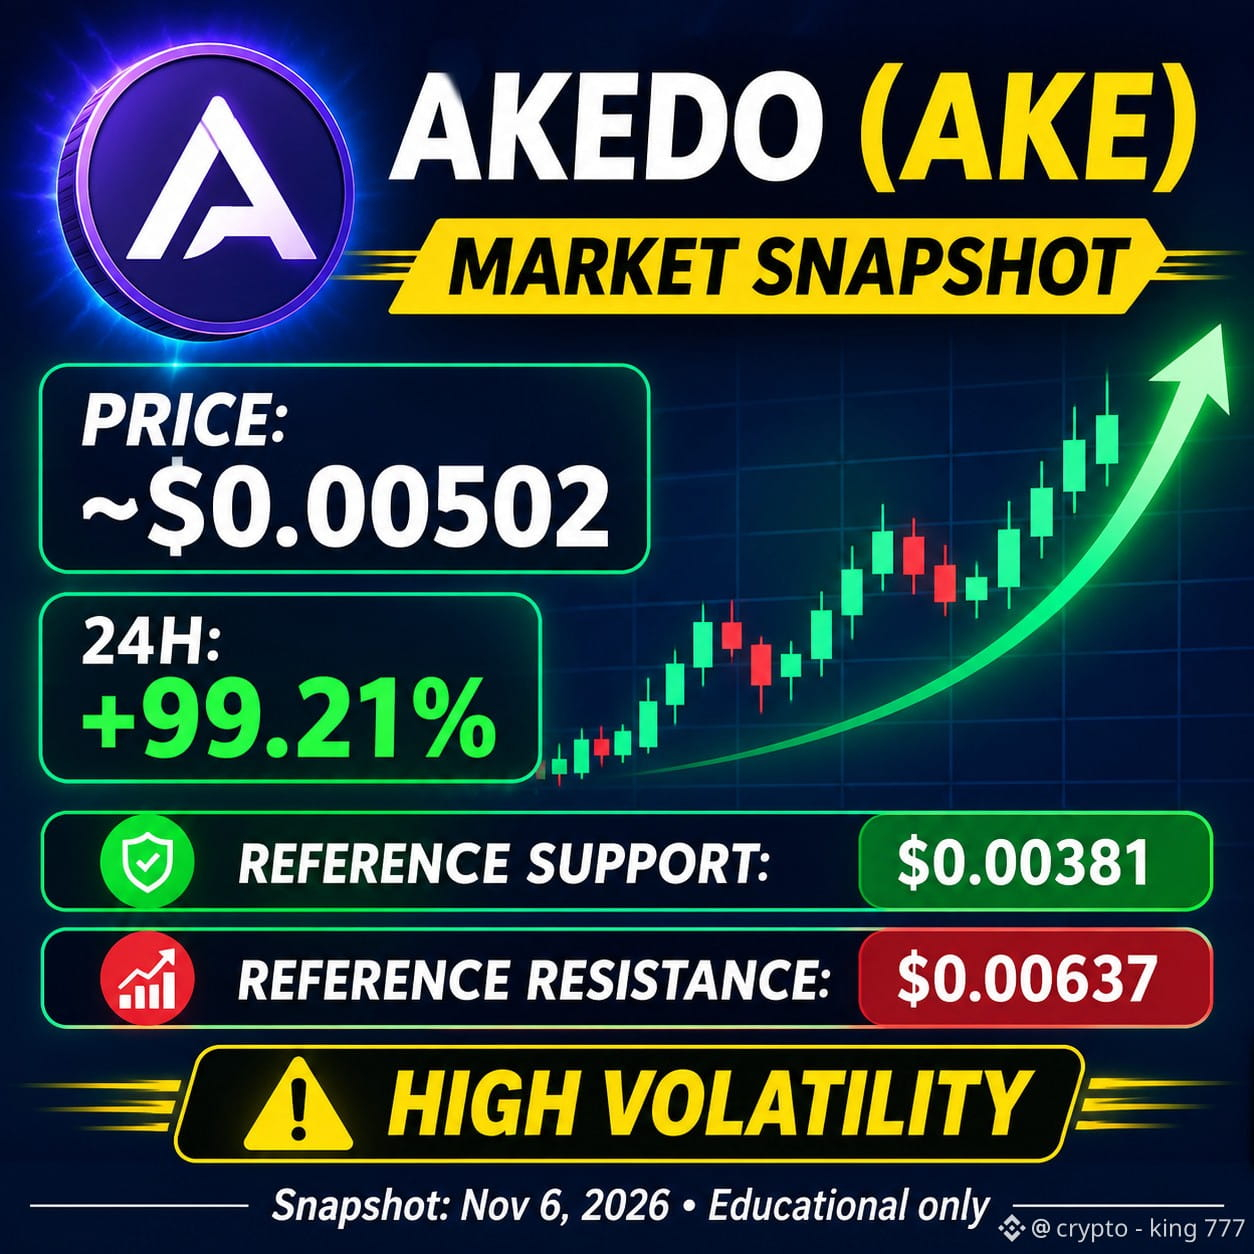
AKEDO (AKE) is showing strong upward momentum, with its price around $0.00502, up approximately 99.21% in 24 hours.
Support: $0.00381
Resistance: $0.00637
Next Resistance: $0.00941
Trend: Bullish, but volatility is very high.
Market Outlook: AKE is experiencing a sharp price increase. Watch whether it can hold its support and approach resistance. Avoid assuming the rally will continue.
{future}(AKEUSDT)
#JobsReportRaisesHikeOdds #USNovemberMichiganExpectationsIndexPrelimAt50.9 #TradFiForBeginners
$AKE
Write a short AKE latest analysis with picture
🚀 AKEDO (AKE) Latest Market Analysis
Bullish Momentum
AKEDO (AKE) is showing strong upward momentum, with its price around $0.00502, up approximately 99.21% in 24 hours.
Support: $0.00381
Resistance: $0.00637
Next Resistance: $0.00941
Trend: Bullish, but volatility is very high.
Market Outlook: AKE is experiencing a sharp price increase. Watch whether it can hold its support and approach resistance. Avoid assuming the rally will continue.
#JobsReportRaisesHikeOdds #USNovemberMichiganExpectationsIndexPrelimAt50.9 #TradFiForBeginners
Write a short AKE latest analysis with picture
🚀 AKEDO (AKE) Latest Market Analysis
Bullish Momentum
AKEDO (AKE) is showing strong upward momentum, with its price around $0.00502, up approximately 99.21% in 24 hours.
Support: $0.00381
Resistance: $0.00637
Next Resistance: $0.00941
Trend: Bullish, but volatility is very high.
Market Outlook: AKE is experiencing a sharp price increase. Watch whether it can hold its support and approach resistance. Avoid assuming the rally will continue.
#JobsReportRaisesHikeOdds #USNovemberMichiganExpectationsIndexPrelimAt50.9 #TradFiForBeginners
162

·
--
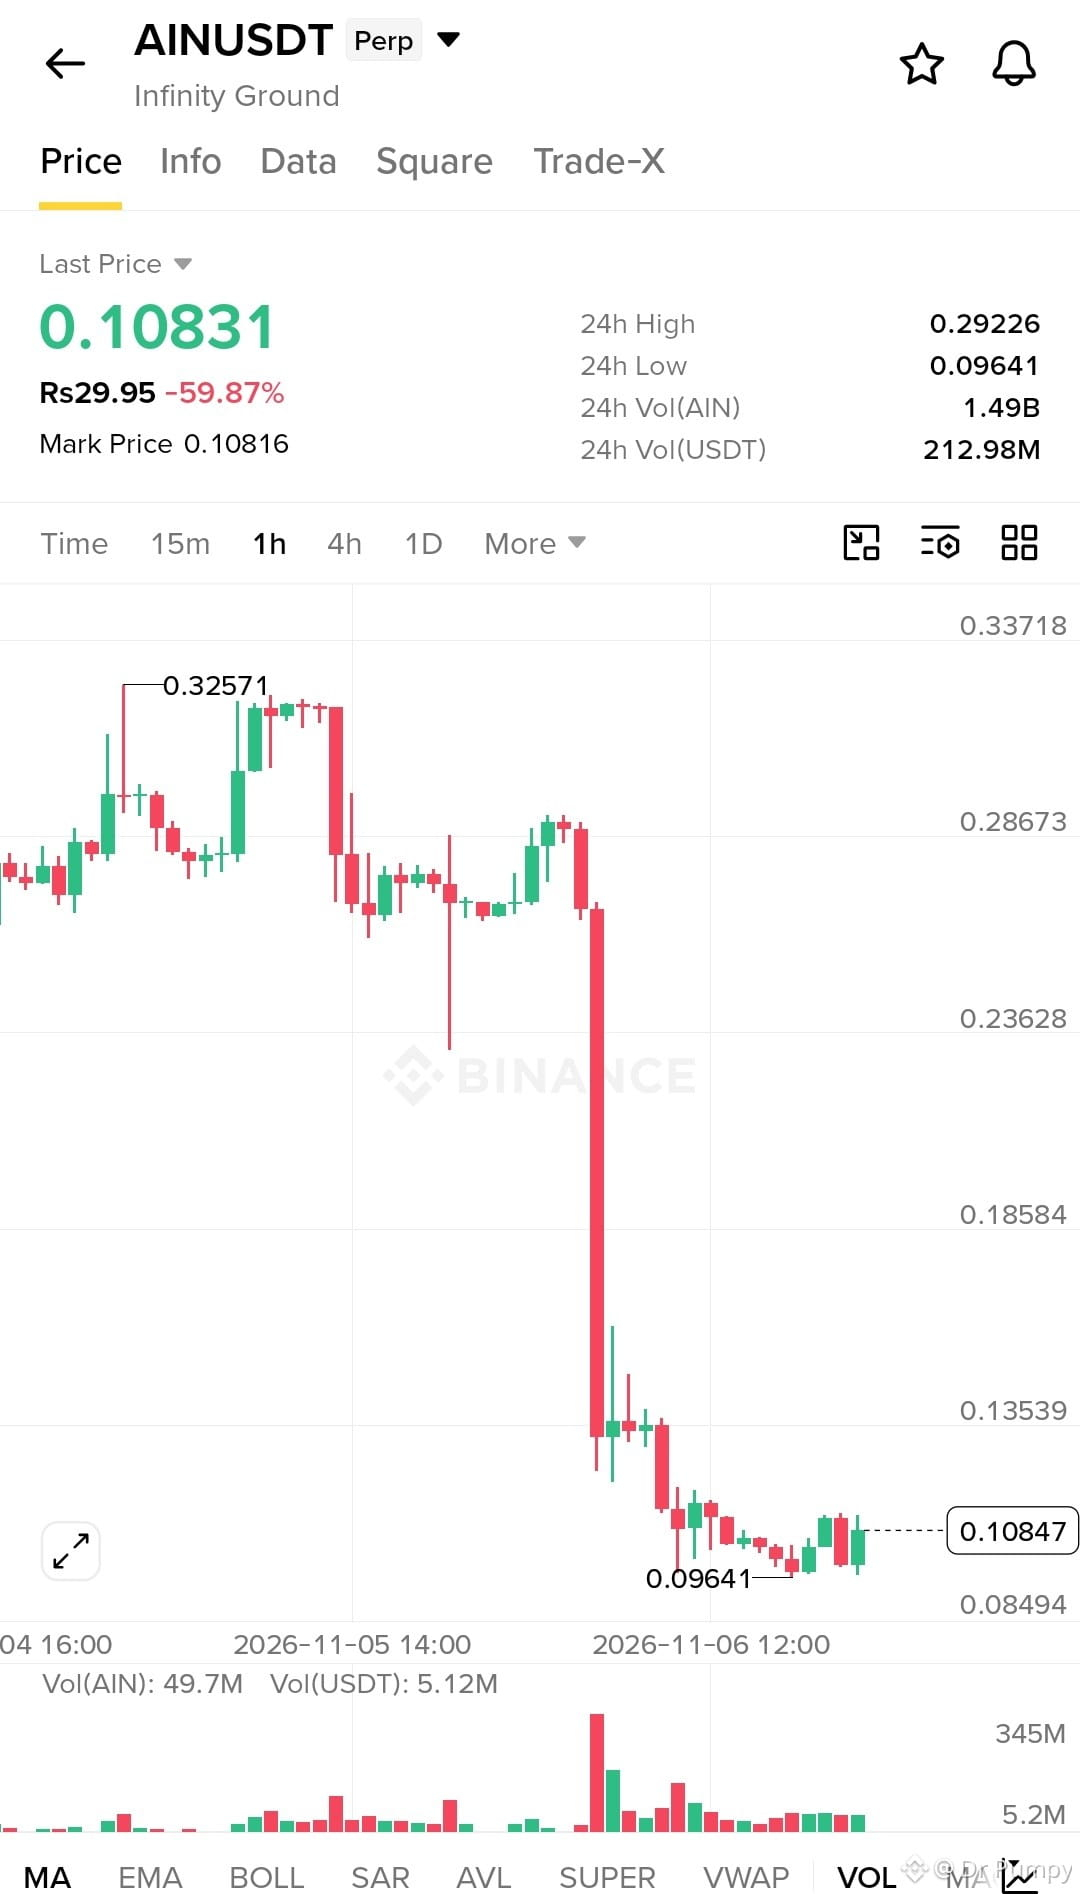
ai$AIN /USDT (Infinity Ground) — The $1.23K short liquidation at $0.11086 indicates short-covering activity. However, AIN is trading near $0.105, down over 60% in 24 hours. Short-term momentum remains bearish, with support near $0.0976 and resistance around $0.1065. Kairo Trade +2
EP: $0.1065–$0.1100 (Long only after breakout confirmation) TP1: $0.1150 TP2: $0.1230 TP3: $0.1350
SL: $0.0970
A sustained breakout above $0.1100 could support a recovery. If price loses $0.0976, further downside is possible.
AIN is highly volatile after its sharp decline. Verify the live exchange price before entry; these levels are conditional, not guaranteed.
#TradFiForBeginners #USMidtermsCouldShakeUpUS-IranTies $AIN
{future}(AINUSDT)
ai$AIN /USDT (Infinity Ground) — The $1.23K short liquidation at $0.11086 indicates short-covering activity. However, AIN is trading near $0.105, down over 60% in 24 hours. Short-term momentum remains bearish, with support near $0.0976 and resistance around $0.1065. Kairo Trade +2
EP: $0.1065–$0.1100 (Long only after breakout confirmation) TP1: $0.1150 TP2: $0.1230 TP3: $0.1350
SL: $0.0970
A sustained breakout above $0.1100 could support a recovery. If price loses $0.0976, further downside is possible.
AIN is highly volatile after its sharp decline. Verify the live exchange price before entry; these levels are conditional, not guaranteed.
#TradFiForBeginners #USMidtermsCouldShakeUpUS-IranTies $AIN
EP: $0.1065–$0.1100 (Long only after breakout confirmation) TP1: $0.1150 TP2: $0.1230 TP3: $0.1350
SL: $0.0970
A sustained breakout above $0.1100 could support a recovery. If price loses $0.0976, further downside is possible.
AIN is highly volatile after its sharp decline. Verify the live exchange price before entry; these levels are conditional, not guaranteed.
#TradFiForBeginners #USMidtermsCouldShakeUpUS-IranTies $AIN
227
·
--
$CYBER
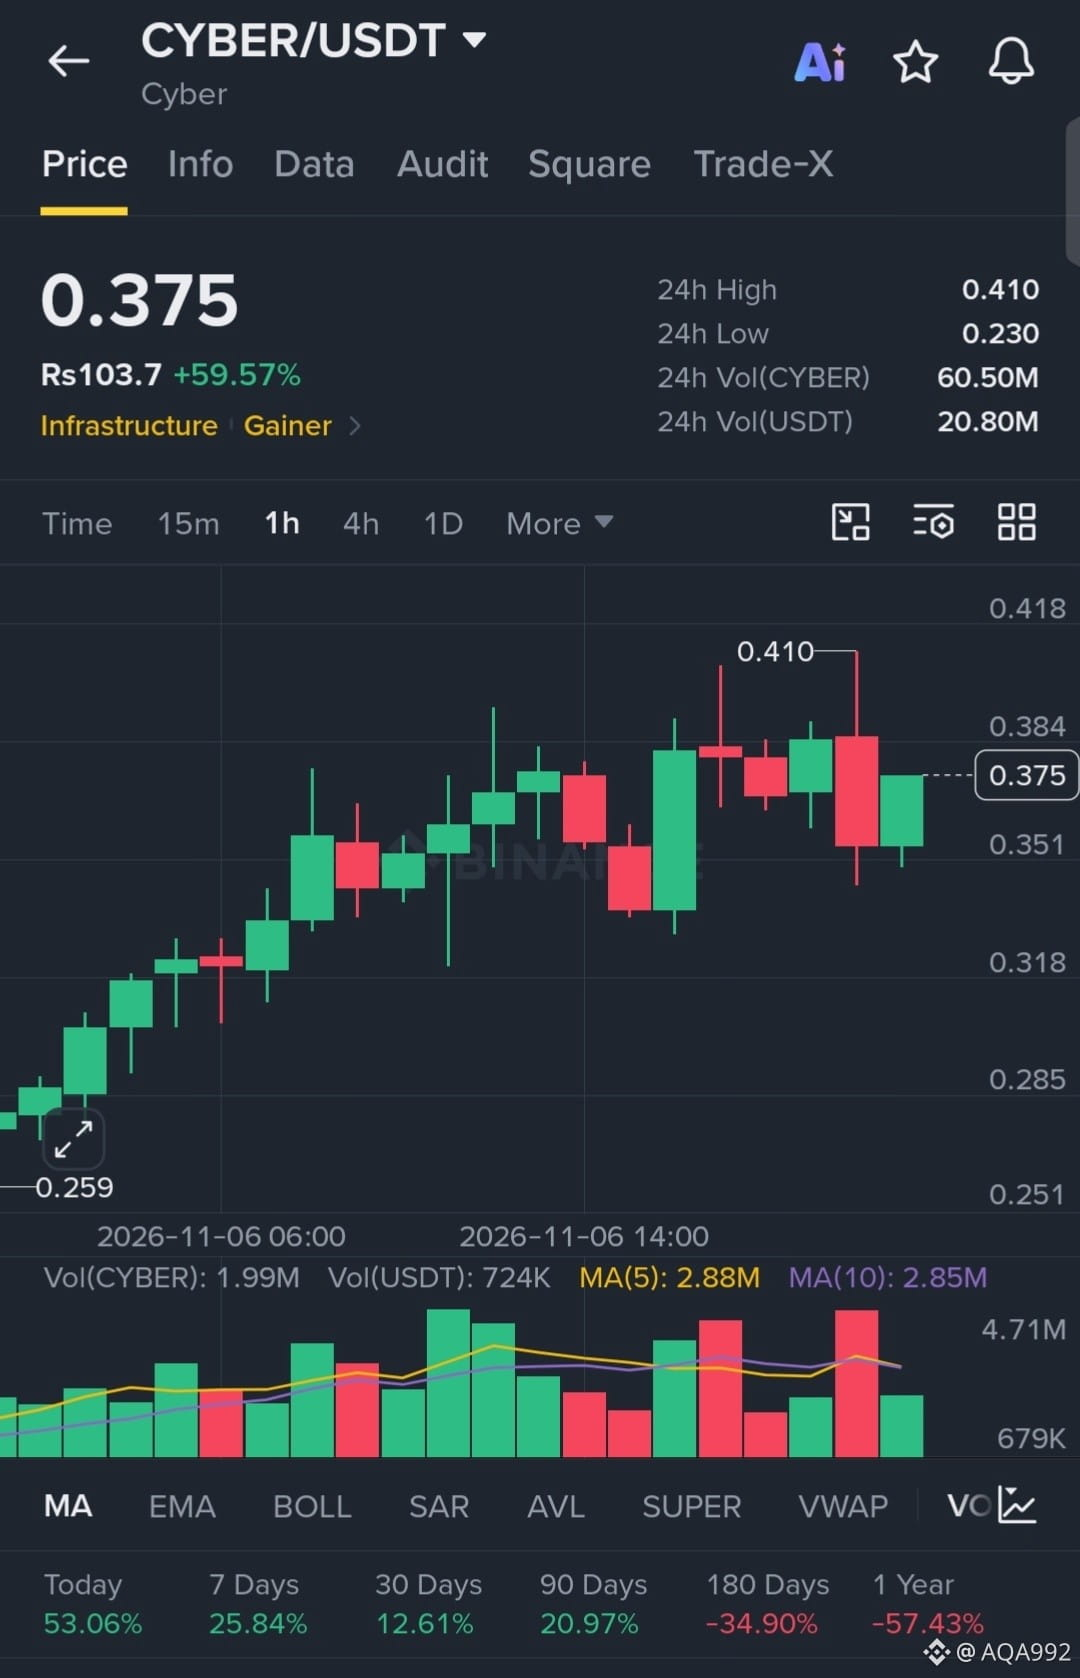
Momentum is aggressively bullish following a massive volume expansion. Price is establishing a healthy consolidation phase after a sharp impulse to 0.410. Buyers are actively defending higher lows, indicating a high-probability continuation setup. We are entering on the current retest to catch the next leg up.
EP: 0.365 - 0.378
TP1: 0.400
TP2: 0.425
TP3: 0.450
SL: 0.345
Execute with precision and respect the stop. $CYBER
#JobsReportRaisesHikeOdds
#USNovemberMichiganExpectationsIndexPrelimAt50.9
#AnthropicIPOValuationDoubts
#TradFiForBeginners
#USMidtermsCouldShakeUpUS-IranTies
{future}(CYBERUSDT)
$CYBER
Momentum is aggressively bullish following a massive volume expansion. Price is establishing a healthy consolidation phase after a sharp impulse to 0.410. Buyers are actively defending higher lows, indicating a high-probability continuation setup. We are entering on the current retest to catch the next leg up.
EP: 0.365 - 0.378
TP1: 0.400
TP2: 0.425
TP3: 0.450
SL: 0.345
Execute with precision and respect the stop. $CYBER
#JobsReportRaisesHikeOdds
#USNovemberMichiganExpectationsIndexPrelimAt50.9
#AnthropicIPOValuationDoubts
#TradFiForBeginners
#USMidtermsCouldShakeUpUS-IranTies
Momentum is aggressively bullish following a massive volume expansion. Price is establishing a healthy consolidation phase after a sharp impulse to 0.410. Buyers are actively defending higher lows, indicating a high-probability continuation setup. We are entering on the current retest to catch the next leg up.
EP: 0.365 - 0.378
TP1: 0.400
TP2: 0.425
TP3: 0.450
SL: 0.345
Execute with precision and respect the stop. $CYBER
#JobsReportRaisesHikeOdds
#USNovemberMichiganExpectationsIndexPrelimAt50.9
#AnthropicIPOValuationDoubts
#TradFiForBeginners
#USMidtermsCouldShakeUpUS-IranTies
2

·
--
🟢 $SOXS SHORT SQUEEZE ALERT — BEARS UNDER PRESSURE! ⚡
A fresh liquidation event has hit SOXS, with $55.2K in short positions wiped out at $72.33.
This signals that bearish traders faced pressure as the market moved against their positions. Short liquidations can accelerate upside momentum, especially when leveraged sellers are forced to exit.
📊 Liquidation Breakdown
- Asset: $SOXS
- Liquidated Side: Short 🟢
- Total Liquidation: $55,200
- Liquidation Price: $72.33
🎯 My Market Outlook:
The immediate focus is whether SOXS can sustain momentum above $72.33. If buyers maintain control, another upside push could develop. However, if price fails to hold its strength, a pullback or consolidation may follow.
🔥 Signal to Watch: A confirmed breakout with strong volume could favor bullish continuation, while rejection near resistance may create a reversal opportunity.
Trade Smart: Wait for price confirmation before entering. Liquidation data alone does not guarantee the next move.
#SOXS
#TradingSignals
#MarketAnalysis
#TradFiForBeginners
#JobsReportRaisesHikeOdds
{etf_us}(SOXS.ETF)
🟢 $SOXS SHORT SQUEEZE ALERT — BEARS UNDER PRESSURE! ⚡
A fresh liquidation event has hit SOXS, with $55.2K in short positions wiped out at $72.33.
This signals that bearish traders faced pressure as the market moved against their positions. Short liquidations can accelerate upside momentum, especially when leveraged sellers are forced to exit.
📊 Liquidation Breakdown
- Asset: $SOXS
- Liquidated Side: Short 🟢
- Total Liquidation: $55,200
- Liquidation Price: $72.33
🎯 My Market Outlook:
The immediate focus is whether SOXS can sustain momentum above $72.33. If buyers maintain control, another upside push could develop. However, if price fails to hold its strength, a pullback or consolidation may follow.
🔥 Signal to Watch: A confirmed breakout with strong volume could favor bullish continuation, while rejection near resistance may create a reversal opportunity.
Trade Smart: Wait for price confirmation before entering. Liquidation data alone does not guarantee the next move.
#SOXS
#TradingSignals
#MarketAnalysis
#TradFiForBeginners
#JobsReportRaisesHikeOdds
A fresh liquidation event has hit SOXS, with $55.2K in short positions wiped out at $72.33.
This signals that bearish traders faced pressure as the market moved against their positions. Short liquidations can accelerate upside momentum, especially when leveraged sellers are forced to exit.
📊 Liquidation Breakdown
- Asset: $SOXS
- Liquidated Side: Short 🟢
- Total Liquidation: $55,200
- Liquidation Price: $72.33
🎯 My Market Outlook:
The immediate focus is whether SOXS can sustain momentum above $72.33. If buyers maintain control, another upside push could develop. However, if price fails to hold its strength, a pullback or consolidation may follow.
🔥 Signal to Watch: A confirmed breakout with strong volume could favor bullish continuation, while rejection near resistance may create a reversal opportunity.
Trade Smart: Wait for price confirmation before entering. Liquidation data alone does not guarantee the next move.
#SOXS
#TradingSignals
#MarketAnalysis
#TradFiForBeginners
#JobsReportRaisesHikeOdds
SOXSETF-12.34%
SOXS-6.40%
37
·
--
🟢 $HYPE SHORT SQUEEZE ALERT — BEARS UNDER PRESSURE! 🚀
A fresh wave of buying pressure has triggered a short liquidation worth $78,100 at $78.84 on $HYPE!
⚡ What This Signals:
- 💥 $78.1K in short positions wiped out.
- 📈 Buyers are forcing bearish traders out of the market.
- 🔥 Short covering could provide additional upside momentum.
- 🎯 The $78.84 liquidation zone is now an important level to monitor.
🔮 My Market Outlook:
If bullish momentum continues and $HYPE holds above the $78.84 area, another upward push could develop. A sustained breakout may open the door toward higher resistance zones.
However, if buying pressure fades, expect a possible pullback as the market searches for support.
📊 Signal Provider's View: Short-term bias is cautiously BULLISH, but confirmation through price action and volume is essential. Watch for a breakout or a failed retest before considering an entry.
Stay sharp — the bears are feeling the pressure! 🐂🔥
#HYPE
#CryptoTrading
#LiquidationAlert
#MarketAnalysis
#TradFiForBeginners
{spot}(HYPEUSDT)
🟢 $HYPE SHORT SQUEEZE ALERT — BEARS UNDER PRESSURE! 🚀
A fresh wave of buying pressure has triggered a short liquidation worth $78,100 at $78.84 on $HYPE!
⚡ What This Signals:
- 💥 $78.1K in short positions wiped out.
- 📈 Buyers are forcing bearish traders out of the market.
- 🔥 Short covering could provide additional upside momentum.
- 🎯 The $78.84 liquidation zone is now an important level to monitor.
🔮 My Market Outlook:
If bullish momentum continues and $HYPE holds above the $78.84 area, another upward push could develop. A sustained breakout may open the door toward higher resistance zones.
However, if buying pressure fades, expect a possible pullback as the market searches for support.
📊 Signal Provider's View: Short-term bias is cautiously BULLISH, but confirmation through price action and volume is essential. Watch for a breakout or a failed retest before considering an entry.
Stay sharp — the bears are feeling the pressure! 🐂🔥
#HYPE
#CryptoTrading
#LiquidationAlert
#MarketAnalysis
#TradFiForBeginners
A fresh wave of buying pressure has triggered a short liquidation worth $78,100 at $78.84 on $HYPE!
⚡ What This Signals:
- 💥 $78.1K in short positions wiped out.
- 📈 Buyers are forcing bearish traders out of the market.
- 🔥 Short covering could provide additional upside momentum.
- 🎯 The $78.84 liquidation zone is now an important level to monitor.
🔮 My Market Outlook:
If bullish momentum continues and $HYPE holds above the $78.84 area, another upward push could develop. A sustained breakout may open the door toward higher resistance zones.
However, if buying pressure fades, expect a possible pullback as the market searches for support.
📊 Signal Provider's View: Short-term bias is cautiously BULLISH, but confirmation through price action and volume is essential. Watch for a breakout or a failed retest before considering an entry.
Stay sharp — the bears are feeling the pressure! 🐂🔥
#HYPE
#CryptoTrading
#LiquidationAlert
#MarketAnalysis
#TradFiForBeginners
37

·
--
Bullish
Bulls are stepping back into the building! 🟢
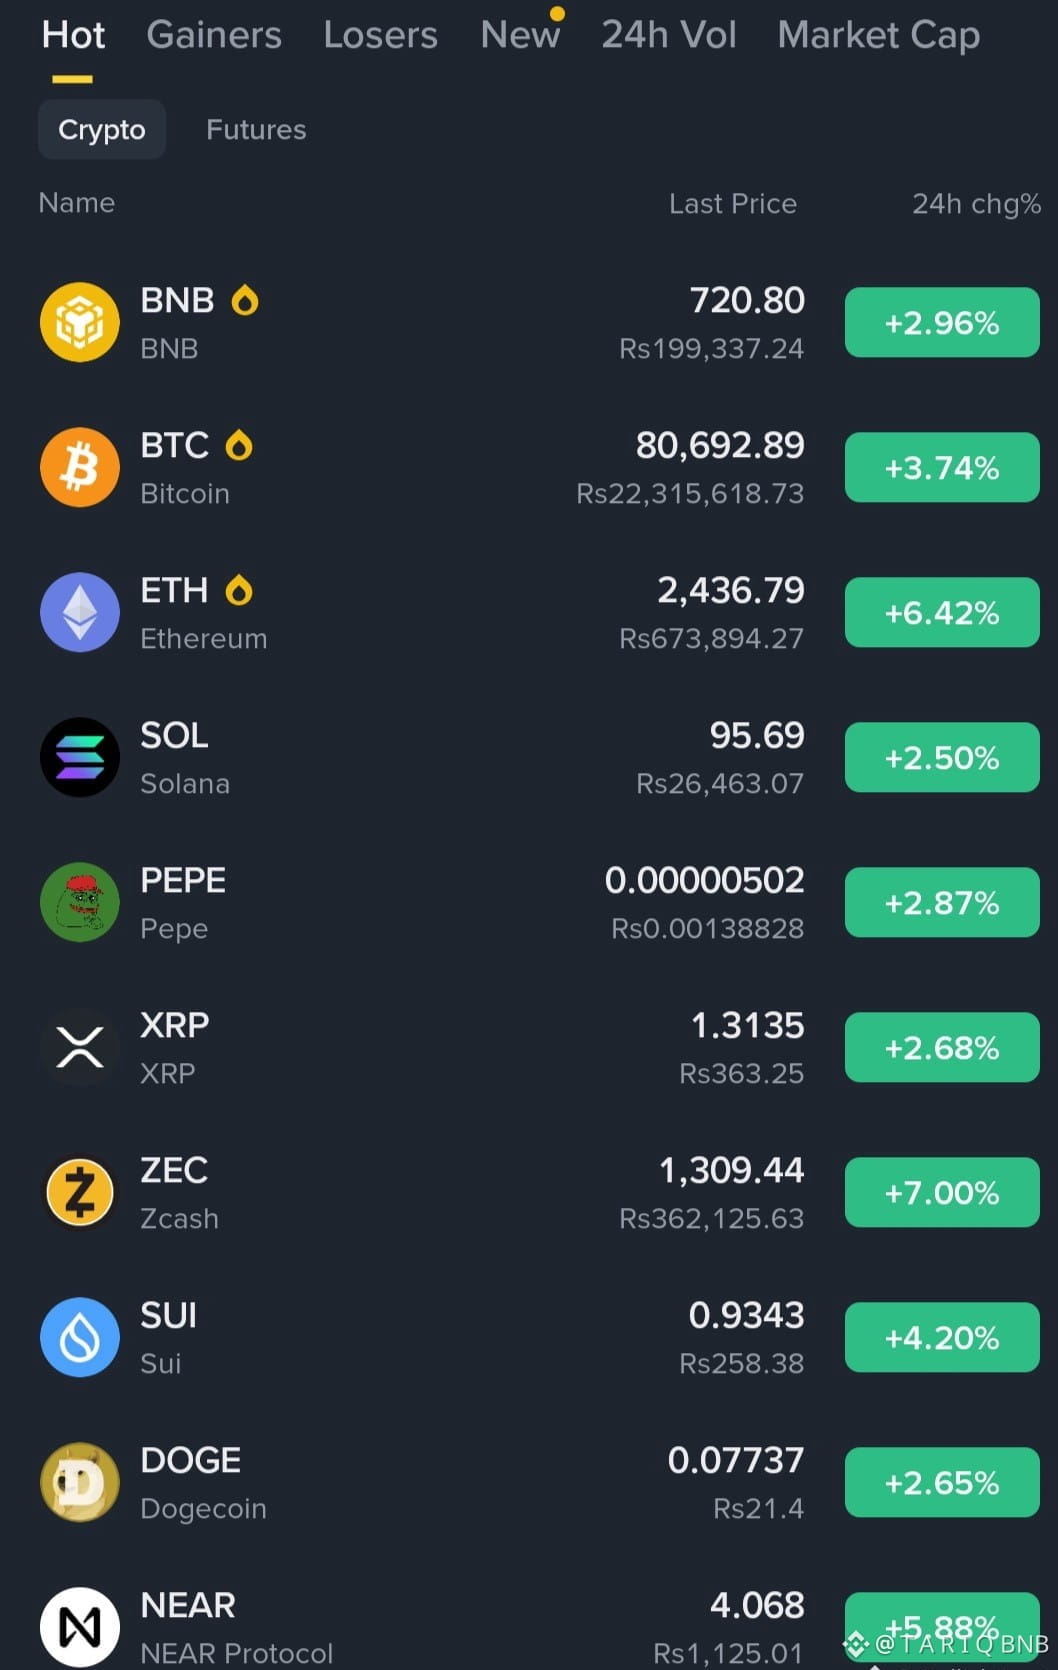
• $BTC holding strong back above $80K • $ZEC pushing +7% • $ETH up +6.42% • $NEAR claiming +5.88% • $SUI up +4.20% • $SOL holding firm around $96
One green day isn't a full recovery, but if Bitcoin holds above $80K, expect momentum to spread to altcoins fast. Is the tide turning? 📈
{future}(ZECUSDT)
#BinanceReopensWithdrawalsForMoreAssets #TradFiForBeginners
{future}(BTCUSDT)
{future}(ETHUSDT)
Bulls are stepping back into the building! 🟢
• $BTC holding strong back above $80K • $ZEC pushing +7% • $ETH up +6.42% • $NEAR claiming +5.88% • $SUI up +4.20% • $SOL holding firm around $96
One green day isn't a full recovery, but if Bitcoin holds above $80K, expect momentum to spread to altcoins fast. Is the tide turning? 📈
#BinanceReopensWithdrawalsForMoreAssets #TradFiForBeginners
• $BTC holding strong back above $80K • $ZEC pushing +7% • $ETH up +6.42% • $NEAR claiming +5.88% • $SUI up +4.20% • $SOL holding firm around $96
One green day isn't a full recovery, but if Bitcoin holds above $80K, expect momentum to spread to altcoins fast. Is the tide turning? 📈
#BinanceReopensWithdrawalsForMoreAssets #TradFiForBeginners
63
·
--
🚨 $TQQQ BULLS TAKE A HIT! $73.2K LONG LIQUIDATION EXPOSES MARKET PRESSURE! 🔴
The leveraged Nasdaq bulls just faced another painful shakeout!
📉 Liquidation Breakdown:
- Asset: $TQQQ
- Liquidated Position: Long
- Liquidation Value: $73,200
- Liquidation Price: $52.17
⚠️ What's Happening?
A $73.2K long liquidation at $52.17 signals that bullish leveraged traders were caught on the wrong side of the move. This could indicate weakening short-term momentum and increased downside pressure.
🎯 My Next Move Outlook:
Bearish Scenario: If TQQQ struggles to reclaim $52.17, further selling pressure could push price toward lower support zones.
Bullish Recovery: A strong rebound above $52.17, followed by sustained buying volume, could bring dip buyers back into the market.
🔥 Signal Provider Verdict: Avoid chasing leveraged longs until price confirms a recovery. Watch the $52.17 area closely — the next reaction could reveal whether bulls are ready to fight back or bears still control momentum.
Stay disciplined. Protect your capital. Let confirmation lead the trade!
#TQQQ
#Liquidation
#TradingSignals
#TradFiForBeginners
#AnthropicIPOValuationDoubts
{etf_us}(TQQQ.ETF)
🚨 $TQQQ BULLS TAKE A HIT! $73.2K LONG LIQUIDATION EXPOSES MARKET PRESSURE! 🔴
The leveraged Nasdaq bulls just faced another painful shakeout!
📉 Liquidation Breakdown:
- Asset: $TQQQ
- Liquidated Position: Long
- Liquidation Value: $73,200
- Liquidation Price: $52.17
⚠️ What's Happening?
A $73.2K long liquidation at $52.17 signals that bullish leveraged traders were caught on the wrong side of the move. This could indicate weakening short-term momentum and increased downside pressure.
🎯 My Next Move Outlook:
Bearish Scenario: If TQQQ struggles to reclaim $52.17, further selling pressure could push price toward lower support zones.
Bullish Recovery: A strong rebound above $52.17, followed by sustained buying volume, could bring dip buyers back into the market.
🔥 Signal Provider Verdict: Avoid chasing leveraged longs until price confirms a recovery. Watch the $52.17 area closely — the next reaction could reveal whether bulls are ready to fight back or bears still control momentum.
Stay disciplined. Protect your capital. Let confirmation lead the trade!
#TQQQ
#Liquidation
#TradingSignals
#TradFiForBeginners
#AnthropicIPOValuationDoubts
The leveraged Nasdaq bulls just faced another painful shakeout!
📉 Liquidation Breakdown:
- Asset: $TQQQ
- Liquidated Position: Long
- Liquidation Value: $73,200
- Liquidation Price: $52.17
⚠️ What's Happening?
A $73.2K long liquidation at $52.17 signals that bullish leveraged traders were caught on the wrong side of the move. This could indicate weakening short-term momentum and increased downside pressure.
🎯 My Next Move Outlook:
Bearish Scenario: If TQQQ struggles to reclaim $52.17, further selling pressure could push price toward lower support zones.
Bullish Recovery: A strong rebound above $52.17, followed by sustained buying volume, could bring dip buyers back into the market.
🔥 Signal Provider Verdict: Avoid chasing leveraged longs until price confirms a recovery. Watch the $52.17 area closely — the next reaction could reveal whether bulls are ready to fight back or bears still control momentum.
Stay disciplined. Protect your capital. Let confirmation lead the trade!
#TQQQ
#Liquidation
#TradingSignals
#TradFiForBeginners
#AnthropicIPOValuationDoubts
TQQQ+0.39%
TQQQETF+6.14%
37
·
--
🚀 $NEAR SHORT SQUEEZE ALERT — $193K WIPED OUT!
Bears just took a serious hit! 🟢 A massive $193,000 worth of NEAR short positions was liquidated at $3.781, signaling aggressive buying pressure and a potential shift in short-term market momentum.
🔥 What This Signals:
- Heavy short liquidation suggests sellers are getting squeezed.
- Bearish positions are being forced out of the market.
- Short-covering could provide additional upward momentum.
- Bulls now have an opportunity to challenge higher resistance zones.
📈 My Next Move Outlook:
NEAR could attempt another bullish push if buyers maintain control above the $3.78 area.
Bullish scenario: Sustained buying pressure may open the door for further upside.
Bearish scenario: Failure to hold momentum could trigger a pullback as the market searches for stronger support.
🎯 Trader's Strategy: Watch price action around $3.78 closely. Avoid chasing the move; wait for confirmation before entering a position.
The bears are under pressure — can NEAR turn this squeeze into a bigger rally? 👀
#NEAR
#CryptoTrading
#Liquidation
#USMidtermsCouldShakeUpUS-IranTies #TradFiForBeginners
{spot}(NEARUSDT)
🚀 $NEAR SHORT SQUEEZE ALERT — $193K WIPED OUT!
Bears just took a serious hit! 🟢 A massive $193,000 worth of NEAR short positions was liquidated at $3.781, signaling aggressive buying pressure and a potential shift in short-term market momentum.
🔥 What This Signals:
- Heavy short liquidation suggests sellers are getting squeezed.
- Bearish positions are being forced out of the market.
- Short-covering could provide additional upward momentum.
- Bulls now have an opportunity to challenge higher resistance zones.
📈 My Next Move Outlook:
NEAR could attempt another bullish push if buyers maintain control above the $3.78 area.
Bullish scenario: Sustained buying pressure may open the door for further upside.
Bearish scenario: Failure to hold momentum could trigger a pullback as the market searches for stronger support.
🎯 Trader's Strategy: Watch price action around $3.78 closely. Avoid chasing the move; wait for confirmation before entering a position.
The bears are under pressure — can NEAR turn this squeeze into a bigger rally? 👀
#NEAR
#CryptoTrading
#Liquidation
#USMidtermsCouldShakeUpUS-IranTies #TradFiForBeginners
Bears just took a serious hit! 🟢 A massive $193,000 worth of NEAR short positions was liquidated at $3.781, signaling aggressive buying pressure and a potential shift in short-term market momentum.
🔥 What This Signals:
- Heavy short liquidation suggests sellers are getting squeezed.
- Bearish positions are being forced out of the market.
- Short-covering could provide additional upward momentum.
- Bulls now have an opportunity to challenge higher resistance zones.
📈 My Next Move Outlook:
NEAR could attempt another bullish push if buyers maintain control above the $3.78 area.
Bullish scenario: Sustained buying pressure may open the door for further upside.
Bearish scenario: Failure to hold momentum could trigger a pullback as the market searches for stronger support.
🎯 Trader's Strategy: Watch price action around $3.78 closely. Avoid chasing the move; wait for confirmation before entering a position.
The bears are under pressure — can NEAR turn this squeeze into a bigger rally? 👀
#NEAR
#CryptoTrading
#Liquidation
#USMidtermsCouldShakeUpUS-IranTies #TradFiForBeginners
4


·
--
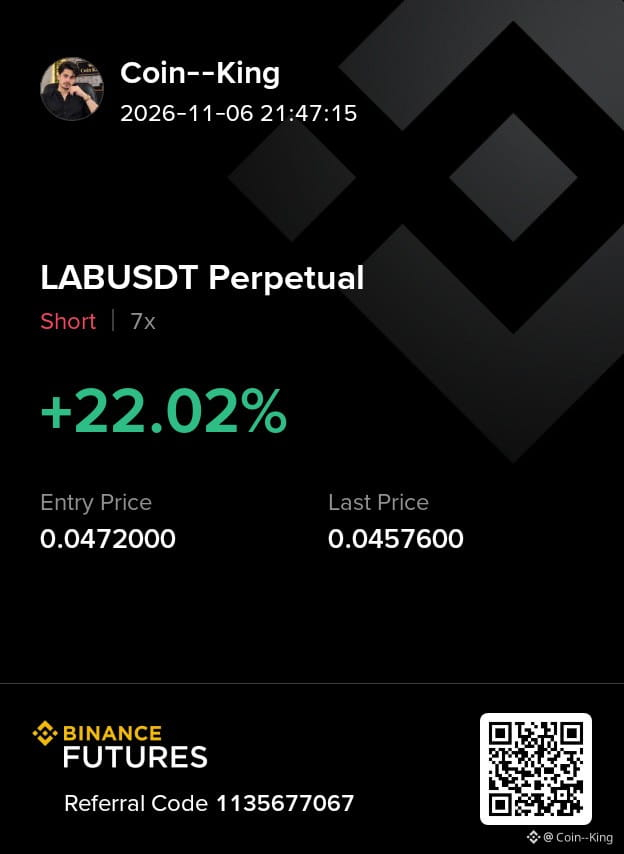
** $LAB USDT Short | 7x | +22%**
Watched the chart closely.
On the 4H, price kept rejecting from the higher zone.
0.0472 looked like clear supply. Volume was drying up on every push higher.
Funding was positive. Longs were getting crowded.
It tapped 0.0475–0.048 multiple times and failed to break.
RSI on the higher timeframes looked exhausted.
Daily structure was still printing lower highs.
Took the short at 0.0472. 7x.
Price didn’t hold. It rolled over cleanly.
Now sitting around 0.0457.
Trade is in good profit. Risk was managed from the start.
Markets are volatile. This was just my read.
Not financial advice. Do your own research.
$UAI $BTC
#JobsReportRaisesHikeOdds #USNovemberMichiganExpectationsIndexPrelimAt50.9 #AnthropicIPOValuationDoubts #TradFiForBeginners
** $LAB USDT Short | 7x | +22%**
Watched the chart closely.
On the 4H, price kept rejecting from the higher zone.
0.0472 looked like clear supply. Volume was drying up on every push higher.
Funding was positive. Longs were getting crowded.
It tapped 0.0475–0.048 multiple times and failed to break.
RSI on the higher timeframes looked exhausted.
Daily structure was still printing lower highs.
Took the short at 0.0472. 7x.
Price didn’t hold. It rolled over cleanly.
Now sitting around 0.0457.
Trade is in good profit. Risk was managed from the start.
Markets are volatile. This was just my read.
Not financial advice. Do your own research.
$UAI $BTC
#JobsReportRaisesHikeOdds #USNovemberMichiganExpectationsIndexPrelimAt50.9 #AnthropicIPOValuationDoubts #TradFiForBeginners
Watched the chart closely.
On the 4H, price kept rejecting from the higher zone.
0.0472 looked like clear supply. Volume was drying up on every push higher.
Funding was positive. Longs were getting crowded.
It tapped 0.0475–0.048 multiple times and failed to break.
RSI on the higher timeframes looked exhausted.
Daily structure was still printing lower highs.
Took the short at 0.0472. 7x.
Price didn’t hold. It rolled over cleanly.
Now sitting around 0.0457.
Trade is in good profit. Risk was managed from the start.
Markets are volatile. This was just my read.
Not financial advice. Do your own research.
$UAI $BTC
#JobsReportRaisesHikeOdds #USNovemberMichiganExpectationsIndexPrelimAt50.9 #AnthropicIPOValuationDoubts #TradFiForBeginners
1
198
·
--
🚀 $SOL SHORT SQUEEZE ALERT — BEARS ARE UNDER PRESSURE!
Solana is showing an interesting shift in liquidation activity! 🟢
💥 $64,300 in SOL short positions liquidated at $91.11.
This liquidation event suggests that bearish traders faced pressure as price moved against their positions. Forced short closures can add temporary buying momentum and create opportunities for further upside.
📊 My Market Outlook:
- Bullish Scenario: If SOL maintains momentum above $91.11, a push toward $92.50–$94.00 could develop.
- Bearish Scenario: Failure to hold the $91 zone may invite sellers back into the market.
- Key Signal: Watch for strong volume and sustained price acceptance above $91.11.
🎯 My Opinion: SOL has a potential bullish continuation setup, but confirmation is essential. I would watch for a successful retest before considering a long entry rather than chasing the move.
⚡ Stay alert — the next SOL move could catch overleveraged traders off guard!
#SOL
#Solana
#CryptoTrading
#TradFiForBeginners #AnthropicIPOValuationDoubts
{spot}(SOLUSDT)
🚀 $SOL SHORT SQUEEZE ALERT — BEARS ARE UNDER PRESSURE!
Solana is showing an interesting shift in liquidation activity! 🟢
💥 $64,300 in SOL short positions liquidated at $91.11.
This liquidation event suggests that bearish traders faced pressure as price moved against their positions. Forced short closures can add temporary buying momentum and create opportunities for further upside.
📊 My Market Outlook:
- Bullish Scenario: If SOL maintains momentum above $91.11, a push toward $92.50–$94.00 could develop.
- Bearish Scenario: Failure to hold the $91 zone may invite sellers back into the market.
- Key Signal: Watch for strong volume and sustained price acceptance above $91.11.
🎯 My Opinion: SOL has a potential bullish continuation setup, but confirmation is essential. I would watch for a successful retest before considering a long entry rather than chasing the move.
⚡ Stay alert — the next SOL move could catch overleveraged traders off guard!
#SOL
#Solana
#CryptoTrading
#TradFiForBeginners #AnthropicIPOValuationDoubts
Solana is showing an interesting shift in liquidation activity! 🟢
💥 $64,300 in SOL short positions liquidated at $91.11.
This liquidation event suggests that bearish traders faced pressure as price moved against their positions. Forced short closures can add temporary buying momentum and create opportunities for further upside.
📊 My Market Outlook:
- Bullish Scenario: If SOL maintains momentum above $91.11, a push toward $92.50–$94.00 could develop.
- Bearish Scenario: Failure to hold the $91 zone may invite sellers back into the market.
- Key Signal: Watch for strong volume and sustained price acceptance above $91.11.
🎯 My Opinion: SOL has a potential bullish continuation setup, but confirmation is essential. I would watch for a successful retest before considering a long entry rather than chasing the move.
⚡ Stay alert — the next SOL move could catch overleveraged traders off guard!
#SOL
#Solana
#CryptoTrading
#TradFiForBeginners #AnthropicIPOValuationDoubts
15

🚨 $TAO /USDT — LONG SIGNAL 🟢📈
🎯 Entry Zone: $222 – $225
* TP1: $230 🎯
* TP2: $235 🎯
* TP3: $242 🎯
🛑 Stop Loss: $217
📈 Confirmation
* 15M bullish candle confirmation.
* 1H support holding.
* Watch for breakout above $226.
* Wait for a retest with volume before entry.
* Avoid chasing green candles.
⚡ Leverage: 3x–5x
DYOR • NFA Trade Smart! 🔥
#JobsReportRaisesHikeOdds #WillAnthropicListOnTime #USNovemberMichiganExpectationsIndexPrelimAt50.9 #AnthropicIPOValuationDoubts #TradFiForBeginners
🚨 $TAO /USDT — LONG SIGNAL 🟢📈
🎯 Entry Zone: $222 – $225
* TP1: $230 🎯
* TP2: $235 🎯
* TP3: $242 🎯
🛑 Stop Loss: $217
📈 Confirmation
* 15M bullish candle confirmation.
* 1H support holding.
* Watch for breakout above $226.
* Wait for a retest with volume before entry.
* Avoid chasing green candles.
⚡ Leverage: 3x–5x
DYOR • NFA Trade Smart! 🔥
#JobsReportRaisesHikeOdds #WillAnthropicListOnTime #USNovemberMichiganExpectationsIndexPrelimAt50.9 #AnthropicIPOValuationDoubts #TradFiForBeginners
🎯 Entry Zone: $222 – $225
* TP1: $230 🎯
* TP2: $235 🎯
* TP3: $242 🎯
🛑 Stop Loss: $217
📈 Confirmation
* 15M bullish candle confirmation.
* 1H support holding.
* Watch for breakout above $226.
* Wait for a retest with volume before entry.
* Avoid chasing green candles.
⚡ Leverage: 3x–5x
DYOR • NFA Trade Smart! 🔥
#JobsReportRaisesHikeOdds #WillAnthropicListOnTime #USNovemberMichiganExpectationsIndexPrelimAt50.9 #AnthropicIPOValuationDoubts #TradFiForBeginners

2
47
·
--
🚨 $SNDK SHORT SQUEEZE ALERT — BEARS UNDER PRESSURE! 🟢
A notable liquidation event has hit $SNDK, with $50.9K in short positions wiped out at $856.21.
🐻 What Just Happened?
Short sellers betting against SNDK were forced out of their positions, potentially adding buying pressure and creating room for further upside momentum.
📊 My Market Outlook:
- Bullish Scenario: If buyers defend the $856 area, SNDK could attract fresh momentum and attempt another upward move.
- Bearish Scenario: Failure to hold this zone may trigger profit-taking and a possible pullback.
- Key Signal: Watch trading volume and price acceptance above $856.21 for confirmation.
🎯 My Trading Opinion:
The liquidation gives bulls an interesting advantage, but one event doesn't confirm a sustained breakout. I'd favor a cautious bullish bias while monitoring follow-through.
⚡ Stay alert — the next move could catch overleveraged traders off guard!
⚠️ Risk management is essential. Always wait for confirmation before entering a position.
#JobsReportRaisesHikeOdds #WillAnthropicListOnTime #TradFiForBeginners #AnthropicIPOValuationDoubts
#USMidtermsCouldShakeUpUS-IranTies
{stock_us}(SNDK.US)
🚨 $SNDK SHORT SQUEEZE ALERT — BEARS UNDER PRESSURE! 🟢
A notable liquidation event has hit $SNDK, with $50.9K in short positions wiped out at $856.21.
🐻 What Just Happened?
Short sellers betting against SNDK were forced out of their positions, potentially adding buying pressure and creating room for further upside momentum.
📊 My Market Outlook:
- Bullish Scenario: If buyers defend the $856 area, SNDK could attract fresh momentum and attempt another upward move.
- Bearish Scenario: Failure to hold this zone may trigger profit-taking and a possible pullback.
- Key Signal: Watch trading volume and price acceptance above $856.21 for confirmation.
🎯 My Trading Opinion:
The liquidation gives bulls an interesting advantage, but one event doesn't confirm a sustained breakout. I'd favor a cautious bullish bias while monitoring follow-through.
⚡ Stay alert — the next move could catch overleveraged traders off guard!
⚠️ Risk management is essential. Always wait for confirmation before entering a position.
#JobsReportRaisesHikeOdds #WillAnthropicListOnTime #TradFiForBeginners #AnthropicIPOValuationDoubts
#USMidtermsCouldShakeUpUS-IranTies
A notable liquidation event has hit $SNDK, with $50.9K in short positions wiped out at $856.21.
🐻 What Just Happened?
Short sellers betting against SNDK were forced out of their positions, potentially adding buying pressure and creating room for further upside momentum.
📊 My Market Outlook:
- Bullish Scenario: If buyers defend the $856 area, SNDK could attract fresh momentum and attempt another upward move.
- Bearish Scenario: Failure to hold this zone may trigger profit-taking and a possible pullback.
- Key Signal: Watch trading volume and price acceptance above $856.21 for confirmation.
🎯 My Trading Opinion:
The liquidation gives bulls an interesting advantage, but one event doesn't confirm a sustained breakout. I'd favor a cautious bullish bias while monitoring follow-through.
⚡ Stay alert — the next move could catch overleveraged traders off guard!
⚠️ Risk management is essential. Always wait for confirmation before entering a position.
#JobsReportRaisesHikeOdds #WillAnthropicListOnTime #TradFiForBeginners #AnthropicIPOValuationDoubts
#USMidtermsCouldShakeUpUS-IranTies
SNDK-2.43%
SNDKUS+4.42%
197
·
--
🚀 $SOXL SHORT SELLERS ARE GETTING SQUEEZED! Bulls Strike Back!
🟢 Short Liquidation Alert:
- Asset: $SOXL
- Liquidated Position: Short
- Total Liquidation: $61.8K
- Liquidation Price: $46.24
⚡ Market Insight:
A $61.8K short liquidation at $46.24 signals that bearish traders are facing pressure as price moves against their positions. This could indicate improving bullish momentum, especially if buyers continue defending higher levels.
📈 My Next Move Outlook:
If $SOXL holds above the $46.24 zone, another bullish push could develop, potentially triggering further short liquidations. However, failure to maintain this level may invite a pullback and renewed volatility.
🎯 Trading Strategy: Watch for a confirmed breakout and sustained buying volume before considering a long entry. Avoid chasing sudden spikes.
🔥 The Bulls Are Fighting Back — Will Bears Face Another Round of Liquidations?
#SOXL
#ShortSqueeze
#USMidtermsCouldShakeUpUS-IranTies
#TradFiForBeginners
#AnthropicIPOValuationDoubts
{etf_us}(SOXL.ETF)
🚀 $SOXL SHORT SELLERS ARE GETTING SQUEEZED! Bulls Strike Back!
🟢 Short Liquidation Alert:
- Asset: $SOXL
- Liquidated Position: Short
- Total Liquidation: $61.8K
- Liquidation Price: $46.24
⚡ Market Insight:
A $61.8K short liquidation at $46.24 signals that bearish traders are facing pressure as price moves against their positions. This could indicate improving bullish momentum, especially if buyers continue defending higher levels.
📈 My Next Move Outlook:
If $SOXL holds above the $46.24 zone, another bullish push could develop, potentially triggering further short liquidations. However, failure to maintain this level may invite a pullback and renewed volatility.
🎯 Trading Strategy: Watch for a confirmed breakout and sustained buying volume before considering a long entry. Avoid chasing sudden spikes.
🔥 The Bulls Are Fighting Back — Will Bears Face Another Round of Liquidations?
#SOXL
#ShortSqueeze
#USMidtermsCouldShakeUpUS-IranTies
#TradFiForBeginners
#AnthropicIPOValuationDoubts
🟢 Short Liquidation Alert:
- Asset: $SOXL
- Liquidated Position: Short
- Total Liquidation: $61.8K
- Liquidation Price: $46.24
⚡ Market Insight:
A $61.8K short liquidation at $46.24 signals that bearish traders are facing pressure as price moves against their positions. This could indicate improving bullish momentum, especially if buyers continue defending higher levels.
📈 My Next Move Outlook:
If $SOXL holds above the $46.24 zone, another bullish push could develop, potentially triggering further short liquidations. However, failure to maintain this level may invite a pullback and renewed volatility.
🎯 Trading Strategy: Watch for a confirmed breakout and sustained buying volume before considering a long entry. Avoid chasing sudden spikes.
🔥 The Bulls Are Fighting Back — Will Bears Face Another Round of Liquidations?
#SOXL
#ShortSqueeze
#USMidtermsCouldShakeUpUS-IranTies
#TradFiForBeginners
#AnthropicIPOValuationDoubts
SOXL-2.47%
SOXLETF+11.95%
27
·
--
🔴 $SNXX LONGS TAKE A HIT — BEARS GAIN MOMENTUM!
A fresh liquidation event has shaken the SNXX market, with $56.1K in leveraged long positions wiped out at $3.290.
⚠️ What This Signals:
- Long traders are facing increasing downside pressure.
- Forced liquidations may intensify short-term volatility.
- Bears could attempt to push SNXX toward lower support zones.
- Bulls need a convincing recovery to prevent further selling pressure.
📉 My Market Outlook:
SNXX could remain under bearish pressure if buyers fail to reclaim the $3.29 area. A continued rejection may open the door to another downward move, while a strong recovery above this level could trigger a relief bounce.
🎯 Trading Strategy: Watch the $3.29 zone closely. Avoid chasing the move and wait for price confirmation before taking a position.
The next move could catch overleveraged traders off guard!
#SNXX
#TradingSignals
#MarketWatch
#TradFiForBeginners #AnthropicIPOValuationDoubts
{etf_us}(SNXX.ETF)
🔴 $SNXX LONGS TAKE A HIT — BEARS GAIN MOMENTUM!
A fresh liquidation event has shaken the SNXX market, with $56.1K in leveraged long positions wiped out at $3.290.
⚠️ What This Signals:
- Long traders are facing increasing downside pressure.
- Forced liquidations may intensify short-term volatility.
- Bears could attempt to push SNXX toward lower support zones.
- Bulls need a convincing recovery to prevent further selling pressure.
📉 My Market Outlook:
SNXX could remain under bearish pressure if buyers fail to reclaim the $3.29 area. A continued rejection may open the door to another downward move, while a strong recovery above this level could trigger a relief bounce.
🎯 Trading Strategy: Watch the $3.29 zone closely. Avoid chasing the move and wait for price confirmation before taking a position.
The next move could catch overleveraged traders off guard!
#SNXX
#TradingSignals
#MarketWatch
#TradFiForBeginners #AnthropicIPOValuationDoubts
A fresh liquidation event has shaken the SNXX market, with $56.1K in leveraged long positions wiped out at $3.290.
⚠️ What This Signals:
- Long traders are facing increasing downside pressure.
- Forced liquidations may intensify short-term volatility.
- Bears could attempt to push SNXX toward lower support zones.
- Bulls need a convincing recovery to prevent further selling pressure.
📉 My Market Outlook:
SNXX could remain under bearish pressure if buyers fail to reclaim the $3.29 area. A continued rejection may open the door to another downward move, while a strong recovery above this level could trigger a relief bounce.
🎯 Trading Strategy: Watch the $3.29 zone closely. Avoid chasing the move and wait for price confirmation before taking a position.
The next move could catch overleveraged traders off guard!
#SNXX
#TradingSignals
#MarketWatch
#TradFiForBeginners #AnthropicIPOValuationDoubts
SNXXETF+6.25%
SNXX-8.01%
92


Guys, whoever gets in after me will make money hand over fist. Buy this coin: it used to be worth $20, and today it’s worth $3. It’s going to take off and go back to $20 again. $SNXXB
$XVS
$TRUMP
Get in now and you won’t regret it.
#TradFiForBeginners
{spot}(SNXXBUSDT)
{future}(XVSUSDT)
{future}(TRUMPUSDT)
Guys, whoever gets in after me will make money hand over fist. Buy this coin: it used to be worth $20, and today it’s worth $3. It’s going to take off and go back to $20 again. $SNXXB
$XVS
$TRUMP
Get in now and you won’t regret it.
#TradFiForBeginners
$XVS
$TRUMP
Get in now and you won’t regret it.
#TradFiForBeginners

4

·
--
Bullish
$BTC
Bitcoin is like an injection
that makes you go to hell
😂😂😂😂#TradFiForBeginners #USMidtermsCouldShakeUpUS-IranTies
$BTC
Bitcoin is like an injection
that makes you go to hell
😂😂😂😂#TradFiForBeginners #USMidtermsCouldShakeUpUS-IranTies
Bitcoin is like an injection
that makes you go to hell
😂😂😂😂#TradFiForBeginners #USMidtermsCouldShakeUpUS-IranTies

2
44

✍️🔴Here are the key highlights from the U.S. jobs report for October:
📍 Job growth accelerated and the unemployment rate edged down, as the U.S. economy added 165,000 nonfarm jobs, exceeding all forecasts. The unemployment rate fell to 4.1%.
📍 Upward revisions to the August and September figures added 84,000 jobs compared with the previously reported numbers.
📍 Employers in the healthcare and social assistance sectors added around 55,000 workers to their payrolls, the largest increase in six months.
📍 Hiring in the manufacturing sector continued its upward trend, adding 19,000 jobs, while the construction sector lost jobs.
📍 The labor force participation rate edged up to 61.9%, its highest level since March. Average hourly earnings also rose 0.4% from September and 3.1% year over year.
📍 Traders’ bets on an interest rate hike in December increased following the release of the data, with investors now pricing in a 78% probability of a rate increase that month.
$BTC
{future}(BTCUSDT)
$PEPE
{spot}(PEPEUSDT)
$SOL
{future}(SOLUSDT)
#BinanceReopensWithdrawalsForMoreAssets
#USNovemberMichiganExpectationsIndexPrelimAt50.9
#AnthropicIPOValuationDoubts
#TradFiForBeginners
#USMidtermsCouldShakeUpUS-IranTies
✍️🔴Here are the key highlights from the U.S. jobs report for October:
📍 Job growth accelerated and the unemployment rate edged down, as the U.S. economy added 165,000 nonfarm jobs, exceeding all forecasts. The unemployment rate fell to 4.1%.
📍 Upward revisions to the August and September figures added 84,000 jobs compared with the previously reported numbers.
📍 Employers in the healthcare and social assistance sectors added around 55,000 workers to their payrolls, the largest increase in six months.
📍 Hiring in the manufacturing sector continued its upward trend, adding 19,000 jobs, while the construction sector lost jobs.
📍 The labor force participation rate edged up to 61.9%, its highest level since March. Average hourly earnings also rose 0.4% from September and 3.1% year over year.
📍 Traders’ bets on an interest rate hike in December increased following the release of the data, with investors now pricing in a 78% probability of a rate increase that month.
$BTC
$PEPE
$SOL
#BinanceReopensWithdrawalsForMoreAssets
#USNovemberMichiganExpectationsIndexPrelimAt50.9
#AnthropicIPOValuationDoubts
#TradFiForBeginners
#USMidtermsCouldShakeUpUS-IranTies
📍 Job growth accelerated and the unemployment rate edged down, as the U.S. economy added 165,000 nonfarm jobs, exceeding all forecasts. The unemployment rate fell to 4.1%.
📍 Upward revisions to the August and September figures added 84,000 jobs compared with the previously reported numbers.
📍 Employers in the healthcare and social assistance sectors added around 55,000 workers to their payrolls, the largest increase in six months.
📍 Hiring in the manufacturing sector continued its upward trend, adding 19,000 jobs, while the construction sector lost jobs.
📍 The labor force participation rate edged up to 61.9%, its highest level since March. Average hourly earnings also rose 0.4% from September and 3.1% year over year.
📍 Traders’ bets on an interest rate hike in December increased following the release of the data, with investors now pricing in a 78% probability of a rate increase that month.
$BTC
$PEPE
$SOL
#BinanceReopensWithdrawalsForMoreAssets
#USNovemberMichiganExpectationsIndexPrelimAt50.9
#AnthropicIPOValuationDoubts
#TradFiForBeginners
#USMidtermsCouldShakeUpUS-IranTies

91
Log in to explore more content
Join global crypto users on Binance Square
⚡️ Get latest and useful information about crypto.
💬 Trusted by the world’s largest crypto exchange.
👍 Discover real insights from verified creators.
Email / Phone number
Trending Topics
1
#BitcoinRebounds$75KAsChipsLead
3 views
7 Discussing
2
#JobsReportRaisesHikeOdds
22,281 views
415 Discussing
3
#US Data Center Rules May Constrain AI Expansion
3,499 views
50 Discussing
4
#$2TWipedOutHedgeFundsFaceLiquidation
7,886 views
65 Discussing
5
#USNovemberMichiganExpectationsIndexPrelimAt50.9
2,063 views
99 Discussing
6
#OilPlungesBelow$100
5,638 views
27 Discussing
7
#TradFiForBeginners
77 views
24 Discussing
8
#USMidtermsCouldShakeUpUS-IranTies
17,765 views
296 Discussing
9
#RussianCentralBankNamesBTCETHUSDTForNonQualifiedInvestors
269 views
3 Discussing
10
#HyperliquidStrategiesHolds38.52MillionHYPE
5,345 views
144 Discussing